Using Modified Automatic Seeded Region Growing
Iman Avazpour, M. Iqbal Saripan, Abdul Jalil Nordin,
and Raja Syamsul Azmir Raja Abdullah
Abstract
In the image segmentation process of positron emission tomography combined with computed tomography (PET/CT) imaging, previous works used information in CT only for segmenting the image without utilizing the information that can be provided by PET. This paper proposes to utilize the hot spot values in PET to guide the segmentation in CT, in automatic image segmentation using seeded region growing (SRG) tech-nique. This automatic segmentation routine can be used as part of automatic diagnostic tools. In addition to the original initial seed selection using hot spot values in PET, this paper also introduces a new SRG growing criterion, the sliding windows. Fourteen images of patients having extrapulmonary tuberculosis have been ex-amined using the above-mentioned method. To evaluate the performance of the modified SRG, three fidelity criteria are measured: percentage of under-segmentation area, percentage of over-segmentation area, and av-erage time consumption. In terms of the under-segmentation percentage, SRG with avav-erage of the region growing criterion shows the least error percentage (51.85%). Meanwhile, SRG with local averaging and var-iance yielded the best results (2.67%) for the over-segmentation percentage. In terms of the time complexity, the modified SRG with local averaging and variance growing criterion shows the best performance with 5.273 s average execution time. The results indicate that the proposed methods yield fairly good performance in terms of the over- and under-segmentation area. The results also demonstrated that the hot spot values in PET can be used to guide the automatic segmentation in CT image.
Keywords: Seeded Region Growing, Segmentation, Dual Modality Imaging, Positron Emission Tomography, Computed Tomography.
1. Introduction
Tuberculosis infection (TB) has been pandemic in countries with-in the tropical regions for decades (1). This airborne disease is eas-ily spread through the air in tiny droplets discharged in a cough by
Shulin Li (ed.),Biological Procedures Online, Volume 11, Number 1 © to the author(s) 2009
DOI: 10.1007/s12575-009-9013-0 URL:springerprotocols.com; springerlink.com
a person suffering from active tuberculosis of the lungs known as pulmonary TB. TB can also affect other parts of body such as brain, bones, lymph nodes, kidneys, and skin. Thereby, it will be named as extrapulmonary tuberculosis (EPTB) infection (2).
Positron emission tomography combined with computed to-mography (PET/CT) is opening its way in clinical applications, especially in cancer staging and post-therapy surveillance with ex-pansion into infection and inflammation (3–8). In this dual imag-ing modality, PET images provide information on metabolic activity of lesions, while CT images provide morphological infor-mation. This fusion technique has helped to increase the visual perception of images; however, diagnosing and analyzing these images is time consuming and a great challenge for experts. Fur-thermore, early lesion recognition will help determining the most effective treatment to be instituted to the patient. The purpose of this work is to introduce new automated segmentation framework which can help in better diagnosis of medical images, utilizing new dual imaging modalities. This framework can be used as part of automatic lesion detection and classification tools.
Since Adams and Bischof introduced seeded region grow-ing (SRG) segmentation (9), the algorithm has been improv-ing, and different growing criteria have been introduced. Approaches, like comparing the pixel to be added with the av-erage intensity of the region grown at each step, maximum pixel value at region boundary, or maximum value of the pix-els inside the region, tried to improve segmentation accuracy by controlling overgrowing to homogenous neighboring areas (9, 10). Hojjatoleslami and Kittler introduced a new approach to SRG using average contrast and peripheral contrast to con-trol the growing process and to make it predictable (11). Mehnert and Jackway improved SRG algorithm to be pixel-or-der-independent, processing pixels with same value in parallel, using priority queues (12). Wan and Higgins expanded SRG a bit further and introduced symmetric region growing based on line-by-line processing of the image, making segmentation less sensitive to the selection of initial seeds (13). All these algo-rithms require a starting point to begin segmentation proce-dure, and their authors have considered different routines for this purpose. Here, we are proposing a new way to start segmentation based on the data acquired from another imag-ing modality.
in better segmentation of organs in CT image using PET image data as starting point for the segmentation procedure.
The remainder of this paper is organized as follows. In
section2, proposed GC for SRG algorithm has been defined, and previously introduced GCs have been carefully examined. The segmentation results have been compared using over- and under-segmentation percentages and time complexity of each method insection 3. In section 4, we then discuss each algo-rithm's performance based on the acquired results.
2. Materials and
Methods
In this study, patients were fasted overnight and injected with 18F-fluorodeoxyglucose (18F-FDG) radionuclide 45 min before the scan. Imaging studies were performed using Biograph 6, Sie-mens Medical Solutions Inc. PET/CT machine. Acquisition time was 3 min per bed position with seven bed positions covering from vertex to the mid-thigh. CT imaging was performed prior to PET imaging with patients in still position. A bolus injection of 100 ml of iodinated contrast media (Omnipaque 300, Amer-sham Health) was given intravenously. Acquisition parameters for six slices CT were 130 kV, 60 mAs, 0.8 s per CT rotation, 2.5 mm slice thickness, pitch 1.5.
New PET/CT devices come together on a single platform, and the patient will be imaged for both PET and CT at the same position, so there will be little patient movement (14, 15). Both PET and CT images have been registered using cross-correlation and transformed to the position where they are best correlated (16).
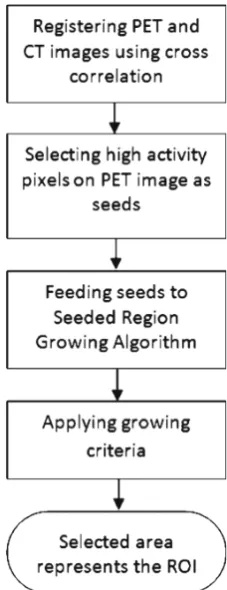
High-activity lesions in PET image appear with higher inten-sity due to more absorption of radio isotope material and higher rate of radioactivity (17). Malignant cells demonstrate higher met-abolic activity than benign lesions. Hence, they absorb more radio isotope material (in this case, 18F-FDG), and the amount of ra-dioactivity will increase in those lesions, causing them to appear brighter in the image (5). Points with maximum intensity value on PET image were selected as candidates that may suggest infec-tion or malignant lesions. Since candidate points represent the highest pixel intensity, using different brightness and contrast will not affect the procedure. These points will be used to guide seg-mentation process. An overview of the whole segseg-mentation pro-cess has been shown inFig. 1.
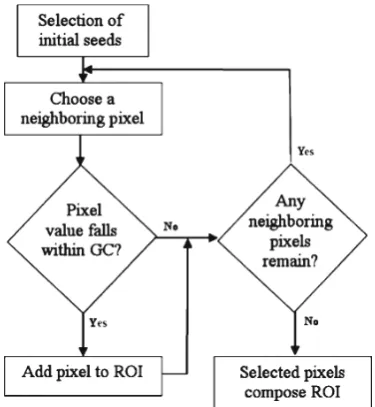
high-intensity pixel coordinates as starting points of the segmen-tation procedure and expanding the region of interest (ROI) by checking their neighboring pixels on CT image. A GC will be de-fined so that at each step boundary, neighboring pixels that fall in this GC will be added to the region. The growing process will con-tinue until there is no other bilinear neighboring pixel of the ROI that falls within this GC. The whole SRG procedure is shown in
Fig.2. The method proposed by Adams and Bischof, region averag-ing (9), has been tested. In addition, we have proposed two other aspects of GC, sliding windows and region averaging and variance.
2.1. Region Averaging Here at each step, the average pixel intensity values of the region grown so far is calculated, and each neighboring pixel_s intensity value is compared with this average (9). We have considered the first seed point as the initial average. As the region grows, the av-erage is calculated to control the growing process. GC has been set to ROI average value ± a threshold valueT.
GC ¼Avg ROIð Þ T: ½1
ThresholdT is defined by the user to satisfy image specifica-tions. User is asked to assign a threshold value which has the clos-est result to desired segmentation.
2.2. Local Averaging and Variance
Another aspect is to apply average and variance locally to con-trol growing process. A local maskMof 32×32 pixels has been used to calculate the average and standard deviation of intensity values in masking area around each seed point. GC then has been defined as:
GC ¼AvgðMÞ STDðMÞ ½2
Where Avg(M) is the average pixel value of the maskMand STD(M) is its standard deviation. At each step, pixels with the value within this GC will be added to the ROI. Growing process stops when there is no neighboring pixel that satisfies this criterion.
2.3. The Proposed Sliding Windows
Computed tomography images have various intensity properties, and different body lesions appear with different intensity; this calls the need for examining the specification of image before segmen-tation. CT images usually have 512×512 pixels dimension, so two local maskMs(16×16 pixels) andMl (64×64 pixels) centered at the seed point coordinate have been defined and average pixel val-ue of both calculated. Considering these averages, we have:
If Avg Msð ÞGAvg Mlð ÞthenThe area to be segmented is brighter than the surrounding area
If Avg Msð Þ9Avg Mlð ÞthenThe area to be segmented is darker than the surrounding area
ElseThe segmentation area and surrounding have relatively same intensity
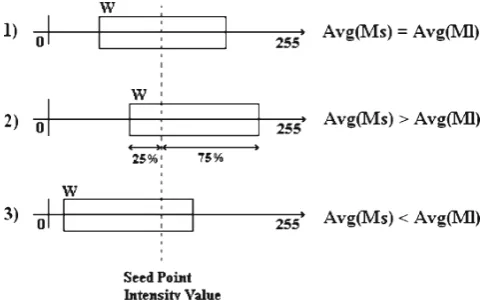
Where Avg() is the average pixel value of the masking area. Having grayscale color spectrum, assume GC to be an interval window (W) centered at the seed point intensity value. Any pixel with intensity value falling within Wwill be accepted as part of the ROI. If the area to be segmented is relatively of the same average intensity than the surroundings (Avg(Ms) = Avg(Ml)), Wwill be centered at the seed point intensity value. If the area to be segmented is brighter than the surrounding area (Avg (Ms) 9 Avg(Ml)), W will be slid to cover areas of brighter in-tensity, so we give more credit to brighter pixels to be added to the ROI. The same procedure occurs if the segmentation area is darker (Avg(Ms)GAvg(Ml)), but this time, Wwill be slid to cover areas of darker intensity. This concept is better shown in
Fig. 3.
The percentage of sliding and the size of masks andWcan be defined to satisfy the specification of the images to be examined. Here, when there is difference in average intensity ofMs andMl, Whas been slid by 25% of its size.Whas been defined as a win-dow of size 30. Region growing process will continue until there is no other bilinear neighboring pixel of the ROI with value falling withinW.
3. Results
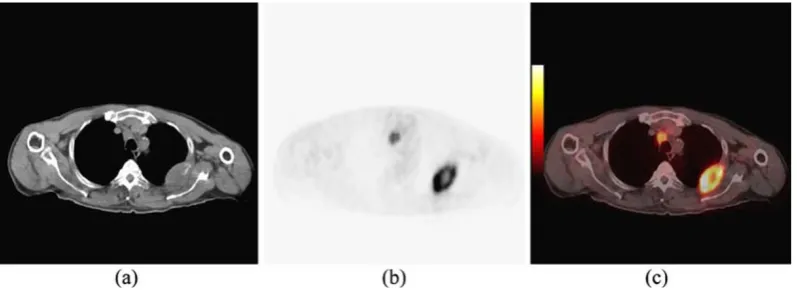
Images used in this study were acquired using a dual-modality PET/CT imaging device (Biograph 6, Siemens). Fourteen images of patients having EPTB were examined using the above-mentioned algorithms, and all methods were imple-mented in Matlab. Figure 4 shows CT, PET, and PET/CT
fused image of a patient having EPTB. As can be seen in
Fig. 4a, organ structures are clearly defined in CT image, and boundary edges provide a suitable platform for segmenta-tion algorithms. Figure4b represents PET image on the same axial cross-section of the patient body. Although areas of high ac-tivity can be seen clearly in PET image, it is very difficult to define the body organs they belong to. Therefore, segmentation procedures have been conducted on CT images individually and have not con-sidered the data represented by PET image.
In order to have a basis for segmentation evaluation, images have been sent to medical sources, and desired ROIs have been surveyed and selected manually by a certified radiologist. The manually selected ROIs have been set as benchmark data for op-timum segmentation, and the segmentation results have to be compared with this benchmarked data.
Figure5shows the results of all segmentation algorithms on the image shown inFig.4. Manually selected desired ROI is shown in
Fig.5a, and segmentation results have been shown inFig.5b–d. As can be seen visually on images,Fig.5c, which is the segmentation result from the proposed SRG using sliding windows, has the best accuracy in terms of lesion segmentation, but it also deals with some over-segmentation.Figure5d, which is the result of SRG using local averaging and variance, suffers from under-segmentation. The re-gion has not been grown enough to cover the lesion, and only areas around seed points have been selected.
To evaluate the effectiveness of the proposed methods, seg-mentation accuracy and time complexity have been considered. Segmentation accuracy has been tested based on calculation of over- and under-segmentation factors. Time complexity also has been defined by measuring the amount of time that each algo-rithm has consumed to finish its procedure.
The under- and over-segmentation errors were calculated in com-parison with the desired manually selected ROI usingEqs.3and4.
Under Segmentation f(x,y), f (x,y) = {(x,y) | (x,y)
∈ DesiredROI & (x,y) ∉ SelectedROI }
(
½3
Over Segmentation f(x,y), f (x,y) = {(x,y) | (x,y)
∈ SelectedROI & (x,y) ∉ DesiredROI }
)
½4
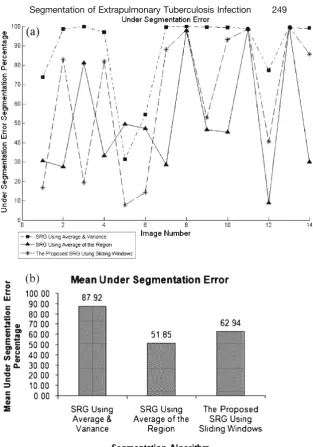
Where under-segmentation error f (x,y)( has been calculated by counting number of pixels (x,y) in the desired ROI which have not been selected by the algorithm, and the results are shown in
Fig. 6. Over-segmentation error f (x,y)
(
is also calculated by counting number of pixels (x,y) in selected area by the algorithm which is not in desired manually selected ROI, and the results are shown by charts inFig.7. The lesser value indicates better seg-mentation accuracy.
As can be seen inFig.6, SRG using local average and variance suffers from under-segmentation and SRG using average of re-gion has the least under-segmentation error. This means that more areas of desired ROI will be covered using SRG with aver-age of the region. On the other hand, considering over-segmen-tation errors in Fig.7, SRG using local averaging and variance presents the least over-segmentation errors. The proposed SRG using sliding windows deals with over-segmentation.
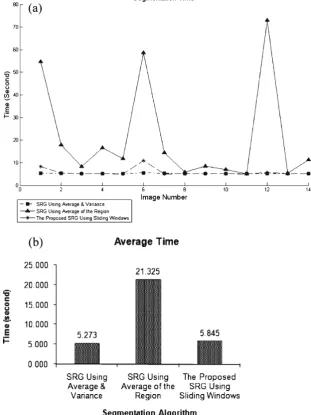
Since all algorithms have been implemented using the same programming language and they all share the same image registra-tion method, time complexity of the procedure has also been measured and is shown inFig.8. Since at each step the average of the region grown so far needs to be calculated in SRG using average of the region, the time complexity of the whole process becomes too high when the grown region is relatively big. Other algorithms represent almost the same time complexities.
4. Conclusions
neighboring areas (13). Therefore, we proposed the usage of dual modality imaging to use the data acquired from one modality to start the segmentation of images from another modality. Different aspects of GC have been tested to examine the efficiency of seed point selection from PET image on SRG segmentation.
to be able to recognize it. Therefore, less undsegmentation er-ror is more desirable, bringing the fact that SRG using local aver-aging and variance cannot offer good results. If time complexity of the process is not an important issue, SRG using average of the region represents the most appreciated performance when guided by PET image data. Otherwise, the sliding windows can be chosen as the GC of choice for SRG segmentation.
This article has proposed a new scheme for automatic seg-mentation of dual modality medical images using seeded region growing. We proposed a new growing criterion to be used in SRG algorithm and compared its results with previously intro-duced criterions. Among the methods used here, SRG using re-gion averaging is considered as supervised segmentation since it requires user involvement, and the rest are considered as unsuper-vised automatic segmentation.
References
1. Guo N, Marra F, Marra C (2009) Measur-ing health-related quality of life in tubercu-losis: a systematic review. Health Quality Life Outcomes 7:14
2. Sharma SK, Mohan A (2004) Extrapulmo-nary tuberculosis. Indian J Med Res 120 (4):316–353
3. Guo H, Zhu H, Xi Y, Zhang B, Li L, Huang Y et al (2007) Diagnostic and prog-nostic value of 18F-FDG PET/CT for patients with suspected recurrence from squamous cell carcinoma of the esophagus. J Nucl Med 48:1251–1258
4. Miller JC, Fischman AJ, Aquino SL, Blake MA, Thrall JH, Lee SI (2007) FDG-PET CT for tumor imaging. J Am Coll Radiol 4:256–259
5. Goo JM, Im J, Do K, Yeo JS, Seo JB, Kim HY et al (2000) Pulmonary tuberculoma evaluated by means of FDG PET: findings in 10 cases. Radiology 216:117–121 6. Nguyen N, Chaar B, Osman M (2007)
Prev-alence and patterns of soft tissue metastasis: detection with true whole-body F-18 FDG PET/CT. BMC Med Imaging 7:8
7. Roedl JB, Prabhakar HB, Mueller PR, Colen RR, Blake MA (2009) Prediction of metastatic disease and survival in patients with gastric and gastroesophageal junction tumors: the incremental value of PET-CT over PET and the clinical role of primary tumor volume measurements. Acad Radiol 16:218–226
8. Caoili EM, Korobkin M, Brown RKJ, Mackie G, Shulkin BL (2007)
Differentiat-ing adrenal adenomas from nonadenomas using 18F-FDG PET/CT: quantitative and qualitative evaluation. Acad Radiol 14:468–475
9. Adams R, Bischof L (1994) Seeded region growing, pattern analysis and machine in-telligence. IEEE Trans Image Process 16:641–647
10. SA Hojjatoleslami, J Kittler, Automatic de-tection of calcification in mammograms, Image Processing and its Applications, 1995., Fifth International Conference on. (1995) 139–143.
11. Hojjatoleslami SA, Kittler J (1998) Region growing: a new approach, image processing. IEEE Trans Image Process 7:1079–1084 12. Mehnert A, Jackway P (1997) An improved
seeded region growing algorithm. Pattern Recognit Lett 18:1065–1071
13. Shu-Yen Wan, WE Higgins, Symmetric re-gion growing, Image Processing, 2000. Proceedings. 2000 International Confer-ence on. 2 (2000) 96–99 vol.2.
14. Beyer T, Townsend DW, Brun T, Kinahan PE, Charron M, Roddy R et al (2000) A combined PET/CT scanner for clinical on-cology. J Nucl Med 41:1369–1379 15. Townsend DW, Beyer T (2002) A
com-bined PET/CT scanner: the path to true image fusion. Br J Radiol 75:S24–S30 16. Lewis J (1995) Fast normalized
cross-cor-relation. Vision Interface 10:120–123 17. Rohren EM, Turkington TG, Coleman RE