SUMMER 2018, Vol 4, Issue 1, JOURNAL OF HYDRAULIC STRUCTURES Shahid Chamran University of Ahvaz
Journal of Hydraulic Structures J. Hydraul. Struct., 2018; 4(1): 55-74
DOI: 10.22055/JHS.2018.25552.1071
Study of Streamlines under the Influence of Displacement of
Submerged Vanes in Channel Width, and at the Upstream Area
of a Cylindrical Bridge Pier in a 180 Degree Sharp Bend
Chonoor Abdi Chooplou1
Mohammad Vaghefi2
Seyyed Hamed Meraji3
Abstract
In this paper, submerged vanes were placed at the upstream area of a bridge pier located at the 90 degree angle. Then, using the laboratory equipment, a study of flow pattern was conducted throughout the bend, specifically around the pier and submerged vanes. ADV velocimeter was incorporated in order to help measure 3D velocity components. Submerged vanes were installed at distances of 40 and 60% of the channel width from the inner bank at the upstream area of the bridge; while the distance between the vanes and the pier (5 times the pier diameter) and the distance between the vanes themselves (3 times the pier diameter) were held constant during the experiments. The results demonstrated that moving the submerged vanes towards the outer bank created a vortex at a distance of 5 times the pier diameter from the center of the pier in upstream direction at a distance of 33% of the channel width from the inner bank at a height of 6.9 cm, equal to 30 times the flow depth from the bed.
Keywords:Flow Pattern, Bridge Pier, Submerged Vanes, Velocity Contours, 180 Degree Sharp Bend
Received: 17 April 2018; Accepted: 27 May 2018
1. Introduction
Flow pattern around bridge piers is highly complicated, and such complexity is intensified due to formation of scour holes around the pier. Development of this hole around the piers results in depletion underneath the foundations, thus destruction of the bridge. Collision of the
1 M.Sc. Student of Hydraulic Structures, Civil Engineering Department, Persian Gulf University, Bushehr,
Iran. [email protected]
2 Associate Professor of Hydraulic Structures, Civil Engineering Department, Persian Gulf University,
Bushehr, Iran. [email protected] (Corresponding Author)
3 Assistant Professor of Hydraulic Structures, Civil Engineering Department, Persian Gulf University,
SUMMER 2018, Vol 4, Issue 1, JOURNAL OF HYDRAULIC STRUCTURES Shahid Chamran University of Ahvaz
flow with the pier forms a horseshoe vortex, and separation of the flow from the pier entails formation of vortices called rising vortices.
SUMMER 2018, Vol 4, Issue 1, JOURNAL OF HYDRAULIC STRUCTURES Shahid Chamran University of Ahvaz
flow pattern and shear stress calculation in a 180 degree sharp bend by using ADV in an experimental study. Haji Azizi et al. [15] carried out a numerical investigation of the flow around a bridge pier in the vicinity of submerged vanes by using fluent software program. Their work concluded a desirable correspondence between experimental and numerical results. Ben Mohammad Khajeh et al. [16] experimentally studied the effect of inclination of a cylindrical bridge pier installed at the apex of a 180 degree sharp bend on scour pattern. Their work demonstrated that the maximum and minimum scouring occurred in the scour hole around the pier in the case of inclination towards the outer and the inner banks respectively equal to 1.05 and 0.70 times the flow depth at the upstream straight path. Karimi et al. [17] investigated the effect of inclination angle of the bridge pier on scour process. To this aim, cylindrical piers of four different inclination angles were placed in a straight channel, and the experiments were conducted at four different flow rates under clear water conditions. The results of their study reported the minimum and maximum scour depths to have occurred from the 0 to 15 degree angles of the pier. Dee et al. (2017) studied bank erosion and protection by using a submerged vane placed at an optimum angle in a 180 degree laboratory channel bend. As is observed, a great number of studies have so far been carried out on empty bends, as well as on bridge piers in straight paths; however, the effect of submerged vanes on scour pattern around the bridge pier and the flow pattern around the pier in the bend has not been investigated. The present study experimentally examines the effect of a 10% displacement of submerged vanes through the channel width in proportion to the central line of the channel at the upstream area on the pattern of flow and scour around a cylindrical bridge pier located at the apex of a 180 degree sharp bend along by measuring 3D velocity.
2. Materials and Methods
The experiments have been conducted in a bended channel with a rectangular section, with a ratio of central line curvature radius to channel width (R/B) equal to 2 and a rectangular section with a 180 degree central angle in the advanced laboratory of hydraulic structures in Persian Gulf University. Width and height of the channel are respectively 100 and 70 cm. The upstream and downstream straight ends of the flume are respectively 6.5 and 5 meters long.
Figure 1. A view of the laboratory flume (Vaghefi et al. 2016)
SUMMER 2018, Vol 4, Issue 1, JOURNAL OF HYDRAULIC STRUCTURES Shahid Chamran University of Ahvaz
The scour experiments were conducted under clear water and incipient motion conditions. The Froude number is 0.29, and the Reynolds number is approximately 51480 during the experiments. In scour experiments, a laser distance meter was used for recording and consolidating the bed.
In flow pattern experiments, an air compressor and then a fiberglass paste were used for freezing and consolidating the bed. Calculation of each of these factors requires possession of velocity values at different points of the flow zone under study. Hence, the flow meshing in this work was assumed from 0 to 180 degree sections of the bend with 50 points at 1.5 degree intervals in length, and 50 points at approximately 2 cm intervals in width. The height of the mesh was collected at 10 points in height, including 2, 4, 6, and 8 cm beneath the base level, and 1, 3, 6, and 10 cm above the base level. Finally, the measurement was conducted at 4 and 1 cm distances from the water surface by using a side-looking velocity probe. Vectrino 3D velocimeter was employed to measure velocity components.
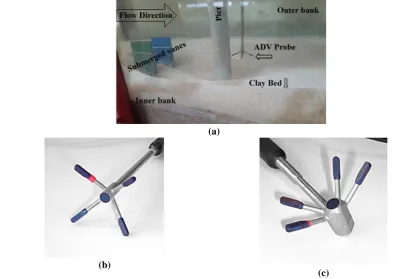
Figure (2) depicts the position of the velocimeter in the 180 degree bend with its two different probes. Two experiments were carried out by installing submerged vanes at a distance of 5 times the pier diameter, at two positions of 40 (PFV) and 60% of the channel width from the inner bank (PSV). The mentioned submerged vanes are rectangular, made of plexiglass, 1 cm thick, and 7.5 cm long, placed at the 25 degree horizontal angle. The bridge pier is made of PVC as thick as 5 cm, placed at the 90 degree position to the beginning of the bend.
(a)
(b)
(c)
Figure 2. a) the position of Vectrino velocimeter in the 180 degree sharp bend, and a view of b)
SUMMER 2018, Vol 4, Issue 1, JOURNAL OF HYDRAULIC STRUCTURES Shahid Chamran University of Ahvaz
down-looking, and c) side-looking probes
3. Results and Observations
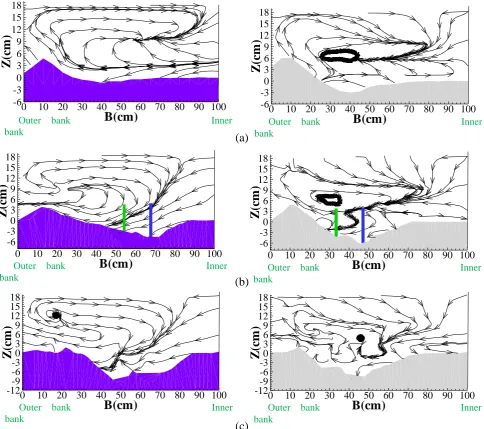
Figures (3) through (6) provide drawings of streamlines at different cross sections in PFV and PSV experiments. Along the channel, where the effect of the longitudinal pressure gradient is reduced, the centrifugal force governs the field, and the secondary flow is observed as a single circular cell at the cross section, which is known as the main secondary flow or the primary secondary flow.
(a)
(b)
(c)
Figure 3. A view of the flow pattern in a) 75, b) 81.5, and c) 814.5 degree cross sections of the bend. (PFV experiment on the right, and PSV experiment on the left)
B(cm)
Z
(c
m
)
0 10 20 30 40 50 60 70 80 90 100 -6 -3 0 3 6 9 12 15 18
Outer bank Inner bank
B(cm)
Z
(c
m
)
0 10 20 30 40 50 60 70 80 90 100 -12-9 -6 -30 3 6 9 12 15 18
Outer bank Inner bank
B(cm)
Z
(c
m
)
0 10 20 30 40 50 60 70 80 90 100 -6 -3 0 3 6 9 12 15 18
Outer bank Inner bank
B(cm)
Z
(c
m
)
0 10 20 30 40 50 60 70 80 90 100 -6 -3 0 3 6 9 12 15 18
Outer bank Inner bank
B(cm)
Z
(c
m
)
0 10 20 30 40 50 60 70 80 90 100 -6 -3 0 3 6 9 12 15 18
Outer bank Inner bank
B(cm)
Z
(c
m
)
0 10 20 30 40 50 60 70 80 90 100 -12-9 -6 -30 3 6 9 12 15 18
SUMMER 2018, Vol 4, Issue 1, JOURNAL OF HYDRAULIC STRUCTURES Shahid Chamran University of Ahvaz
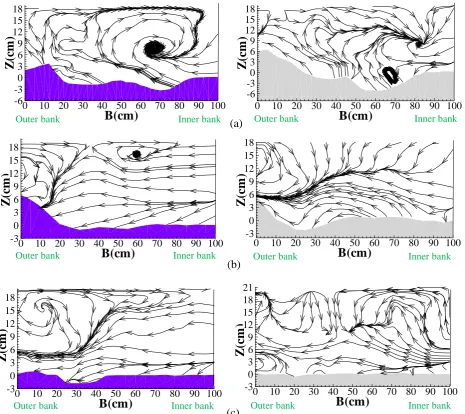
Figure (3) shows the flow pattern at the upstream area of submerged vanes at the location of the vanes in the experiments. It can be observed that the streamlines show the secondary flow in both experiments at the 75 degree angle, equal to 10 times the pier diameter in upstream direction (Figure (3-a)).
By advancing through the bend in downstream direction and approaching the submerged vanes, the effect of submerged vanes on flow begins to be manifested, so that in both experiments, flow separation in upstream direction occurs at the 81.5 degree angle at a distance equal to 7 times the pier diameter. As is observed, with increase in the distance between submerged vanes and the inner bank, the vortices gradually shrink, which is the cause of reduction in scour at this section ((Figure (3-b)). Figure (3-c) shows the cross section in the 84.5 degree position.
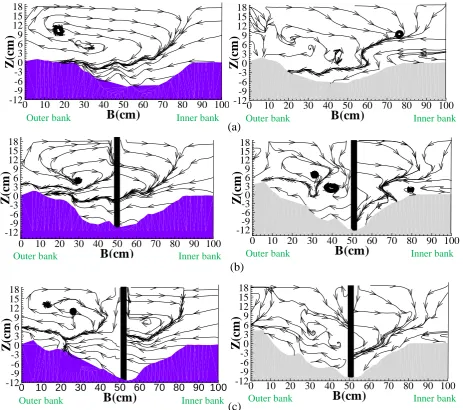
Figure 4. A view of the flow pattern at a) 86, b) 89, and c) 90.5 degree cross sections in the bend. (PFV experiment on the right, and PSV experiment on the left)
B(cm)
Z
(c
m
)
0 10 20 30 40 50 60 70 80 90 100 -12-9 -6 -30 3 6 9 12 15 18
Outer bank Inner bank
B(cm)
Z
(c
m
)
0 10 20 30 40 50 60 70 80 90 100 -12-9 -6 -30 3 6 9 12 15 18
Outer bank Inner bank
B(cm)
Z
(c
m
)
0 10 20 30 40 50 60 70 80 90 100
-12-9 -6 -30 3 6 9 12 15 18
Outer bank Inner bank
B(cm)
Z
(c
m
)
0 10 20 30 40 50 60 70 80 90 100 -12-9 -6 -30 3 6 9 12 15 18
Outer bank Inner bank
B(cm)
Z
(c
m
)
0 10 20 30 40 50 60 70 80 90 100 -12-9 -6 -30 3 6 9 12 15 18
Outer bank Inner bank
B(cm)
Z
(c
m
)
0 10 20 30 40 50 60 70 80 90 100 -12-9 -6 -30 3 6 9 12 15 18
Outer bank Inner bank
(a)
(b)
SUMMER 2018, Vol 4, Issue 1, JOURNAL OF HYDRAULIC STRUCTURES Shahid Chamran University of Ahvaz
According to the figure, it can be observed that when the submerged vanes are located at a distance of 40% of the channel width from the inner bank, the central vortex is inclined towards the outer bank, because the presence of sediment piles at the inner bank at this section, reduction of pressure gradient near the bed, and occurrence of the maximum kinetic energy near the outer bank incline the transverse flow towards the outer bank.
Figure (4) presents cross sections at the area around the pier. With a 10% displacement of submerged vanes in proportion to the central line of the channel, the inclination of the vortex towards the inner bank increases by 64% (Figure (4-a)). Generally, at the area around the pier, the flow pattern undergoes changes due to collision with the pier. Hence, the collision of the streamlines with bed surface increases.
This generates a flow upwards in the direction of the inner bank. In PFV experiment in Figure (4-b), the main secondary flow in the inner bend is observed as two vortices in two zones. The first zone represents 31% of the channel width from the inner bank and 7% of the flow depth from the bed, and the second zone represents 39% of the channel width from the inner bank and 3% of the flow depth from the bed. In PSV experiment, this is formed at a distance of 30% of the channel width from the inner bank at a depth of 5% of the flow depth from the bed. As is seen in Figure (4-c), the streamlines in the vicinity of the inner bank of the pier towards the channel bed push scour and bed materials out of the hole.
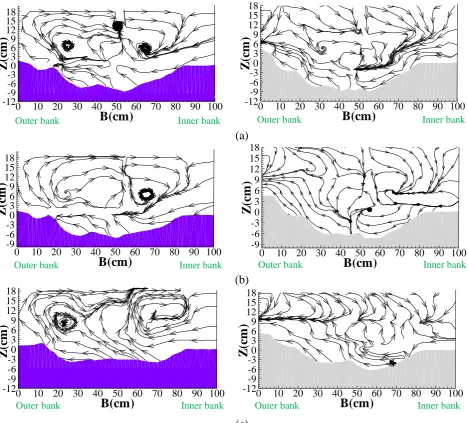
Figure (5) depicts the flow pattern at the cross sections at the downstream area of the pier location. The flow at the downstream area of the pier returns to the state before collision with the pier. Away from the pier area in downstream direction, turbulence resulting from the presence of the pier and submerged vanes gradually fades.
SUMMER 2018, Vol 4, Issue 1, JOURNAL OF HYDRAULIC STRUCTURES Shahid Chamran University of Ahvaz
Figure (6) represents cross sections at the end of the bend. In PFV case, such turbulence and vortices are still observed at a distance of 10 times the pier diameter in downstream direction (at the 100 degree angle from the beginning of the bend) in Figure (6-a). Whereas, in PSV
experiment, turbulence occurs all the way to the end of the bend; thus, a small vortex is formed at the 140 degree angle in the middle of the channel (Figure (6-b)). As in Figure (6-c), in PSV experiment, the center of the main secondary flow occurs at a distance of 0 to 40% of the channel width from the inner bank at a height of 80% of the flow depth from the bed.
(a)
(b)
(c)
Figure 5. A view of the flow pattern at the a) 92, b) 93.5, and c) 96 degree cross sections of
the bend. (PFV experiment on the right, and PSV experiment on the left)
B(cm)
Z
(c
m
)
0 10 20 30 40 50 60 70 80 90 100 -12-9 -6 -3 0 3 6 9 12 15 18
Outer bank Inner bank
B(cm)
Z
(c
m
)
0 10 20 30 40 50 60 70 80 90 100 -9 -6 -3 0 3 6 9 12 15 18
Outer bank Inner bank
B(cm)
Z
(c
m
)
0 10 20 30 40 50 60 70 80 90 100 -12-9 -6 -30 3 6 9 12 15 18
Outer bank Inner bank
B(cm)
Z
(c
m
)
0 10 20 30 40 50 60 70 80 90 100 -9 -6 -3 0 3 6 9 12 15 18
Outer bank Inner bank
B(cm)
Z
(c
m
)
0 10 20 30 40 50 60 70 80 90 100 -12 -9 -6 -3 0 3 6 9 12 15 18
Outer bank Inner bank
B(cm)
Z
(c
m
)
0 10 20 30 40 50 60 70 80 90 100 -12-9 -6 -30 3 6 9 12 15 18
SUMMER 2018, Vol 4, Issue 1, JOURNAL OF HYDRAULIC STRUCTURES Shahid Chamran University of Ahvaz
Figure 6. A view of the flow pattern at the a) 100, b) and c) 160 degree cross sections of the bend. (PFV experiment on the right, and PSV experiment on the left)
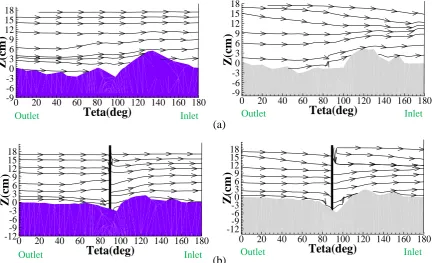
An instance of flow pattern in longitudinal sections near the inner bank in mid-channel is drawn in Figure (7). Since longitudinal sections are a result of vertical and tangential velocities, and the tangential velocity is greater than vertical velocity, the streamlines near the banks at the sections are almost parallel, with a large distance from the pier. Figure (7-a) and Figure (7-b) demonstrate longitudinal sections at the area of the central line of the bend and the inner bank. As is observed in Figure (7-b), the flow pattern in both experiments has changed under the influence of the pier, and a return flow is generated near the water surface at the downstream side of the pier, which is due to the effect of down flow after collision with the pier. Such a flow continues after collision with the pier, following a path parallel with the formed longitudinal streamlines. Such variations have occurred from the middle up to the surface of the flow, while
B(cm)
Z
(c
m
)
0 10 20 30 40 50 60 70 80 90 100 -6 -3 0 3 6 9 12 15 18
Outer bank Inner bank
B(cm)
Z
(c
m
)
0 10 20 30 40 50 60 70 80 90 100 -6 -3 0 3 6 9 12 15 18
Outer bank Inner bank
B(cm)
Z
(c
m
)
0 10 20 30 40 50 60 70 80 90 100 -3 0 3 6 9 12 15 18
Outer bank Inner bank
B(cm)
Z
(c
m
)
0 10 20 30 40 50 60 70 80 90 100 -3 0 3 6 9 12 15 18 21
Outer bank Inner bank
B(cm)
Z
(c
m
)
0 10 20 30 40 50 60 70 80 90 100 -3 0 3 6 9 12 15 18
Outer bank Inner bank
B(cm)
Z
(c
m
)
0 10 20 30 40 50 60 70 80 90 100 -3 0 3 6 9 12 15 18
Outer bank Inner bank
(a)
(b)
SUMMER 2018, Vol 4, Issue 1, JOURNAL OF HYDRAULIC STRUCTURES Shahid Chamran University of Ahvaz
there is no trace of them at the levels beneath.
Figure 7. A view of the flow pattern at different longitudinal sections of the 180 degree bend, at a distance of a) 30, and b) 50% of the channel width from the inner bank. (PFV experiment on the
right, and PSV experiment on the left)
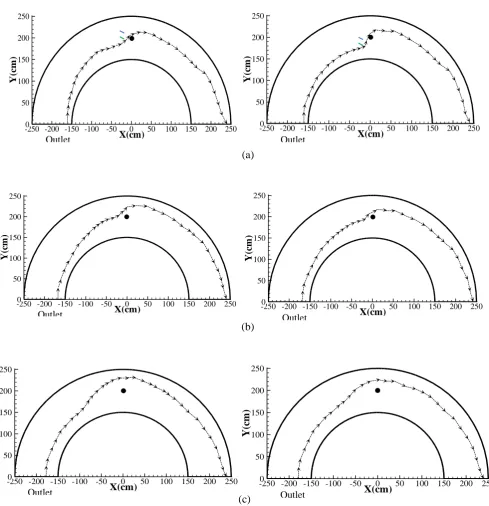
Figure (8) shows the path where the maximum velocity occurs at levels equal to 55.5% of the flow depth from the bed and 5% of the flow depth from water surface in PFV and PSV experiments. The maximum resultant velocity is obtained through the following relation:
𝑉
𝑅= √𝑉
𝑟2+ 𝑈
𝜃2+ 𝑊
𝑧2 (1)In the relation above, Vr, Uθ, and Wz respectively denote radial, tangential, and vertical
velocity components. The common feature of all the figures lies at the entrance of the bend, where the path to occurrence of the maximum resultant velocity is extended from the bend entrance towards the inner bank. This is due to the fact that due to entrance of the flow into the bend, and because of the pressure gradient resulting from the centripetal force, the maximum velocity occurs at the beginning sections towards the inner bank and accelerates water particles. This is so while it is accompanied by a positive longitudinal gradient at the outer bank, and the velocity of the fluid is reduced in this area. The maximum velocity lasts up to the 55 degree section, and then it is gradually inclined towards the outer wall. Near the bed in PFV experiment, the path to the maximum velocity falls at the 89 degree angle near the inner bank, and then it is inclined towards the outer bank afterwards.
Teta(deg)
Z
(c
m
)
0 20 40 60 80 100 120 140 160 180
-9 -6 -3 0 3 6 9 12 15 18
Outlet Inlet
Teta(deg)
Z
(c
m
)
0 20 40 60 80 100 120 140 160 180
-12-9
-6
-30
3 6 9 12 15 18
Outlet Inlet
Teta(deg)
Z
(c
m
)
0 20 40 60 80 100 120 140 160 180
-9 -6 -3 0 3 6 9 12 15 18
Outlet Inlet
Teta(deg)
Z
(c
m
)
0 20 40 60 80 100 120 140 160 180
-12-9
-6
-30
3 6 9 12 15 18
Outlet Inlet
(a)
SUMMER 2018, Vol 4, Issue 1, JOURNAL OF HYDRAULIC STRUCTURES Shahid Chamran University of Ahvaz
Figure 8. The path to formation of the maximum resultant velocity at the levels equal to a) 5, and b) 55% of the flow depth from the bed, and c) 5% of the flow depth from water surface (PFV
experiment on the right, and PSV experiment on the left) X(cm)
Y
(c
m
)
-250 -200 -150 -1000 -50 0 50 100 150 200 250
50 100 150 200 250
Outlet
X(cm)
Y
(c
m
)
-250 -200 -150 -1000 -50 0 50 100 150 200 250
50 100 150 200 250
Outlet Inlet
X(cm)
Y
(c
m
)
-250 -200 -150 -1000 -50 0 50 100 150 200 250
50 100 150 200 250
Outlet
X(cm)
Y
(c
m
)
-250 -200 -150 -1000 -50 0 50 100 150 200 250
50 100 150 200 250
Outlet X(cm)
Y
(c
m
)
-250 -200 -150 -1000 -50 0 50 100 150 200 250
50 100 150 200 250
Outlet
X(cm)
Y
(c
m
)
-250 -200 -150 -1000 -50 0 50 100 150 200 250 50
100 150 200 250
Outlet
(a)
(b)
SUMMER 2018, Vol 4, Issue 1, JOURNAL OF HYDRAULIC STRUCTURES Shahid Chamran University of Ahvaz
Figure 9. The diagram on velocity lines at levels equal to a) 5, and b) 55% of the flow depth at the beginning of the bend from the bed, and c) 5% of the flow depth at the beginning of the bend from
the flow surface. (PFV experiment on the right, and PSV experiment on the left) X(cm)
Y
(c
m
)
-250 -200 -150 -100 -500 0 50 100 150 200 250 50
100 150 200 250
Outlet Inlet
X(cm)
Y
(c
m
)
-250 -200 -150 -100 -50 0 50 100 150 200 250 0
50 100 150 200 250
Outlet Inlet
X(cm)
Y
(c
m
)
-250 -200 -150 -1000 -50 0 50 100 150 200 250 50
100 150 200 250
Outlet
Inlet
X(cm)
Y
(c
m
)
-250 -200 -150 -100 -50 0 50 100 150 200 250 0
50 100 150 200 250
Outlet Inlet
Sediment pile
X(cm)
Y
(c
m
)
-250 -200 -150 -100 -50 0 50 100 150 200 250 0
50 100 150 200 250
Outlet Inlet
Sediment pile
X(cm)
Y
(c
m
)
-250 -200 -150 -100 -500 0 50 100 150 200 250 50
100 150 200 250
Outlet Inlet
(a)
(b)
SUMMER 2018, Vol 4, Issue 1, JOURNAL OF HYDRAULIC STRUCTURES Shahid Chamran University of Ahvaz
Whereas, when the submerged vanes are placed at a distance of 60% of the channel width from the inner bank, the maximum velocity covers a smaller distance in the vicinity of the inner bank, so that it is inclined towards the outer bank at the 86 degree angle. In fact, by transporting the submerged vanes to the area near the outer bank, the streamlines fall at a distance equal to 2 times the pier diameter at the outer bank (Figure (8-a)). The maximum velocity at the level of 55% of the flow depth from the bed in PFV and PSV experiments respectively occurs up to approximately 84.5 and 78.5 degree sections from the beginning of the bend in the vicinity of the inner bank. At the downstream sections, it inclines towards the outer wall of the channel (Figure (8-b)). Approaching the water surface, the maximum velocity line follows a milder path than that at 5% of the flow depth from the bed. Also, at 5% of the flow depth from the bed, due to augmentation of the transverse flow strength, the maximum flow velocity inclines towards the outer bank to the end of the bend after crossing the central line of the bend. The resultant velocity path falls near the pier, so that it crosses a distance of 40% of the channel width from the inner bank in PFV, and 50% in PSV (Figure (8-c)). At all the three levels, and all the experiments, the maximum velocity lines occur at the end of the bend (the 180 degree angle) at a distance of 95% of the channel width from the inner bank. The streamlines are presented in Figure (9) at levels equal to 5 and 55% of the flow depth at the beginning of the bend from the bed, and 5% of the flow depth at the beginning of the bend from the flow surface in PFV and PSV experiments. As it is observed, the path streamlines take at a level equal to 5% of the flow depth from the bed is inclined towards the inner bank, so that the stream lines in the case of placing the submerged vanes at a distance of 60% of channel width from the inner bank incline further towards the inner bank. The streamlines incline towards the inner bank upon approaching the location of the vanes and bridge pier, and cause formation of the sediment pile at this area. Thus, the maximum sedimentation occurs at the 120 degree angle in PFV, and at the 130 degree angle in PFV experiments (Figure (9-a)). At the level equal to 55% of the flow depth from the bed, the inclination of the streamlines towards the inner bank is reduced, and, as is observed, the lines are almost parallel to the central line of the channel (Figure (9-b)). Approaching the flow surface, at a distance equal to 5% of flow depth from the water surface, the average deviation of the streamlines towards the outer bank is observed, the reason of which is the centrifugal force overcoming the other forces on the surface of the flow. And since the mentioned vanes are submerged, there is no obstacle against the flow at the water surface, the upstream flows do not overcome the mainstream, no vortex is formed on water surface, and little difference is observed in streamlines between two installation cases of the submerged vanes (Figure (9-c)).
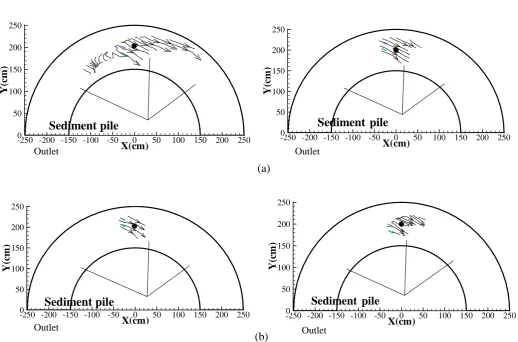
The streamlines at levels equal to 20 and 30% of the flow depth at the beginning of the bend, lower than the base level, are presented in Figure (10). In this figure, due to presence of sediments around the scour hole at all points, no streamlines exist (white areas of levels higher than those of 20 and 30% of the flow depth at the beginning of the bend are lower than the bed). Little return flow is observed at the downstream side of the pier, and the flow is directed towards the inner bank. This is due to deviation of the flow because of submerged vanes, the pier, and the flow present at the bend. The same flow pushes the sediments out of the scour hole towards the inner bank.
SUMMER 2018, Vol 4, Issue 1, JOURNAL OF HYDRAULIC STRUCTURES Shahid Chamran University of Ahvaz
Figure 10. The diagram on streamlines at levels equal to a) 20, and b) 30% of the flow depth at the beginning of the bend, lower than the bed. (PFV experiment on the right, and PSV experiment on
the left)
Figure (11) presents the tangential velocity contour at plan sections at the level of 5 and 95% of the flow depth at the beginning of the bend from the bed. As in Figure (11-a), the maximum positive tangential velocity in PFV experiment occurs at a distance of 85% and the position of 28 times the pier diameter in the direction of the downstream area of the pier location. Also, in PFV experiment, it occurs at a distance of 58% of the channel width from the inner bank and the position of 3 times the pier diameter in the direction of the downstream area of the pier location. Further, the maximum negative tangential velocities occur at distances of 6 and 20% of the channel width respectively, and the maximum positive tangential velocity in PFV experiment is 8.5% higher than that in PSV experiment. It is observed at the beginning of the bend that the maximum tangential velocity occurs in the vicinity of the inner bank at the water surface, the fact which is due to augmentation of pressure gradient near the inner bank. In general, the maximum tangential velocity distances away from the inner bank, and due to section constriction and higher longitudinal pressure gradient at the surface, the maximum tangential velocity is generated around the pier. Also, by distancing away from the pier in downstream direction, the maximum tangential velocity at the second half of the bend is created near the inner and outer banks. It can be observed that with increase in the distance between the submerged vanes and the
X(cm)
Y
(c
m
)
-250 -200 -150 -1000 -50 0 50 100 150 200 250
50 100 150 200 250
Outlet Inlet
Sediment pile
X(cm)
Y
(c
m
)
-250 -200 -150 -1000 -50 0 50 100 150 200 250
50 100 150 200 250
Outlet Inlet
Sediment pile
X(cm)
Y
(c
m
)
-250 -200 -150 -1000 -50 0 50 100 150 200 250
50 100 150 200 250
Outlet Inlet
Sediment pile
X(cm)
Y
(c
m
)
-250 -200 -150 -100 -50 0 50 100 150 200 250
0 50 100 150 200 250
Outlet Inlet
Sediment pile
(a)
SUMMER 2018, Vol 4, Issue 1, JOURNAL OF HYDRAULIC STRUCTURES Shahid Chamran University of Ahvaz
inner bank at this section, the maximum positive tangential velocity increases by 14% (Figure (11-b)).
Figure 11. Tangential velocity contours (uϴ) in cm/s at levels equal to a) 5% of the flow depth at the beginning of the bend from the bed, and b) 5% of the flow depth at the beginning of the bend from
the water surface (PFV experiment on the right, and PSV experiment on the left)
The radial velocity contour at plan sections at levels of 5 and 95% of the flow depth at the beginning of the bend from the bed is presented in Figure (12). According to Figure (12), at the plan sections, the negative values of the radial velocity (towards the inner bank) can be noted. Creation of obstacles on the path of the flow generates negative pressure gradient at the downstream area of the obstacle. Due to employment of submerged vanes at the upstream area of the pier located at the vane perpendicular to the flow, the fluid particles enter the zone of negative pressure gradient after collision with submerged vanes. After collision with the bridge pier, a change is observed in the process of water particle movement. In other words, a high pressure zone is created at the upstream area of submerged vanes. This leads to interference of high pressure and low pressure zones on the sides of submerged vanes, the result of which is sediment transport from the bed towards the hole around the pier and the downstream area. By increasing the distance between the submerged vanes and the inner bank, the maximum positive radial velocity at this level reduces by 7%, and the maximum negative radial velocity increases by 52%. It can be observed that in PFV experiment, the maximum positive radial velocity
X(cm)
Y
(c
m
)
-250 -200 -150 -1000 -50 0 50 100 150 200 250
50 100 150 200 250
U (cm/s): -4 0ϴ 4 8 12 16 20 24 28 32 36 40 44
X(cm)
Y
(c
m
)
-250 -200 -150 -1000 -50 0 50 100 150 200 250
50 100 150 200 250
U (cm/s): -7 -3 1ϴ 5 9 13 17 21 25 29 33 37 41 45 49
X(cm)
Y
(c
m
)
-250 -200 -150 -1000 -50 0 50 100 150 200 250
50 100 150 200 250
U (cm/s): -10 -5 0 5 10 15 20 25 30 35 40 45 50
ϴ
X(cm)
Y
(c
m
)
-250 -200 -150 -1000 -50 0 50 100 150 200 250
50 100 150 200 250
U (cm/s): 0 4 8 12 16 20 24 28 32 36 40 44 48 52 56
ϴ
(a)
SUMMER 2018, Vol 4, Issue 1, JOURNAL OF HYDRAULIC STRUCTURES Shahid Chamran University of Ahvaz
(towards the outer bank) occurs at the level of 5% of the flow depth from the bed at a distance of 46% of the channel width from the inner bank, and a distance equal to 4 times the pier diameter in upstream direction. Whereas in PSV experiment, it occurs at a distance of 16% of the channel width from the inner bank at a position equal to 2 times the pier diameter in downstream direction (Figure (12-a)). As is observed in Figure (12-b), in every position of the submerged vanes at the upstream area of the pier, the flow is negative near the walls of the channel. In PSV experiment, the maximum positive radial velocity (towards the outer bank) occurs at a distance of 30% of the channel width from the inner bank, at a position equal to 41 times the pier diameter in upstream direction from the pier location.
Figure 12. Radial velocity contour (vr) in cm/s at levels equal to a) 5% of the flow depth at the beginning of the bend from the bed, and b) 5% of the flow depth at the beginning of the bend from
the surface (PFV experiment on the right, and PSV experiment on the left)
Figure (13) depicts an instance of vertical velocity contours in plan sections at the level near the bed and the level of 55% of the depth from the bed. As in Figure (13), before collision of the flow with the vanes and the pier, the vertical velocities are small, but at the upstream area of the pier, the vertical flow is negative, which creates a down flow leading to formation of vortices. The maximum positive (towards the water surface) and negative (towards the bed) vertical velocities at the level of 5% of the flow depth at the beginning of the bend from the bed occurs at distances of 30 and 50% of the channel width from the inner bank in PFV experiment, and 36
X(cm)
Y
(c
m
)
-250 -200 -150 -1000 -50 0 50 100 150 200 250
50 100 150 200 250
Vr(cm/s): -9 -7 -5 -3 -1 1 3 5 7 9
X(cm)
Y
(c
m
)
-250 -200 -150 -100 -50 0 50 100 150 200 250
0 50 100 150 200 250
Vr(cm/s): -6 -4 -2 0 2 4 6 8 10
X(cm)
Y
(c
m
)
-250 -200 -150 -100 -50 0 50 100 150 200 250
0 50 100 150 200 250
Vr(cm/s): -35 -30 -25 -20 -15 -10 -5 0 5 10 15 20 25
X(cm)
Y
(c
m
)
-250 -200 -150 -100 -50 0 50 100 150 200 250
0 50 100 150 200 250
Vr(cm/s): -23 -18 -13 -8 -3 2 7 12 17 22 27
(a)
SUMMER 2018, Vol 4, Issue 1, JOURNAL OF HYDRAULIC STRUCTURES Shahid Chamran University of Ahvaz
and 66% of the channel width from the inner bank in PSV experiment, respectively. It can be concluded that by increasing the distance between the submerged vanes and the inner bank, the range of vertical velocities at the level of 5% of the flow depth from the bed and near the bridge pier is reduced, and the area under the influence of velocity variation is further restricted (Figure (13-a)). Whereas, at the level of 55% of the flow depth at the beginning of the bend, such values occur respectively at distances of 25 and 95%, equal to 4 and -4 cm/s in PFV experiment, and at distances of 15 and 50% of the channel width from the inner bank, equal to 3.95 and -2.53 cm/s in PSV experiment (Figure (13-b)).
Figure 13. vertical velocity contour (WZ) in cm/s at levels equal to a) 5, and b) 55% of the flow depth at the beginning of the bend from the bed (PFV experiment on the right, and PSV experiment
on the left)
4. Conclusions
In PFV experiment, the vortices are present as far as 10 times the pier diameter in downstream direction, and the changes created by the presence of submerged vanes fade upon reaching this section; while, in PSV experiment, they occur to the end of the turbulence bend. Approaching the location of submerged vanes, the streamlines incline towards the inner bank and create a sediment pile in this area, so that the maximum sedimentation occur at the 120 degree angle in PFV experiment, and at the 130 degree angle in PFV experiment. The maximum velocity at the level of 5% of the flow depth from the bed in PFV experiment occur from the proximity of the inner wall down to approximately 89 degree sections from the beginning of the
X(cm)
Y
(c
m
)
-250 -200 -150 -1000 -50 0 50 100 150 200 250
50 100 150 200 250
wz(cm/s): -4 -3 -2 -1 0 1 2 3 4
X(cm)
Y
(c
m
)
-250 -200 -150 -1000 -50 0 50 100 150 200 250
50 100 150 200 250
wz(cm/s): -9 -7 -5 -3 -1 1 3 5 7 9 11
X(cm)
Y
(c
m
)
-250 -200 -150 -100 -50 0 50 100 150 200 250
0 50 100 150 200 250
Wz(cm/s): -3 -2 -1 0 1 2 3 4
X(cm)
Y
(c
m
)
-250 -200 -150 -1000 -50 0 50 100 150 200 250
50 100 150 200 250
Wz(cm/s): -8 -7 -6 -5 -4 -3 -2 -1 0 1 2 3 4 5
(a)
SUMMER 2018, Vol 4, Issue 1, JOURNAL OF HYDRAULIC STRUCTURES Shahid Chamran University of Ahvaz
bend, and then inclines towards the outer wall of the channel at the downstream sections of the bend. The maximum velocity at the level of 5% of the flow depth from the bed in PSV experiment occurs from the vicinity of the inner wall down to approximately 86 degree sections from the beginning of the bend, and then inclines towards the outer wall of the channel at the downstream sections of the bend.
The maximum positive tangential velocity at the level of 5% of the flow depth at the beginning of the bend above the base level in PFV experiment is 8.5% higher than that in PFV experiment. In PFV experiment, it occurs at a distance of 85% and the position of 28 times the pier diameter in downstream direction from the location of the pier; whereas, in PFV experiment, it occurs at a distance of 58% of the channel width from the inner bank and the position of 3 times the pier diameter in downstream direction from the location of the pier.
By changing the position of the submerged vanes in channel width from the distance of 40% of the channel width to the distance of 60% from the inner bank, positive and negative radial velocities at the level of 10% of flow depth, lower than the bed, respectively increase by 33 and decrease by 92%.
In PFV experiment, the maximum vertical velocity occurs at a distance of 26% of the channel width from the inner bank and at a level of 20% of the flow depth at the beginning of the bend, lower than the base level. In PSV experiment, the maximum vertical velocity occurs at a distance of 50% of the channel width from the inner bank and at a level of 20% of the flow depth at the beginning of the bend, lower than the base level.
5. List of symbols
Channel width (cm) =
B
Central Radius of the Bend(cm) =
R
Angles from the beginning to the end of the bend(deg) =
Teta
The Average Diameter of Sediment Particels(mm) =
d50
Flow Velocity(cm/s) =
U
Flow Velocity Under Incipient Motion Conditions(cm/s) =
UC
Upstream Flow Depth(cm) =
y
Pier Diameter(cm) =
D
Length of Submerged Vanes(cm) =
𝐿𝑣
Thickness of Submerged Vanes(cm) =
𝑡𝑣
Horizontal Angle of Submerge Vanes(deg) =
𝛼
Height of Vanes on the Bed at the initiation of the scour experiment(cm) =
𝐿𝑠
distance from the bed (cm) =
z
Distance of submerged vanes from the inner bank (cm) =
Lvb
Tangential velocity(cm/s) =
𝑈𝜃
Radial velocity(cm/s) =
𝑉𝑟
Vertical velocity (cm/s) =
𝑊𝑧
The maximum resultant velocity(cm/s) =
SUMMER 2018, Vol 4, Issue 1, JOURNAL OF HYDRAULIC STRUCTURES Shahid Chamran University of Ahvaz
Reference
1. Ye, J. and McCorquodale, J. A. (1998). "Simulation of curved open channel flows by 3D hydrodynamic model" Journal of Hydraulic Engineering, 124(7), 687-698.
2. Marelius, F. and Sinha, S.K. (1998). "Experimental Investigation of Flow past Submerged Vanes Journal of Hydraulic Engineering 124(5). 542 – 545.
3. Johnson, P.A., Hey R.D., Tessier, M. and Rosgen DL. (2001). "Use of vanes for control of scour at vertical wall abutments Journal of Hydraulic Engineering. ASCE 127(9), 772-778. 4. Blanckaert, K. and Graf, W. H. (2001). Mean flow and turbulence in open-channel
bend Journal of Hydraulic Engineering, 127(10), 835-847.
5. Soon-Keat, T., Guoliang, Y.u., Siow-Yong, L. and Muk-Chen, O. (2005). "Flow structure and sediment motion around submerged vanes in open channel" Journal of waterway, port, coastal, and ocean engineering, 131(3), 132-136.
6. Rodríguez, J. F. and M. H. García. (2008). "Laboratory measurements of 3-D flow patterns and turbulence in straight open channel with rough bed Journal of Hydraulic Research, 46(4), 454-465.
7. Belcher, B. J. and J. F. Fox. (2009). "Laboratory measurements of 3-D flow patterns and turbulence in straight open channel with rough bed" Journal of Hydraulic Research, 47(5), 685-688.
8. Naji Abhari, M., Ghodsian, M., Vaghefi, M. and Panahpur, N. (2010). "Experimental and numerical simulation of flow in a 90 degree bend" Flow Measurment and Instrumentation, 21(3), 292-298.
9. Kumar, U. C., Kothyari, K, G. and Ranga, R. (2012) "Flow structure and scour around circular componend bride piers - A review" Journal of Hydro-enviroment Research, 6(4), 261-265.
10.Ataie-Ashtiani, B. and Aslani-Kordkandi, A. (2012). "Flow field around side-by-side piers with and without a scour hole" European Journal of Mechanincs B/Fluids, 36, 152-166. 11.Das, S., Das, R. and Mazumdar, A. (2013). "Circuation characteristics of horseshoe vortex in
scour region around circular piers" Water Science and Engineering, 6(1), 69-77.
12.Tang, X. and Knight, D.W. (2014). "The lateral distribution of depth-averaged velocity in a channel flow bend" Journal of Hydro-environment Research, 10, 1-10.
13. Vaghefi, M., Akbari, M. and Fiouz, A.R. (2015). "Experimental Study of Turbulence Kinetic Energy and Velocity Fluctuation Distributions in a 180 Degree Sharp Bend", 10th International Congress on Civil Engineering, University of Tabriz, Tabriz, Iran.
14. Vaghefi, M., Akbari, M. and Fiouz, A. (2016). "An experimental study of mean and turbulent flow in a 180 degree sharp open channel bend: Secondary flow and bed shear stress" KSCE Journal of Civil Engineering, 20(4), 1582-1593.
15. Haji Azizi, S., Davood, F., Hadi, A. and Akram A. (2016) "Numerical Simulation of Flow Pattern around the Bridge Pier with Submerged Vanes" Journal of Hydraulic Structures, 2(2), 46-61.
16. Ben Mohammad Khajeh, SH., Vaghefi, M. and Mahmoudi, A. (2017). "The scour pattern around an inclined cylindrical pier in a sharp 180-degree bend: an experimental study" International Journal of River Basin Management, 15(2), 207-218.
SUMMER 2018, Vol 4, Issue 1, JOURNAL OF HYDRAULIC STRUCTURES Shahid Chamran University of Ahvaz