IJMGE
Int. J. Min. & Geo-Eng.
Vol.50, No.1, June 2016, pp.61-76.
The reclamation of mica flakes from tailing disposal using gravity
separators and flotation
Mohammad Raouf Hosseini
1*ahrami
2and Mostafa Hosseinzadeh
3,41. Department of Mining Engineering, Isfahan University of Technology, Isfahan 84156-83111, Iran
2. Department of Mining Engineering, Engineering Faculty, Urmia University, Urmia, Iran
3. Department of Mining Engineering, Engineering Faculty, Shahid Bahonar University, Kerman, Iran
4. Materials and Energy Research Center (MERC), Karaj, Iran
Received 2 Nov. 2015; Received in revised form 9 Apr. 2016; Accepted 11 Apr. 2016
*Corresponding author Email: [email protected], Tel: +983133915171, Fax: +983133912776
Abstract
A sample from the small-sized tailing pile of an Iranian mica processing plant was subjected to a series of mica recovery experiments. Mineralogical and microscopic investigations indicated that the dominant mica mineral was phlogopite which was accompanied by plagioclase feldspars. Before beneficiation studies, the particle size distribution of the representative sample was obtained, and the specifications of each size fraction were investigated in detail. It was observed that the largest portion of mica (31%) is accumulated in the size range of 0.3 to 2.0 mm. Afterward, gravity concentration and flotation experiments were carried out. Results proved that shaking table could produce a mica concentrate with grade of 74%. Also, according to the flotation tests, it seemed the best size fraction was -150+75, and after that, -100+150. Flotation in combination with attrition scrubbing produced a concentrate with 92% mica content and 70% recovery. Finally, with respect to the results of all implemented experiments, a processing flow sheet was proposed for mica reclamation from the mentioned waste disposal.
Keywords:flotation, gravity separators, mica flakes, reclamation, tailing disposal.
1. Introduction
Mica minerals are common layer silicates that present in soils, sediments, and a lot of ore deposits and metamorphic rocks. They are crystallized in a monoclinic system with a pseudo-hexagonal tendency, and are similar in chemical composition [1-3]. In soils, mica
creates a longstanding resource of potassium and magnesium which may be mobilized by solubilization as a result of weathering [4-6]. Micas differ greatly in their susceptibility to natural weathering processes [7, 8].
minerals can be found in various types of ore bodies that contain lithium, base metal ore, and other oxide ores. In these conditions, mica should be removed before flotation of either lithium or other oxide minerals. Main mica minerals are muscovite, lepidolite, phlogopite, biotite, and lepidomelane which among them, the first three ones are the most important commercial minerals for the production of mica. Mica exists in pegmatite ore bodies that, in most cases, contain either lithium or rare earth oxides. Biotite as a major mica mineral is rich in iron and magnesium and presents in a number of major polymetallic deposits of igneous origin [8].
Mica is produced in the forms of sheets and flakes that each is used to manufacture different end products. Sheet mica is extracted by some basic mechanical equipment and prepared by hand picking that recovers the maximum area of usable crystals [1, 9]. However, mica flakes may be obtained either from mica mines or generated as a by-product of clay, quartz, and feldspar production. Also, cut pieces or scraps of sheet mica are another source of flake mica [1]. The consumption of sheet mica is considerably decreasing because of substitution by other synthetic polymers with identical properties, and miniaturization in electronics. In contrast, the use of flake mica is on the increase in electronic, building, pigment, and plastic industries [9, 10].
Beneficiation of mica includes both physical separation and flotation. Coarse mica may be concentrated by the both techniques, but the former is economically more efficient, and involves Humphrey spirals [11, 12], shaking tables [13, 14] and screens [15-17]. Other concentration methods like air or hydraulic separation have been also employed by some researchers [14, 18].
Nevertheless, the main concern here is the removal of the fines from the ground feed, before reporting them into any of these concentration stages. Physical processes are classically designed for separating clean coarse particles, as most of contaminants are concentrated within the fine fractions [19-21]. The reason is that the surface area available for contaminants to attach is higher in these size fractions. However, recent studies [22, 23] demonstrated that distribution of valuable minerals displays no specific enrichment from
one fraction to another. Consequently, simple sieving or using hydrocyclones are proved to be unsuitable for removing fine contaminants, and it is proposed to apply the attrition technique for cleaning the ore particles [24]. Attrition scrubbing is the physical impact and shearing action between contaminated particles themselves and either the liquid phase or the walls and agitators in a mixing vessel [25]. This may be performed by using hydrocyclones in the processing circuit, after grinding or attrition scrubbing. Scrubbing serves multiple purposes, like removing surface stains and dispersing any clays or slimes that may present [1, 26].
Mica flotation is carried out in both acidic and basic systems using cationic and anionic collectors [1, 16, 27, 28]. The above mentioned techniques involve an initial crushing stage which is followed by grinding using a rod mill in open circuit. The product size is determined with respect to the downstream concentration method. Although, +425 μm size fraction is reported as an effective size for gravity separation [16], the size range of -850+75 μm has also been used [1]. Concerning flotation as well, a wide size portion is applicable from 425 to 100 μm [16] or from 850 to 75 μm [1].
Many of investigators have made no mention of mineral types that were used in their studies, so it appears that the flotation properties of various mica minerals are similar [8]. Extensive research work was carried out by a number of researchers [2, 3, 29, 30] to study the separation process of mica from other silicate minerals using either anionic or cationic collectors or a mixture of the both [31] in the presence of gangue depressants, which can be aluminum sulfate, sodium silicate, and other organic depressants [8]. When applying cationic collectors, either lead nitrate or alkaline earth salts may be used as activators; while, iron and aluminum salts have a depressing effect on mica minerals [9, 16].
with other gangue minerals as the plant cannot recover them from the feed. This study exploits screening, flotation, and gravity separation methods to reclaim the discarded mica particles, and lastly proposes a continuous processing circuit.
2. Materials and Methods 2.1. Mineral sample
The sample used in this study, was obtained from the waste dump of Azartalgh mica processing plant located in West Azerbaijan province of Iran, with the size of about 97% finer than 2 mm.
2.2. Characterization of the sample
Mineralogical analysis of the sample was performed using X-ray diffraction (XRD) Philips X’Pert PRO equipped with a copper tube. (λ for Cu K-alpha radiation was 1.54 A˚), and a gas detector in the atmosphere. The current and voltage were 30 mA and 40 kV, respectively; and the radiation angle (2θ) was set between 4 to 60 degrees. Also, chemical composition was determined using X-ray fluorescence (XRF) Philips MagiX PRO equipped with rhodium tube and LiF 200 crystals in vacuum.
To determine the particle size distribution of the sample, wet screening was carried out using a series of 2000, 1000, 300, 150, and 75 μm sieves. In order to obtain the grade of mica in each size fraction, the mica particles were counted under a binocular microscope, and the ratio of mica particle number to total number of mica and gangue particles was reported. In order to check the accuracy of this method, mica and gangue particles of some samples separated by hand under microscope, counted, weighted and the ratio of mica to total particles was calculated and compared with the estimated grade. This comparison indicated that the estimated grades matched with measured ones, very well. In addition,
complementary mineralogical investigations on mica and gangue contents along with the determination of liberation degree for each size fraction were done by studying the sample particles under a binocular, and thin sections under a polarized microscope.
2.3. Mica concentration studies
Concentration studies were performed in two phases. In the first phase, different concentration approaches including gravity, high gradient magnetic and electrostatic separation, and also flotation were tested and assessed. However, as the quantity of magnetic minerals in the gangue portion is very low (refer to part 3.1), and the sample contains biotite which has paramagnetic properties [32] the magnetic separator could not differentiate well between mica and gangue minerals. Also, since the dominant mica mineral in the feed was phlogopite and the dielectric properties (loss tangent) of this mineral is close to albite and plagioclase [33], the electrostatic separation was as unsuccessful. Electrostatic separation is more effective for muscovite as its loss tangent is much lower than that of the mentioned gangue minerals [33]. So, because of the weak performance of magnetic and electrostatic methods, their results are not reported. In the second phase, the successful methods were selected, modified and applied in combination with each other.
For shaking table (Denver®, 102×46×35 cm with a Fritch® vibrating feeder) and jig (Denver®, 5×5 cm with 0.7 cm diameter balls) experiments, the ore sample was divided into three major size fractions, including -2400+1000, -1000+150, and -150+75 μm. The experimental conditions of shaking table tests are summarized in Table 1. Moreover, for the jig machine, 854 g of the coarsest fraction (-2400+1000 μm) was applied setting the amplitude, and flowrate on 200 min-1, and 2.2 L/min, respectively.
Table 1. Experimental conditions used for shaking table concentrator*
Run Size fraction Mica % Table slope Feed water flowrate L/min
Wash water flowrate L/min
1 -2400+1000 22 16 6 10
2 -1000+150 17 6 10 10
3 -150+75 11 5 9 8
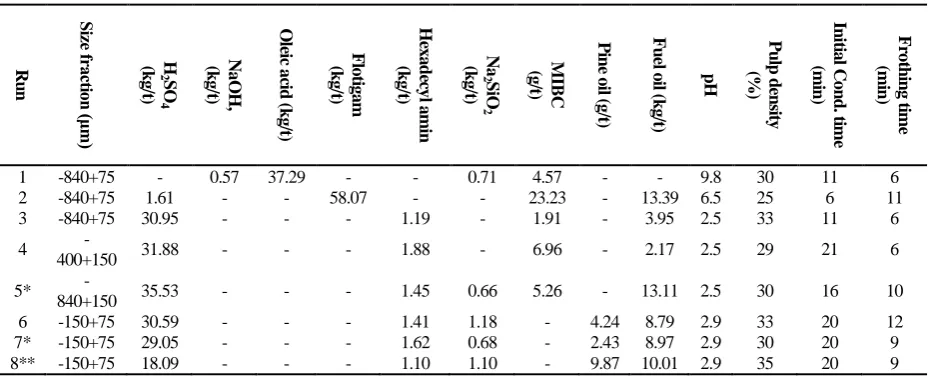
Furthermore, flotation tests were carried out by a Denver® flotation machine, model: SUB-A (D-12), employing four different size ranges including -840+75 μm fraction with 15% mica, -400+150 μm, and -840+150 μm fractions with 18% mica, and +75-150 μm fraction with 11% mica content (Table 2). Flotation experiments no. 5 and 7 were carried out after performing a 30-minute attrition scrubbing on the feed using 70% wt. slurry density. The same procedure was also applied to experiment no. 7 using an acidic medium (5% Sulfuric acid) instead of water.
The best conditions of the flotation tests are listed in Table 2. Mica flotation was carried out using various collectors in different pH. Oleic acid and Flotinor FS-2 as fatty acid anionic collectors, and relatively short chain amine cationic collectors like Flotigam EDA and hexadecylamin, and long chain Armac-T were used in acidic or alkali medium [8]. However, applying oleic acid in acidic medium did not lead to any promising result. Oleic acid normally should be used in pH range of 7.5-9 that indicates that its adsorption on the mineral surface is the result of a chemical interaction. Also, experiments in which, Armac-T and FS-2 were used were as unsuccessful (data are not shown), probably because the former is a long chain collector (about 90% of its aliphatic alkyl group is C16 and C18), and the latter could not
electrostatically adsorb to the mica particles in the applied low pH range [34].
In the second phase, a sample of 7100 g in the size range of -2000 +150 μm with 18% mica content was applied to prepare a pulp with 12% wt. solid which was then introduced to a Humphrey spiral separator (Denver®, capacity of 1.2-3.4 t/h) with a flowrate of 22 L/min. Afterward, the middling of the spiral was introduced to shaking table for more concentration. The table slope, feed water, wash water, and dry feed flowrate were set to 16˚, 7 L/min, 9 L/min, and 208 g/min, respectively. Again, the middling of this table was introduced to another shaking table with feed water of 8.5 L/min, and dry feed flowrate of 166 g/min. Other parameters remained unchanged.
3. Results and Discussion
3.1. Mineralogical and chemical properties of the head sample
Mineralogical studies on XRD result (Fig. 1) indicated that phlogopite (Phl): KMg3(Si3Al) O10 (OH)2, albite (Ab): (Na,Ca) (Si,Al)4 O8, augite (Aug): Ca (Fe,Mg) Si2O6, and calcite (Cal): CaCO3 were the major phases of the sample; while, chlorite (Chl): (Mg,Fe)6(Si,Al)4O10(OH)8, quartz
(Qtz): SiO2, and magnetite (Mag): FeFe2O4 were the minor phases.
Table 2. Specifications of the flotation tests
R u n Siz e f ra cti on (μ m ) H 2SO 4 (k g /t) N a O H , (k g /t) O le ic a ci d (k g /t) F lo tig a m (k g /t) H ex a d ec y l a m in (k g /t) Na 2S iO 2 (k g /t) M IB C (g /t) P in e o il (g /t) F u el o il (k g /t) pH P u lp d en sit y (%) In iti a l C o n d . t im e (m in ) F ro th in g ti m e (m in )
1 -840+75 - 0.57 37.29 - - 0.71 4.57 - - 9.8 30 11 6 2 -840+75 1.61 - - 58.07 - - 23.23 - 13.39 6.5 25 6 11 3 -840+75 30.95 - - - 1.19 - 1.91 - 3.95 2.5 33 11 6
4
-400+150 31.88 - - - 1.88 - 6.96 - 2.17 2.5 29 21 6 5*
-840+150 35.53 - - - 1.45 0.66 5.26 - 13.11 2.5 30 16 10 6 -150+75 30.59 - - - 1.41 1.18 - 4.24 8.79 2.9 33 20 12 7* -150+75 29.05 - - - 1.62 0.68 - 2.43 8.97 2.9 30 20 9 8** -150+75 18.09 - - - 1.10 1.10 - 9.87 10.01 2.9 35 20 9 *Tests were performed after attrition scrubbing.
Chemical analysis by XRF (Table 3) showed that the amount of K2O and P2O5 in the sample were 4.42 and 0.17 %, respectively. As phlogopite has potassium (K) in its structure, and apatite (Ca5(PO4)3(F,Cl,OH)) is one of the gangue minerals in Gharabagh deposit, the quantity of K2O and P2O5 is used as a rough indication of the presence of valuable and gangue minerals in the feed sample. However, because of the presence of some potassium bearing gangues which are not detected in the XRD analysis, the amount of K2O cannot be used to exactly measure the mica grade, exactly. For example, Table 3 suggests that the K2O content of the head sample is about 4.42% which implies the presence of 42.7% mica. Also, Table 5 suggests that mica in some size fractions may be more than 50%. But, knowing that the average grade of plant feed does not exceed 20%, and considering the plant reports, microscopic studies, and the previous work performed on this deposit by Raeisi and Amini
(1990) [35], it seems impossible that mica grade of the plant waste be in these orders.
Therefore, regarding the presence of chlorite and calcite in the sample as an indication of alteration, it can be concluded that these undetectable potassium containing minerals are generated as a result of plagioclase (albite) alteration into sericite which is fine grained mica, similar to muscovite, illite, or paragonite. Sericite is created by substitution of potassium for sodium in the alteration process.
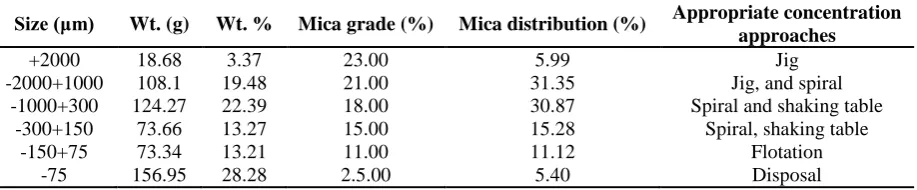
3.2. Sieve analysis of the head sample Regarding Table 4, 3.4% of the sample is coarser than 2 mm which would be considered as a good source of flake mica. It can be further purified by low cost gravitational and air flow separators or returned back to the plant feed. In addition, 28.2% of the sample is below 75 µm and mostly contains clay and slimes; so, its processing is not feasible technologically and economically.
Fig. 1. X-ray diffraction graph of the head sample
Table 3. Chemical analysis of the head sample
Component SiO2 Al2O3 Fe2O3 CaO Na2O K2O MgO TiO2 MnO P2O5
Amount (%) 49.80 11.70 5.22 10.73 0.96 4.42 12.66 0.59 0.11 0.17
Component S L.O.I Cl Ba Sr Cu Zn Pb Ni Cr
(%) (%) )g/t) )g/t) )g/t) )g/t) )g/t) )g/t) )g/t) )g/t)
Amount 0.08 3.09 34 1608 192 64 55 9 27 33
Table 4. Particle size distribution of the head sample
Size (μm) Wt. (g) Wt. % Mica grade (%) Mica distribution (%) Appropriate concentration approaches
+2000 18.68 3.37 23.00 5.99 Jig
-2000+1000 108.1 19.48 21.00 31.35 Jig, and spiral
-1000+300 124.27 22.39 18.00 30.87 Spiral and shaking table
-300+150 73.66 13.27 15.00 15.28 Spiral, shaking table
-150+75 73.34 13.21 11.00 11.12 Flotation
As a result, the concentration process was focused on the remained 70 percent of the sample with a particle size between 2000 and 75 µm. Also, comparing the mica and sample weight distribution in each size fraction in Table 4, it can be deduced that if the weight of -75 µm fraction is ignored, most of the sample weight accumulates in the -1000+300 and - 2000+1000 µm fractions (22.4, and 19.5%, respectively) which the latter contains more mica (31.35%) than the former (30.87%). Microscopic pictures of these size fractions are shown in Figure 2. The other outcome which is derived from Table 4, is that the smaller is the sample size, the lesser is the
mica grade. This is because of the presence of clay minerals in the fine portion of the sample.
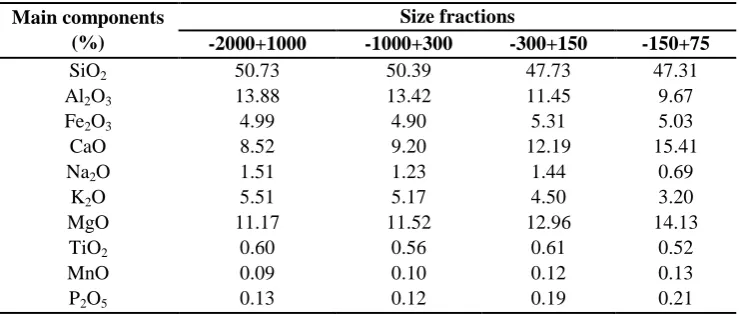
3.3. Microscopic and chemical studies on each size fractions
Considering the main element oxides in each size fraction of the feed sample measured by XRF analysis and listed in Table 5, it can be seen that the amount of K2O in the coarsest fraction is 5.51% which reduces to 3.2% in the finest one. On the contrary, P2O5 content of fractions increased from 0.13% in the first fraction to 0.21% in the last one. So, it is concluded that the finer the particles, the higher the gangue, and the lower the valuable minerals.
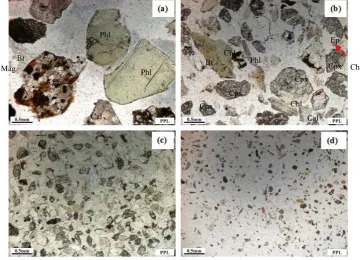
Fig. 2. Microscopic images of some size fractions in different magnifications: (a) -2+1 mm, 8X (b) -1000+150 μm, 10X (c) -150+75 μm, 16X
Fig. 3. Polarized microscope images of thin sections of each size fractions. (a) 2000+1000 μm (b) 1000+300 μm (c) -300+150 μm (d) -150+75; Bt (biotite), Cal (calcite), Chl (chlorite), Cpx (clinopyroxene), Ep (epidote), Mag
(magnetite), Phl (phlogopite)
Phl Phl
Bt Phl
Cal Mag
Cpx Cpx Chl Bt
Cpx
Chl Cal
Ep
Chl Cpx
Therefore, considering microscopic and XRF analyses, the mica contents of the finest fraction with the size of less than 75 µm is very low and its processing is not economically feasible.
Microscopic images of thin sections derived from each size fractions are depicted in Figure 3. In the size range of -2000+1000 μm (Fig. 3a), the sample is composed of several mineral pieces with different compositions. The mica grade is estimated as 15% in the forms of large phlogopite flakes with 80% liberation degree. Also, fine biotite blades which are less than 5% and mostly seen as inclusions in acidic to intermediate igneous rocks. Other minerals are pyroxene, calcite, feldspar, quartz, spinel, opaque, and pieces of granodiorite, epidote, and apatite. In the next -1000+300 μm fraction (Fig. 3b), like the former one, a great portion (around 85%) of the large flake mica is liberated while the fine type presents as minor mineral in the form of inclusion in granodiorite rocks.
Also, calcite and pyroxene are the most abundant gangue minerals, and feldspar, quarts, epidote, apatite, and spinel are the others in lower quantities. Concerning the type and liberation degree of phlogopite in this fraction, reaching to a high mica grade is expected by using appropriate mineral processing devices though a good recovery does not seem practical. The constituents of -300+150 μm fraction (Fig. 3c) are the same as the previous one with phlogopite and
pyroxene as the main valuable and gangue minerals, respectively. The mica content in this fraction is 12-15% and the liberation degree of phlogopite is around 85%. Regarding the last fraction (-150+75 μm) illustrated in Figure 3d, mica grade is about 12-15% with the liberation degree of around 90%. Also, the valuable and gangue minerals are same as the other fractions.
3.4. Gravity separation
The density of mica and feldspar are close to each other [36]; so, efficient separation of these minerals by gravity methods seems to be difficault. However, in fine sizes, the flaky shape of the mica mineral which is pliable, resilient and tough, makes it possible to separate it from gangues using gravity methods [37, 38]. Iverson (1932) [38], and Adair et al. (1951) [39] who used shaking table and Humphrey spiral, respectively were the pioneers of this idea.
Results of all three shaking table experiments are shown in Table 6. As it can be seen in the first row (Run 1), 20% of sample (-2400+1000 μm) went to the concentrate in the rougher stage. This concentrate contains 49.67% mica that constitutes 45.15% of the total mica in the feed. In the cleaner stage, a concentrate with 74.9% mica content was obtained. The total recovery of the process including rougher and cleaner is near 34%.
Table 5. Chemical Analysis of Size Fractions in representative sample
Main components (%)
Size fractions
-2000+1000 -1000+300 -300+150 -150+75
SiO2 50.73 50.39 47.73 47.31
Al2O3 13.88 13.42 11.45 9.67
Fe2O3 4.99 4.90 5.31 5.03
CaO 8.52 9.20 12.19 15.41
Na2O 1.51 1.23 1.44 0.69
K2O 5.51 5.17 4.50 3.20
MgO 11.17 11.52 12.96 14.13
TiO2 0.60 0.56 0.61 0.52
MnO 0.09 0.10 0.12 0.13
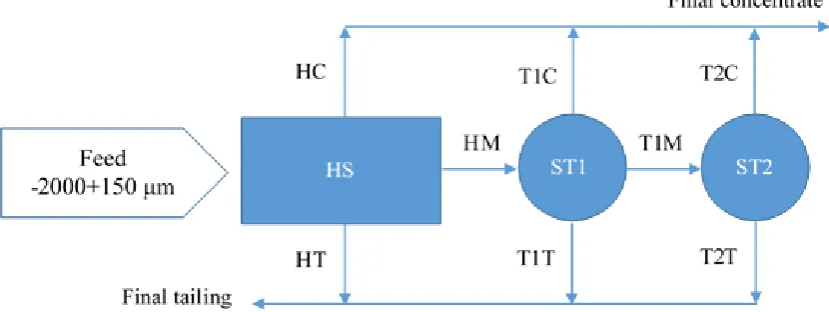
Fig. 4. Flowsheet of combined gravity concentration. Specification of each stream is described in Table 7. HS, H: Humphrey spiral, ST1&2, T1&2: First and second shaking tables, C: concentrate, M: middling, T: tailing.
Table 6. Results of shaking table experiments
Run Phase
Feed Concentrate Middling Tailing
Grade
(%) Wt.% Grade (%)
Mica dist.
(%) Wt.%
Grade (%)
Mica dist.
(%) Wt. %
Grade (%)
Mica dist. (%)
1 Rougher 22.00 20.00 49.67 45.15 70.00 15.88 50.53 10.00 9.49 4.32
Cleaner 50.00 50.00 74.90 74.90 - - - 50.00 25.10 25.10
2 Rougher 17.00 13.30 64.59 50.54 18.20 19.95 21.35 68.50 6.98 28.11
3 Rougher 11.00 11.75 39.61 42.30 28.75 14.87 38.85 59.51 3.48 18.85
The results of the second test showed a high concentration possibility for -1000+150 μm portion of the sample, because by only one step, a 64.59% mica concentrate obtained with 50.54% recovery. Results are shown in the second row (Run 2) of Table 6. Unfortunately, the tailing grades in both experiments are high and need to be decreased. Microscopic pictures of concentrate and tailing of this test are illustrated in Fig. 5. The third row (Run 3) of the table, presents the outcomes of the third shaking table experiment using -150+75 μm fraction. It can be concluded that the mica grade improved from 11 to near 40% and a low grade tailing had been gained. Also, the recovery of this test is 42.3%. Generally, it can be stated that shaking table performance is better for large particles, and declines by reduction in feed particle size. This happens because the influence of gravity force on coarse particles is higher than smaller particles [12, 40]. Even lowering the table slope for small size fractions, doesn’t show any
improvement in separation efficiency. These results suggest that other gravity concentration methods like spiral should be examined.
Fig. 5. Microscopic images of (a) concentrate and (b) tailing of the second shaking table test using -1000+150 μm fraction, magnification: 10X
Table 7. Results of Humphrey spiral-shaking table experiments
Run*
Feed Concentrate Middling Tailing
Mica (%)
Wt. (%)
Mica (%)
Mica dist. (%)
Wt. (%)
Mica (%)
Mica dist. (%)
Wt. (%)
Mica (%)
Mica dist. (%)
HS 18.00 2.21 64.84 7.96 67.90 20.46 77.17 29.89 8.96 14.87 ST1 20.46 4.89 74.38 17.78 58.20 27.00 76.82 36.91 2.99 5.40 ST2 27.00 10.18 78.30 29.53 75.09 23.78 66.12 14.73 7.97 4.35 *Tests and flowsheet are described in Fig. 4.
As described before, in the second phase of the research, spiral was used in combination with shaking table separator. The applied approach is depicted in Figure 4. Gulsoy (2006) [11] and Kademly (2012) [12] have also exploited shaking table and spiral separator to successfully reduce iron, and feldspar content of mica samples, respectively. Performing the spiral test, it was observed that most of the mica flakes were carried by a large amount of feed water which flowed outwardly to the outer part of the separation surface, leaving most of the feldspar particles in the inner part of the surface. This formed a natural gap between the valuable and gangue minerals that made their segregation possible. Comparing Table 6 and 7, it is concluded that the separation act of spiral were more effective than shaking table, since the spiral concentrator has the significant advantage of the centrifugal force contribution [12, 41].
According to the experimental results summarized in Table 7, most of the mica content of the feed has found its way to the middling product. Therefore, in order to increase the concentration recovery, the middling was introduced to a shaking table. Again, because a large portion (58.2%) of the feed went to the table middling (Table 7), it was processed by another shaking table test. The schematic diagram of these stages is presented in Figure 4.
Finally, considering the concentrate of spiral, first and second shaking tables as the final product, a concentrate with 75.5% mica grade and 39.2% recovery was obtained.
3.5. Flotation
Many researchers have applied flotation to separate mica from its associated gangue. For instance, Wang et al. (2014) [42] revealed that the separation of muscovite from quartz is feasible at strong acid pulp condition using amine collectors. Xu et al. (2013) [43] recovered 90% of moscovite by exploiting mixed cathionic and anionic collectors in pH 11. Also, Marion et al. (2015) [44] recently found out that using a cationic amine collector would not be possible without the use of a depressant.
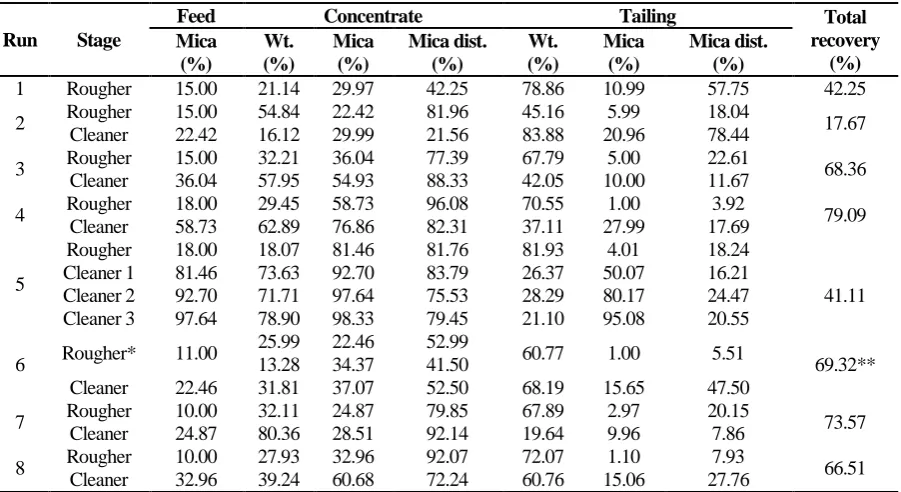
In the primary phase of this study, the first flotation experiment was conducted using oleic acid in an alkali medium (Table 2). Because of the flotation of slimes, the initial froth had a light color, and most of the floated mica was fine. Ultimately, the produced tailing with grade of 11%, contained a plenty of coarse mica. In general, the concentrate grade and recovery were 30% and 42.25%, respectively (Table 8, Run 1), which were not satisfactory. These weak results suggest that oleic acid is not an appropriate collector for flotation of phlogopite either in an alkali or acidic medium (The results are not shown).
Table 8. Results of flotation experiments
Run Stage
Feed Concentrate Tailing Total
recovery (%) Mica
(%)
Wt. (%)
Mica (%)
Mica dist. (%)
Wt. (%)
Mica (%)
Mica dist. (%)
1 Rougher 15.00 21.14 29.97 42.25 78.86 10.99 57.75 42.25
2 Rougher 15.00 54.84 22.42 81.96 45.16 5.99 18.04 17.67
Cleaner 22.42 16.12 29.99 21.56 83.88 20.96 78.44
3 Rougher 15.00 32.21 36.04 77.39 67.79 5.00 22.61 68.36
Cleaner 36.04 57.95 54.93 88.33 42.05 10.00 11.67
4 Rougher 18.00 29.45 58.73 96.08 70.55 1.00 3.92 79.09
Cleaner 58.73 62.89 76.86 82.31 37.11 27.99 17.69
5
Rougher 18.00 18.07 81.46 81.76 81.93 4.01 18.24
41.11 Cleaner 1 81.46 73.63 92.70 83.79 26.37 50.07 16.21
Cleaner 2 92.70 71.71 97.64 75.53 28.29 80.17 24.47 Cleaner 3 97.64 78.90 98.33 79.45 21.10 95.08 20.55
6 Rougher* 11.00
25.99 22.46 52.99
60.77 1.00 5.51
69.32** 13.28 34.37 41.50
Cleaner 22.46 31.81 37.07 52.50 68.19 15.65 47.50
7 Rougher 10.00 32.11 24.87 79.85 67.89 2.97 20.15 73.57
Cleaner 24.87 80.36 28.51 92.14 19.64 9.96 7.86
8 Rougher 10.00 27.93 32.96 92.07 72.07 1.10 7.93 66.51
Cleaner 32.96 39.24 60.68 72.24 60.76 15.06 27.76 * This test had two concentrates and the second one did not undergo cleaner stage.
** Recovery of mica to the cleaner concentrate plus second concentrate.
The second flotation test (Run 2) was done using Flotigam as collector. The primary froth was thin and accompanied by a lot of impurities. The second and third froth qualities were as unacceptable, but in the final stage of froth collection, a thick and heavy froth obtained. So, according to the results of this experiment (Table 8), and other experiments in other pH ranges between 2.5 to 7.5 (results are not shown), it is concluded that mica flotation by Flotigam is good at a pH around 6. In the cleaner stage, the pH was set to 7, 1 ml collector was added and a heavy froth was collected. Looking at the Table 8, the first concentrate has 22.42% mica with 82% recovery, and the final concentrate includes 30% mica with the total recovery of about 17.67%. Despite obtaining a low grade and recovery, low acid consumption, because of using relatively neutral pH, is the positive aspect of exploiting Flotigam as collector.
In the third experiment (Run 3), the sample subjected to an acidic flotation employing hexadecylamin as collector. The first collected froth was colorless and thin, and the second froth was as disappointing; however, the third one had a good quality and included a lot of mica flakes. Furthermore, a cleaner stage also performed and finally, a concentrate with about 55% mica was attained. The recovery in
the rougher stage was 77.39%, and the total recovery after cleaner phase, was 68.36%. Generally, an obvious progress was achieved by using hexadecylamin as collector. For the promising result obtained from this test, hexadecylamin collector was selected for further investigations.
For the fourth test (Run 4), the particle size of the feed was confined to the range of 150 to 400 μm. The collector previously proved to be useful was utilized in an acidic medium. The third and fourth collected froth was promising as they were heavy and accompanied by a lot of valuable mineral. As this test was performed after eliminating the particles smaller than 150 μm, the floated slimes decreased and the froth quality and process efficiency were improved, though it seems that yet some slimes are produced during the conditioning or flotation process. At last, a relatively high grade concentrate with about 77% mica and a total recovery of around 79% was produced after cleaning stage.
mica, and the coarse mica was floated subsequently. Thanks to the sodium silicate as silica depressant, the silica content of the concentrate was reduced significantly. Fig. 6 shows the microscopic images of the concentrate and tailing of this test. As it is presented in Table 8, three cleaning steps were
done, and finally a 98.5% mica concentrate was produced. Although the final product was a highly purified mica, it had a low recovery near to 41%, so it is better to stop the process after the first cleaning, and obtain a product with 92.7% mica and 68.5% recovery.
Fig. 6. Microscopic images of the rougher (a) concentrate and (b) tailing of the fifth flotation test on -840+75 μm fraction, magnification: 10X
Although flotation was proved to be highly effective from the mica grade and recovery aspect, in order to develop the reclamation process to larger scales, it is better to be substituted by low-cost gravity methods for coarse particles. Therefore, in the second phase, as the -2000+150 μm fraction had been concentrated by the combined spiral-shaking table approach, the remaining -150+75 μm fraction was purified by flotation. So, three other flotation tests (Runs 6-8) were conducted, and effects of attrition scrubbing in neutral and acidic medium were examined. Attrition scrubbing causes excellent mixing and surface abrasion and has been used successfully for gold ore processing [24], and contaminated soil remediation [25, 45, 46]. Experimental conditions and final results are shown in Table 2 and8, respectively. Looking at the table, it is obvious that attrition scrubbing reduced acid consumption from 30.6 kg/t pure sulfuric acid in test 6 (without scrubbing) to 29.1 kg/t in test 7 (with scrubbing). This is happened as a result of the elimination of fine clayey particles which consumes a large portion of acid. Because, as stated by Stegmann et al. (2013) [47], up to 90% of all contaminants can be concentrated into the fine fraction of soils. Thus, removing the small soil particles will reduce the volume of soil to be remediated, and increase reagent,
energy and cost efficiency. Moreover, application of acidic medium substantially enhanced the disliming process, and reduced acid consumption to near 18.1 kg/t. It also had a great effect on decreasing collector demand.
3.6. Proposed mica processing circuit In the final step of the study, according to the outcomes of the performed laboratory experiments, a processing circuit is proposed for the recovery and concentration of the waste mica sample. As the feed is small in size (-2 mm), no crushing or any grinding step at the beginning of the circuit is considered, and the feed is directly supplied from the waste pile. Entering to the plant, feed is transferred into a 2 mm sieve, and oversized particles are ignored, but the other part (-2 mm) is conveyed to a conditioning tank and mixes with water. If the plant capacity is assumed to be 2 ton/h, then about 67.4 kg/h of the feed is rejected as over 2 mm size portion. Therefore, the dry feed rate of the conditioning tank is 1932.6 kg/h which mixes with the same amount of water to prepare a 50% wt. solid pulp. Afterward, the pulp is pumped to a hydrocyclone to remove under 75 μm particles which exit from the overflow with a dry feed rate of 565.6 kg/h, and are transported to tailing thickeners. On the other hand, the underflow of the cyclone with the dry flow
rate of 1367 kg/h is moved to a 150 μm sieve to separate the undersized particles for flotation, and the coarser ones for gravity concentration with the solid flow rate of 1102.8 kg/h. The described process is illustrated in Figure 7 using red color.
In the gravity separation section (Fig. 7, in blue color), the pulp is pumped to a spiral separator with the capacity of 1.5 ton/h which consumes 8 m3/h water. The spiral outcome is a 65% mica concentrate with a 22 kg/h flowrate, and a tailing which is transferred to a thickener with 329.6 kg/h flow rate. The
middling of the spiral is conveyed to a shaking table concentrator (748.8 kg/h) which produces 74.87% mica concentrate (36.6 kg/h), and a tailing with a rate of 276.4 kg/h. The middling (435.8 kg/h) undergoes another shaking table processing and divides into a concentrate and tailing with the flowrate of 44.2 and 391.4 kg/h, respectively. The water consumption in the shaking table step is 56 m3/h. Finally, the gravity separation section with 105.2 kg/h throughput produces a 74.33% mica concentrate.
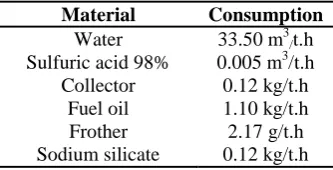
In the flotation unit (Fig. 7, in green color), the feed size is in the range of -150+75 μm which flows with the rate of 264.2 kg/h (S2U). Before entering to the flotation cells, the feed is scrubbed using 5% sulfuric acid; then, water is added (264.2 m3/h) and the resulted slurry is pumped to the second hydrocyclone to remove the produced fine particles from its overflow (47.2 kg/h). Also, the cyclone underflow moves to the conditioning tank with the rate of 217 kg/h. In this tank, hexadecylamine is added as collector along with fuel oil as activator, and sodium silicate as depressant. In the flotation section, consumption of acid, fuel oil, frother, and water are 3.9, 2.2, 2.1, and 400 L/h, and consumption of collector, and sodium silicate are 0.237 kg/h. Mica flotation includes rougher and cleaner parts. The
cleaner concentrate with the flow rate of 8 kg/h and 60.1% mica content is collected, and its tailing is returned back to the rougher cell. Furthermore, tailing of the rougher cell is transported to thickeners with the rate of 209 kg/h.
Therefore, two kinds of concentrates are obtained from the proposed circuit. One is coarse size concentrate which has a grade of 74.33% and is produced by gravity separation methods, and the second one is fine flotation concentrate with 60.1% grade. If both concentrates are combined together, the total grade and recovery of this procedure will be about 74% and 30%, respectively. A summary of water and chemical reagent consumption of this circuit are shown in Table 10.
Table 9. Mass balance of the proposed circuit
Stream name
Particle size (μm)
Wt. (%)
Mica grade (%)
Mica dist. (%)
Stream name
Particle size (μm)
Wt. (%)
Mica grade (%)
Mica dist. (%)
S1F - 100.00 12.95 100.00 T1M -2000+150 21.79 27.52 46.31
S1O +2000 3.37 23.01 5.99 T1C -2000+150 1.83 74.87 10.58
S1U -2000 96.63 12.60 93.99 T2T -2000+150 19.57 21.58 32.60
C1O -75 28.28 2.50 5.46 T2C -2000+150 2.21 79.02 13.48
C1U -2000+75 68.35 16.76 88.44 C2O -75 2.36 15.55 2.83
S2U -150+75 13.21 10.99 11.21 C2U -150+75 10.85 10.00 8.38
S2O -2000+150 55.14 18.14 77.22 RF -150+75 11.45 10.26 9.07
HT -2000+150 16.48 9.01 11.46 RT -150+75 10.45 8.08 6.52
HM -2000+150 37.44 20.78 60.08 FC -150+75 0.40 60.11 1.86
HC -2000+150 1.22 65.02 6.13 CT -150+75 0.60 15.00 0.69
T1T -2000+150 13.82 2.99 3.19 RC -150+75 1.00 33.05 2.55
Table 10. Material consumption by the proposed circuit
Material Consumption
Water 33.50 m3/t.h Sulfuric acid 98% 0.005 m3/t.h Collector 0.12 kg/t.h
Fuel oil 1.10 kg/t.h Frother 2.17 g/t.h Sodium silicate 0.12 kg/t.h
4. Conclusion
Mica may be produced using dry techniques, including screens and air classifiers. In this case, the product size is coarse and a large portion of mica may be left as waste. Therefore, regarding the high cost of mining, and exhaustion of high quality resources, attentions are drown to the recovery of fine mica from plant wastes. In this study, beneficiation experiments conducted on a
mica sample provided from the tailing disposal of Azartalgh plant, using different gravity concentration and flotation tests. According to the mineralogical studies, the main mica mineral is phlogopite which is
contaminated by feldspar minerals.
mica concentration of the spiral middling was high, application of spiral in combination with shaking table was tested which produced a 74% mica concentrate with 39.2% recovery. Therefore, it is suggested that the large particle size fraction being processed by low cost gravity concentration methods, and the remained fine particles (-150 μm) being enriched by flotation. Results of flotation tests performed after scrubbing and disliming steps indicated that it was feasible to reduce chemical consumption due to the elimination of fine clayey particles. Flotation experiment using hexadecylamine, pine oil, and fuel oil in an acidic pulp with 35% solid percent produced a concentrate with 60.7% mica grade and 66.5% recovery. Finally, according to the results summarized above, and considering the optimized conditions, a pilot plant flow sheet was proposed for mica reclamation from mica processing waste disposals. This circuit is able to recover about 30% of the mica content of the feed with a grade of 74%.
Acknowledgement
This research work is financially supported by the Applied Industrial and Mineral Studies, Hi-tech Industries, Ministry of Industry, Mine and Trade of Iran, under the contract number of 38708232361011. Authors also greatly appreciate the scientific supports of Dr. Mirsaleh Mirmohammadi, and Dr. Mahin Mansouri Esfahani in this research.
References
[1]. Kogel, J.E., Trivedi, N.C., Barker, J.M. & Krukowski, S.T. (2006). Industrial minerals & rocks: commodities, markets, and uses. SME, Colorado, USA, 637-652.
[2]. Browning, J.S. & Adair, R.B. (1966). Selective flotation of mica from Georgia pegmatites. US Dept. of the Interior, Bureau of Mines, 6830.
[3]. Norman, J.E. & O'meara, R. (1941). Froth flotation and agglomerate tabling of micas. US Dept. of the Interior, Bureau of Mines. 3558.
[4]. Arocena, J. & Velde, B. (2009). Transformation of chlorites by primary biological agents-a synthesis of X-ray diffraction studies. Geomicrobiology Journal, 26(6), 382-388.
[5]. Kalinowski, B.E. & Schweda, P. (1996). Kinetics of muscovite, phlogopite, and biotite dissolution and alteration at pH 1-4, room
temperature. Geochimica et Cosmochimica Acta, 60(3), 367-385.
[6]. Taylor, A.S., Blum, J.D., Lasaga, A.C. & MacInnis, I.N. (2000). Kinetics of dissolution and Sr release during biotite and phlogopite weathering. Geochimica et Cosmochimica Acta, 64(7), 1191-1208.
[7]. Nagy, K. (1995). Dissolution and precipitation kinetics of sheet silicates. Reviews in Mineralogy and Geochemistry, 31(1), 173-233.
[8]. Bulatovic, S.M. (2007). Handbook of flotation reagents: chemistry, theory and practice, 3, Elsevier.
[9]. Kuzvart, M. (2013). Industrial minerals and rocks. Elsevier, Amsterdam, Holand, 222-228.
[10]. Santos, S.F., França, S.C.A. & Ogasawara, T. (2011). Method for grinding and delaminating muscovite. Mining Science and Technology, 21(1), 7-10.
[11]. Gulsoy, O. & Kademli, M. (2006). Effects of operational parameters of spiral concentrator on mica-feldspar separation. Mineral Processing and Extractive Metallurgy, 115(2), 80-84.
[12]. Kademli, M. & Gulsoy, O.Y. (2012). The role of particle size and solid contents of feed on mica-feldspar separation in gravity concentration. Physicochemical Problems of Mineral Processing, 48(2), 645-654.
[13]. França, S.C.A., Santos, S.F. & Ogasawara, T. (2008). Alternative route to muscovite mica dressing, in IX Argentine Conference on Mineral Processing. San Juan, Argentina.
[14]. Gershenkop, A.S. & Khokhulya, M. (2004). Physical separation (gravity and shape) of small-sized mica ore. European Journal of Mineral Processing & Environmental Protection, 4(3), 253-259.
[15]. Burt, R. (2013). A review of gravity concentration techniques for processing fines. in Production and Processing of Fine Particles: Proceedings of the International Symposium on the Production and Processing of Fine Particles, Montreal, Canada, 375-386.
[16]. Mular, A.L., Halbe, D.N. & Barratt, D.J. (2002). Mineral processing plant design, practice, and control. SME, Colorado USA, 1162-1164.
[18]. Kelina, I.M., Tsypin, Y.F. & Aleksandrova, Y.P. (1983). About factor of friction of mineral benefication of mica slates on the shelved separator. Izvestiya Vysshikh Uchebnykh Zavedenii, 4, 126-129.
[19]. Lee, P.K., Touray, J.C., Baillif, P., Ildefonse, J.P. (1997). Heavy metal contamination of settling particles in a retention pond along the A-71 motorway in Sologne, France. Science of the Total Environment, 201(1), 1-15.
[20]. Legret, M. & Colandini, V. (1999). Effects of a porous pavement with reservoir structure on runoff water: water quality and fate of heavy metals. Water Science and Technology, 39(2), 111-117.
[21]. Zanders, J. (2005). Road sediment: characterization and implications for the performance of vegetated strips for treating road run-off. Science of the Total Environment, 339(1), 41-47.
[22]. Durand, C. (2003). Physico‐chemical characterisation of stormwater sediments: Origin and fate of trace metals and organic pollutants. PhD thesis, University of Poitiers (in French).
[23]. Clozel, B., Ruban, V., Durand, C., Conil, P. (2006). Chemical and mineralogical assessment of the origin and mobility of heavy metals (Cd, Zn, Pb, Cu, Ni, Cr) in contaminated sediments from retention and infiltration ponds. Appl. Geochem, 21, 1781-1798.
[24]. Sharp, K. (1993). Selective soft self attrition gold dissolution. Provisional Patent Application NR: 93/9645, 34.
[25]. Bayley, R. & Biggs C. (2005). Characterisation of an attrition scrubber for the removal of high molecular weight contaminants in sand. Chemical Engineering Journal, 111(1), 71-79.
[26]. Pryor, M. (2012). Mineral processing. Springer Science & Business Media, Netherland.
[27]. Parekh, B. & Miller, J. (1999). Advances in flotation technology. SME, Colorado USA, 245-256.
[28]. Sekulić, Ž., Canić, N., Bartulović, Z. & Daković, A. (2004). Application of different collectors in the flotation concentration of feldspar, mica and quartz sand. Minerals Engineering, 17(1), 77-80.
[29]. Mackintosh, E. & Lewis, D. (1968). Displacement of potassium from micas by dodecylammonium chloride. Int Soc Soil Sci Trans, 2, 695-703.
[30]. Bhappu, B. (1964). Recovery of Valuable Minerals f rom Pegmatite Ores. New Mex. Bureau of Mines, Min. Resources. Circ., 70, 1-29.
[31]. Jinni, H.G.F. & Yipeng, M.M.W. (2013). Application of Combined Collectors in Flotation of Lepidolite. Non-Metallic Mines, 4, 009.
[32]. Beausoleil, N., Lavallée, P., Yelon, A., Ballet, O., Coey, J.M.D. (1983). Magnetic properties of biotite micas. Journal of Applied Physics,
54(2), 906-915.
[33]. Parkhomenko, E.I. (2012). Electrical Properties of Rocks. Springer US.
[34]. Mehdilo, A., Irannajad, M., Zarei, H. (2014). Smithsonite Flotation from Zinc Oxide Ore using Alkyl Amine Acetate Collectors. Separation Science and Technology, 49(3), 445-457.
[35]. Raesisi, A. & Amini, A. (1990). Mica Enrichment of Gharabagh Deposite. Geological Survey of Iran.
[36]. Ipekoglu, B. & Asmatulu, R. (1996). The recovery studies of pure mica for paint industry. in 6th international symposium of Mineral Processing. Kusadasi, Turkey: CRC Press.
[37]. Schoeman, J. (1989). Mica and vermiculite in South Africa. Journal of the South African Institute of Mining and Metallurgy, 1-12.
[38]. Iverson, H. (1932). Separation of feldspar from quartz. Engineering and Mining Journal, 133, 227-229.
[39]. Adair, R., McDaniel, W., Hudspeth, W. (1951). New method for recovery of flake mica. Mining Engineering, 3, 252-254.
[40]. Wills, B.A. (2011). Wills' Mineral Processing Technology: An Introduction to the Practical Aspects of Ore Treatment and Mineral Recovery. Elsevier Science.
[41]. Kelly, E.G. & Spottiswood, D.J. (1982). Introduction to mineral processing. Wiley.
[42]. Wang, L., Sun, W., Liu, R. (2014). Mechanism of separating muscovite and quartz by flotation. Journal of Central South University, 21, 3596-3602.
[43]. Xu, L., Wu, H., Dong, F., Wang, L., Wang, Z., Xiao, J. (2013). Flotation and adsorption of mixed cationic/anionic collectors on muscovite mica. Minerals Engineering, 41, 41-45.
sulfonate depressant. Separation and Purification Technology.
[45]. Stražišar, J. & Sešelj, A. (1999). Attrition as a process of comminution and separation. Powder Technology, 105(1), 205-209.
[46]. Feng, D., Lorenzen, L., Aldrich, C. & Mare, P.W. (2001). Ex situ diesel contaminated soil
washing with mechanical methods. Minerals Engineering, 14(9), 1093-1100.