Http://www.ijetmr.com©International Journal of Engineering Technologies and Management Research [39]
TREND ANALYSIS OF LAND UTILIZATION IN BANGLADESH
Mohammad Shohel Rana *1, Mohammad Omar Faruk 1, Najma Begum 1, Mimma
Tabassum 1
*1 Department of Statistics, Noakhali Science and Technology University, Noakhali, Bangladesh
Abstract:
Due to alterations in physiographic and social-economic conditions, climatic changes, adaptation and population growth, the land utilization of Bangladesh is changing very rapidly. Small farms and landless household constitute about 80% of total area households, the majority of whom depend on agriculture for their livelihood. It is obvious that total agriculture land over the periods in the past has not increased although population has increased significantly [12]. Bangladesh is a small country but it bears a huge population, resulting in a very high density of population and very high intensity of land and resource use. Based on secondary data of Bangladesh Bureau of Statistics, an attempt has been made in this paper to evaluate the changes in land use pattern during the period of 1990 to 2015. Absolute utilization of land for different purposes during this period as well as trend values and growth rates were estimated. Trend analysis and exponential growth rate showed that forest area significantly increased by 35.93% and 0.3% per annum and land not available for cultivation is significantly decreased by 4.49% and 0.04%per annum respectively. Result also show that cultivate waste is significantly decreased at the rate of 1.1% per annum. On the other hand, a current fallow is decreased by 0.2% per annum. The trend values was found statistically significant for land use in forest and cultivate waste.
Keywords: Trend; Growth; Land; Utilization; Cultivable.
Cite This Article: Mohammad Shohel Rana, Mohammad Omar Faruk, Najma Begum, and
Mimma Tabassum. (2019). “TREND ANALYSIS OF LAND UTILIZATION IN BANGLADESH.” International Journal of Engineering Technologies and Management Research, 6(2), 39-46. DOI: https://doi.org/10.29121/ijetmr.v6.i2.2019.354.
1. Introduction
Http://www.ijetmr.com©International Journal of Engineering Technologies and Management Research [40]
With the growth of a country’s economy, agricultural land is usually transferred to non-agriculture as the demand for non-farm products and services increases. This is specially so when the country’s population and its per capita income rise. We are not aware of the extent of conversion of farm land for non-agricultural uses in Bangladesh and consequent production losses in agriculture. It is generally claimed that in Bangladesh every year over 80 thousand hectares of agricultural land i.e. nearly one per cent a year [11] is being converted to non-agriculture. Another way of looking at the national land use is through the land utilizations statistics, as collected and published by Bangladesh Bureau of Statistics [10]. The viewpoint is agricultural, so that details of the other land uses are masked. In this attempt land use classification is as follows: net cropped area, current fallow, current waste, forest, and area not available for cultivation. In this land use classification scheme, the areas not suitable for cultivation or not under forest are thrown into one category. This is obviously not very helpful in determining national land use. The term land use has been defined differently from various perspectives by different scholars. It has seen as a product of interactions between a society’s cultural background, skill and its physical needs in one hand, and the natural potential of land on the other [2]. Land use is also defined as men’s activities on land, which are directly related to land [3]. Land use is characterized by the arrangements, activities and inputs by people to produce change or maintain a certain land cover type [4]. Land use defined in this way therefore establishes a direct link between the land cover and the actions of people in their environment [5]. Land cover is the observed biophysical cover on the earth’s surface [6].
In Bangladesh almost one-third of the land (29%) is classed as Highland and Slightly lower land, known as the Higher Medium Highland or MH-1, occupies over one-tenth (11.5%) of the land surface. The next lower level is known as Lower Medium Highland or MH-2, the total area 23.2% is classed as MH-2. Medium Lowland forms 12% of the total area and mainly by rivers which flow through these lowlands. Lands inundated between 180 cm and 300 cm is known as Lowland and such land occupies 7.6% of the total area. Even lower land with inundation depths in excess of 300 cm forms 1.4% of the total area of the country. The remaining 15.3% of the land area is either water bodies or urban and rural settlements [13].
The total cultivable land of the country is not more than 0.782 acres ha and per capita land is only 0.0526 ha. Moreover, every year 1% of its arable land or 82900 ha of crop land and everyday 221 ha of arable land is losing in Bangladesh [6]. Despite the remarkable achievement in controlling the high birthrate, the population continues to grow by 2 million people each year because of the large existing population base [8]. The country’s population will be over around 190 million by 2030 when an extra 25% food grains will have to be produced. But the additional harvests will have to be reaped from a much smaller area of cropland than is now available [9]. According to one projection, the country would have to grow an additional five to six millions tones of grains by 2020 in a land area two million ha less than today. In this perspective land use changing pattern is a valuable question to study agricultural land in Bangladesh.
2. Objectives
The objectives of the research were:
1) To know the land distribution of Bangladesh.
2) To observe the availability of agricultural land has changed since last 26 years.
Http://www.ijetmr.com©International Journal of Engineering Technologies and Management Research [41]
3. Data and Method
This study tries to discover answers to the questions who, what, when, where and sometimes how. The study is conducted on the basis of the secondary data, collected from [7] and analysis the changes in land use pattern during the period of 1990 to 2015. Considering five lands uses variable for the analysis such as land in forest, not available for cultivation, cultivate waste, current fallows and net cropped area. Absolute changes of land use for different purposes during this period as well as trend values and growth rates were estimated using MS excel and SPSS software 15.0 version. Various statistical time series measures, such as Semi average methods, least square method of trend value and exponential growth of non linear trend method were used to analysis the data. The limitation of this study is that this study did not use primary data. Despite this limitation, the collected data have been processed manually and present form has been prepared in order to make the study more informative, analytical and useful for the users.
4. Result and Discussion
Table 1 shows the changes in land utilization patterns of Bangladesh during the period of 1990 to 2015. It can be seen the table that in 1990 to 2002 (I) and 2003 to 2015 consider as a period-IIby using semi-average method:
Table: 1 Land use pattern for different purpose during the period 1990 to 2015 Table-01 (Figures in 000’ acres)
Year Forest Not available of
cultivation
Cultivate waste
Current fallows
Net cropped area period-I
1990 to 2002
5114.15 9204.77 1214.31 1202.92 19707.38
period-II 2003 to 2015
6347.23 8989.62 594.15 1150.07 19532.45
Change during Period I and II
1233.08 (24.11%)
-215.15 (-2.33%)
-620.16 (-51.07%)
-52.85 (-4.39%)
-174.92 (-0.88%)
This means the forest area was 5114.15 thousand acres on an average which had increased to 6347.23 thousand acres in Period II and an increase of 24.11% during 26 years period. It is not sufficient increase to fight the global climate change for a country. Land not available for cultivation was 9204.77thousand acres on an average which had decrease to 8989.62 thousand acres in Period II and a decrease of 2.33% during 26 years period. This means decrease of land not available for cultivation indicates the land availability for cultivation has increase slowly in that period. Similarly cultivate waste and current fallows have decreases by 51.07% and 4.39% respectively during the period of 1990 to 2015.
Http://www.ijetmr.com©International Journal of Engineering Technologies and Management Research [42]
Table: 2 Represents the results of linear trend fitted by least square method of considerable variable for the period of 1990 to 2015.
Table-2 (in 000’ acres)
Land use Fitted trend t-value Significance level
Land in forest
Not available for cultivation Cultivate waste
Current fallows Net cropped area
y=5910.46+35.93t y=9097.19- 4.49t y= 904.23-22.26t y= 1176.5-8.83t y= 19619.84-6.44t 6.366 -0.526 -8.995 -1.53 -1.421 .000* .604 .000* .139 .168 *means significant at 5% level
Table: 3 Represents the results of non-linear trend of growths by exponential method for the period of 1990 to 2015.
Table-3 (in 000’ acres)
Land use Fitted trend Annual growth t-value Significance level
Land in forest Not available for cultivation
Cultivate waste Current fallows Net cropped area
logy= 3.769+0.003t logy=3.95- 0.0004t logy= 2.92-0.011t logy= 3.049-0.002t logy= 4.29-0.0001t 0.3% 0.04% 1.1% 0.20% 0.01% 6.424 -0.353 -11.34 -1.176 -1.39 .000* .727 .000* .251 .177
*means significant at 5% level
4.1.Forest land
Trend analysis showed that forest area increased by 35.93% per annum (Table-2), however the trend value was found statistically significant. The trend of forest area during the period of 1990 to 2015 can also be seen from figure-1. It shows that trend value increasing but significant decrease in forest area was observed during in 2010. Further increase in forest area was found at the end of 2015 (figure-1). Analysis of exponential growth rate showed an increase of forest area by 0.3% per annum which was significant increase as confirmed by t-value.
Figure 1: Trend of forest area during the period from 1990 to 2015
0 1000 2000 3000 4000 5000 6000 7000 8000
1990 1991 1992 1993 1994 1995 1996 1997 1998 1999 2000 2001 2002 2003 2004 2005 2006 2007 2008 2009 2010 2011 2012 2013 2014 2015
Http://www.ijetmr.com©International Journal of Engineering Technologies and Management Research [43]
4.2.Not Available for Cultivation
Trend analysis of land not available for cultivation is decreased by 4.49% per annum (Table-2), however the trend value was not found statistically significant. The trend of land not available for cultivation area during the period of 1990 to 2015 can also be seen from figure-2. It shows that trend value decreasing but it does not mean to increase land available for cultivation. With the population the use of land for non-agricultural purposes as well as housing, roads, market, etc. are increasing day by day which caused converting land from agriculture to non-agricultural purposes, thus reducing land available for cultivation. It should be taken a necessary step from now to increase land available for cultivation.
Further analysis of exponential growth rate showed a decrease of land not available for cultivation area by 0.04% per annum which was insignificant decrease as confirmed by t-value.
Figure 2: Trend ofnot available for cultivationarea during the period from 1990 to 2015
4.3.Cultivate Waste
Cultivable waste land was 1214.31 thousand acres on an average in period I which had decrease to 594.15 thousand acres in period II and a decrease of 51.07% during 26 years period.
Trend analysis of cultivate waste is decreased by 22.26% per annum (Table-2), however the trend value was found statistically significant. As a decrease of cultivate waste, it’s a good sign for the
economy of Bangladesh to challenge the global sustainable development. The trend of cultivate waste area during the period of 1990 to 2015 can also be seen from figure-3. It shows that trend value decreasing but significant increase in cultivate waste area was observed during in 2015 (figure-3).
Further analysis of exponential growth rate showed a decrease of cultivate waste area by 1.1% per annum which was significant decrease as confirmed by t-value.
0 2000 4000 6000 8000 10000 12000
Not available for cultivation
Http://www.ijetmr.com©International Journal of Engineering Technologies and Management Research [44]
Figure 3: Trend of cultivate waste area during the period from 1990 to 2015
4.4.Current Fallows
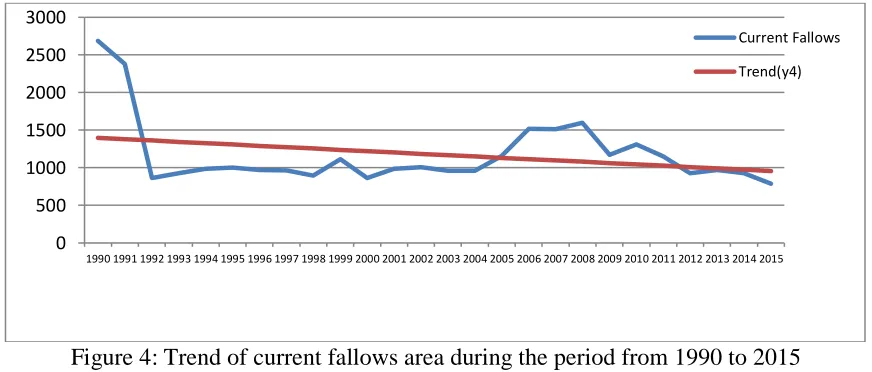
Current fallows land was found to be about 1202.92 thousand acres on an average in period I which had decrease to 1150.07 thousand acres in period II (Table 01). Thus, Current fallows land was reduce by about 52.85 thousand acres and a decrease of 4.39% during the period from 1990 to 2015.
Trend analysis of current fallows is decreased by 8.83% per annum (Table-2), however the trend value was found statistically insignificant. As a decrease of current fallows, it’s a good sign for the
economy of Bangladesh but not sure to use of this land for agricultural purposes. It should be ensured that the government uses this land in agricultural purposes to take in challenge the global sustainable development. The trend of current fallows area during the period of 1990 to 2015 can also be seen from figure-4. It shows that trend value decreasing slowly but significant decrease in current fallows area was observed during in 2014 to 2015 (figure-4).
Further analysis of exponential growth rate showed a decrease of current fallows area by 0.2% per annum which was insignificant decrease as confirmed by t-value.
Figure 4: Trend of current fallows area during the period from 1990 to 2015
0 200 400 600 800 1000 1200 1400 1600 1800
1990 1991 1992 1993 1994 1995 1996 1997 1998 1999 2000 2001 2002 2003 2004 2005 2006 2007 2008 2009 2010 2011 2012 2013 2014 2015
Cultivable Waste Trend (y3)
0 500 1000 1500 2000 2500 3000
1990 1991 1992 1993 1994 1995 1996 1997 1998 1999 2000 2001 2002 2003 2004 2005 2006 2007 2008 2009 2010 2011 2012 2013 2014 2015
Current Fallows
Http://www.ijetmr.com©International Journal of Engineering Technologies and Management Research [45]
4.5.Net Cropped Area
Trend analysis shows that land of net cropped area in Bangladesh during the period of 1990 to 2015 decreased by about 6.44 thousand acres per annum (table-2), however the trend value was not found statistically significant over the period. It is an important alarming situation that the total net cropped area of Bangladesh has been reduced rapidly over the period of 26 years. It observed that if this trend is continues the net cropped area will be zero acres within next 1523 years. It should be taken a necessary step from now to increase land net cropped area for cultivation.
The trend of land net cropped area during the period of 1990 to 2015 can also be seen from figure-2. It shows that trend value decreasing over the period 26 years.
Further analysis of exponential growth rate showed a decrease of net cropped area by 0.01% per annum which was not significant by table 03.
Figure 5: Trend of net cropped area during the period from 1990 to 2015
5. Conclusion
With uncontrolled population growth and economic development in the study area, the land use pattern is changing rapidly. The overall analysis in this paper showed that there has been significant decrease in net cropped area in Bangladesh during 1990 to 2015. Since land is very limited in Bangladesh and land available for cultivation has been reducing day by day, land productivity as well as cultivable land must be increased for all the people of the country. Using exponential growth analysis, it was found that net cropped area for cultivation over the period is losing by 0.01% per annum. If this rate continues, the net cropped area will be zero acres within next 1523 years. To face the challenges, a small number of recommendations such as vertical progress of infrastructures and imposing of taxes on such structures, accumulated zonal growth planning, industrialization, population growth control, increasing education and improvement of awareness among the people of the country have been proposed.
18000 18500 19000 19500 20000 20500 21000
1990 1991 1992 1993 1994 1995 1996 1997 1998 1999 2000 2001 2002 2003 2004 2005 2006 2007 2008 2009 2010 2011 2012 2013 2014 2015
Net Cropped Area
Http://www.ijetmr.com©International Journal of Engineering Technologies and Management Research [46]
Acknowledgment
I would like to thanks to the students of first batch of Statistics department, NSTU those who are always their support and help to complete our study. Also thanks to my colleagues who are inspire and encourage for completing this research paper.
References
[1] Planning Commission of Bangladesh. Population and Housing Census, Preliminary Result of 2011;
Bangladesh Bureau of Statistics (BBS): Dhaka, Bangladesh, 2014. Available online: http://203.112.218.65/WebTestApplication/userfiles/Image/National%20Reports/SED_REPORT _Vol-4.pdf (accessed on 30 December 2012).
[2] Ram R and Kolakar S. 1993. The Future of Our Land: Facing the Challenge. Hall of India Pvt. Ltd.,
New Delhi.
[3] Vink RK. 1975. A framework for land evolution. www.mpl.fr/creat/tallercolumbia/
FAO/AGLL/pdf. docs.
[4] Di Gregorio CM and Jansen J. 1998. A new concept for a land covers classification system. Land
2(1): 55-58.
[5] Lillesand TM and Kiefer RW. 2002. Remote Sensing and Image Interpretation. John Wiley and
Sons, Inc. New York.
[6] Islam M.R. and Hassan M.Z.2011.Land use changing pattern and challenges for Agricultural land:
a study on Rajshahi district. J. Life Earth Sci., Vol. 6: 69-74, 2011.
[7] Bangladesh Bureau of Statistics (BBS). 2016. Year Book of Agricultural Statistics of Bangladesh
Bureau of Statistics Ministry of Planning, Government of the People`s Republic of Bangladesh, Dhaka.
[8] Mahbub A. 2003. Agricultural land loss and food security: An assessment. IRRI, Manila, The
Philippines.
[9] Bhuiyan M. 2003. Has urbanization caused agricultural land loss? The Daily Star, November 1
2003.
[10] Bangladesh Bureau of Statistics (BBS). 2011. Year Book of Agricultural Statistics of Bangladesh
Bureau of Statistics Ministry of Planning, Government of the People`s Republic of Bangladesh, Dhaka.
[11] Planning Commission 2009. Steps Towards Change – National Strategy for Accelerated Poverty
Reduction II (Revised). FY 2009-11. Government of the People’s Republic of Bangladesh, Dhaka.
[12] W. M. H. Jaim and Rabeya Begum (2003), “Changes in Land Use Pattern in Bangladesh Over the
Last Two Decades”, Bangladesh J. Agric. Econs XXVI, 1& 2(2003) 87-96.
[13] Bangladesh, National Encyclopedia Bangladesh. www.banglapedia.org
*Corresponding author.