INHERITANCE MECHANISM OF SOME YIELD COMPONENTS IN
BREAD WHEAT
Zahid Akram, Saif Ullah Ajmal, Ghulam Shabbir*, Muhammad Munir and Nasir Mahmood Cheema**
ABSTRACT: A set of 8x8 diallel cross comprising promising genotypes was studied to analyze the inheritance pattern of yield components in bread wheat. The different yield related traits estimated were spike length, number of spikelets
spike-1, number of grains spike-1, 1000 grain weight and grain yield plant-1. The
analysis of variance depicted that 56 F1 and their parents were significantly
dif-ferent for all the parameters. Uniformity of Wr-Vr over arrays as well as signifi-cant deviation of regression coefficient (b) from unity confirmed the suitability of additive-dominance model to account for the data analysis. The estimates of genetic component of variation in all the traits exhibited the preponderance of over dominance gene action. The estimates of average degree of dominance for
spike length (1.139), 1000 grain weight (1.421), number of spikelets spike-1 (2.293),
number of grains spike-1 (1.631) and grain yield plant-1 (1.111) evidenced the
preva-lence of non additive gene action controlling these traits. The present results, therefore, revealed that selection for these traits in early generation may not be useful and it has to be delayed till segregating generations.
Key Words: Bread Wheat; Diallel; Yield Components; Gene Action; Pakistan.
INTRODUCTION
Wheat (Triticum aestivum) is the staple diet of most of the countries including Pa-kistan. Wheat has contributed significantly to the overall production in the country as well as giving economic returns to the farm-ing community. In spite of high yield po-tential, Pakistan is lagging behind the world’s average and maximum potential is yet to be exploited. This indicates that there is a good scope of increasing wheat produc-tion in the country.
Grain yield is a complex phenomenon that results from the interaction of vari-ous yield contributing characteristics. It cannot be improved by mere phenotypic selection of desirable plants, rather study of inheritance mechanism governing vari-ous components of yield need to be ascer-tained. A first prerequisite is knowledge of its genetic make up and the nature of gene action. Diallel analysis technique as devel-oped by Hayman(1954a,b) provides opportu-nity on the nature and type of gene action in early generation and helps the breeders
to make his choice of selection for desired objectives.
Hussain et al. (1986) reported that additive type of gene action was operative with partial dominance for number of spikelets spike-1 while for number of grains
spike-1and grain yield plant-1, over
domi-nance type of gene action was present. Khan et al. (1992) found additive type of gene ac-tion with some degree of partial dominance for spike length. Altinbas and Bilgen (1996) and Chowdhry et al. (1997) have reported partial dominance with additive type of gene action for most of yield components in wheat. However researchers like Chowdhry et al. (2002), Riaz and Chowdhry (2003), Kashif and Khaliq (2003), Suleyman and Akguni (2007 and Akbar et al. (2009) have observed the prevalence of over domi-nance for number of grains spike-1, 1000
grain weight and grain yield plant-1.
During the present study the F1 data on yield parameters obtained by crossing eight parents of bread wheat were analyzed to determine the inheritance mechanism
* Department of Plant Breeding and Genetics, Pir Mehr Ali Shah, Arid Agriculture University, Rawalpindi, Pakistan.
of these traits following additive dominance model (Hayman, 1954 a, b).
MATERIALS AND METHODS The experimental material used in the present study was developed by crossing eight local wheat genotypes viz. Pak-81, Pothowar 93, Parwaz 94, Shahkar 95, Suleiman 96, Chakwal 97, Kohistan 97 and MH 97 which were quiet distinguishable for the traits studied. Sowing was done dur-ing November, 2000 with two sowdur-ing dates November 5 and 20 to facilitate hybridiza-tion. Crossing of the varieties was per-formed according to diallel fashion, during February-March 2001, whereas, the parent varieties were self-pollinated to maintain the true to type seed.
The seeds of 28 direct crosses and 28 reciprocal crosses along with their parents were sown in the field on November 3, 2001. Randomized complete block design was followed in the experiment having three replications. Each treatment com-prised a single 5 m long row in each repli-cation. Inter row and interplant distances were kept at 30 cm and 20 cm, respectively. Basal fertilizer dose of NPK was applied @ 100-40-0 kg ha-1 to meet the nutritional
requirements of the crop.
Data regarding spike length (cm), num-ber of spikelets spike-1, number of grains
spike-1, 1000 grain weight (g), and grain
yield plant-1(g) were recorded during the
cropping season and after harvest. Before analyzing the data set for diallel technique, the data were subjected to analysis of vari-ance technique following Steel and Torrie (1980) to ascertain the significant differ-ences among mean values of genotypes.
Additive-dominance model of Hayman (1954 a,b) is widely used technique to study the basis of genetic variation in early gen-erations like F1 and it also provides the nature and magnitude of the genetic behaviour. In this technique, the total sum of squares is partitioned into various com-ponents, namely, a (additive), b (non-addi-tive, which is further subdivided into b1, b2 and b3), c (maternal) and d (reciprocal
dif-ferences other than c).
Significance of test of item ‘a’ suggests the significance of additive effects of genes and of item ‘b’, the dominance effects. Sig-nificance of ‘b1’ indicates that the domi-nance is unidirectional. Asymmetry of gene distribution is indicated by the item ‘b2’, whereas item ‘b3’ tests that part of dominance deviation which are not attrib-utable to‘b1’ and ‘b2’. Item ‘c’ tests the pres-ence of maternal effects whereas item ‘d’ tests the reciprocal differences other than ‘c’. Further analysis of data using Vr, Wr approach of Hayman (1954 a) is valid only when ‘b’ item is significant.
Testing the Validity of the Hypothesis Two scaling tests i.e., uniformity of Wr, Vr and joint regression analysis were con-ducted to ascertain the data sets for ad-equacy of the additive-dominance model. Wr-Vr is expected to be constant over ar-rays, if all assumptions of the analysis are fulfilled. Heterogeneity of Wr-Vr arrays in-dicates that one or more of the assump-tions are not fulfilled for that character. The Wr-Vr values were calculated for each of eight arrays and their homogeneity was tested through the value of t2.
In joint regression analysis, the re-gression coefficient (b) of covariance (Wr) on variance (Vr) for each character is ex-pected to be significantly different from zero, but not significantly different from unity, if all assumptions hold true (Jinks and Hayman,1953).
Genetic Parameters
The genetic parameters i.e., E (envi-ronmental variance from ANOVA), D (esti-mate of additive and some portions of addi-tive x addiaddi-tive genetic variance), F (esti-mate of relative frequencies of dominant and recessive alleles in the parents), H1 and H2 (estimate of dominance and dominance x dominance interactions, respectively), h2
(overall dominance effect), H2/4H1 (the pro-portion of genes with positive and negative effects in the parents), (H1/D)1/2 as the
mean degree of dominance, KD/KR (the
proportion of dominant and recessive genes in the parents) and heritability estimates in narrow sense were computed according to Mather and Jinks (1982).
RESULTS AND DISCUSSION This approach is based on the estima-tion of components of variaestima-tion. It was ini-tially developed by Jinks and Hayman (1953). Diallel analysis has been exten-sively used in both self and cross pollinated crops to understand the nature of gene ac-tion involved in the expression of quanti-tative traits.
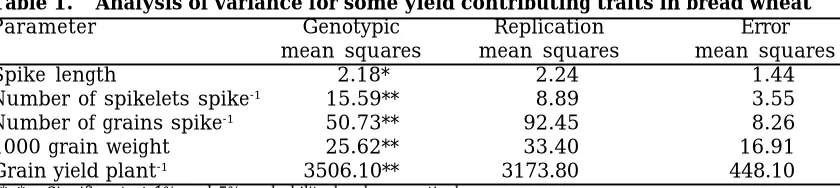
The mean squares of the analysis showed that genotypic differences for all the characters were highly significant (P=0.01) (Table 1). Therefore, the data were arranged in diallel tables for formal analysis of vari-ance. Hayman’s analysis of variance was conducted for each character under study and is discussed as under:
Spike Length
The results of two scaling tests (Table 2) i.e. uniformity of Wr and Vr (t2 test) and
regression analysis indicated that assump-tions were completely fulfilled. Therefore, simple additive dominance model was
ad-equate to determine genetic component of variation in spike length.
The non-significant ‘a’ item revealed the absence of additive genetic effects (Table 3). The non-significant ‘b1’ item showed the absence of directional domi-nance effects. Both ‘b2’ and ‘b3’ items were found to be significant indicating that genes for spike length were distributed asym-metrically among the parents and specific gene effects were also present. The signifi-cant (P=0.01) ‘b’ item suggested the pres-ence of dominance gene effects. Due to non-significant ‘c’ and ‘d’ items, maternal and reciprocal effects were not present.
Non-additive genetic variances play significant role in the expression of this character as indicated by the value of non-additive variance (Table 4). Positive F value expressed that dominant alleles were more frequent than the recessive one. The (H1/ D)1/2 value also revealed the presence of
over dominance gene action. As the h2/4H 1
did not deviate from its expected value 0.25, therefore the gene distribution was sym-metrical. The ratio of KD/KR revealed that more dominant alleles were present in the parents for the trait. The researchers like Patil et al. (1995) and Hassan et al. (1996) also reported over dominance for spike
Table 1. Analysis of variance for some yield contributing traits in bread wheat
Parameter Genotypic Replication Error
mean squares mean squares mean squares
Spike length 2.18* 2.24 1.44
Number of spikelets spike-1 15.59** 8.89 3.55
Number of grains spike-1 50.73** 92.45 8.26
1000 grain weight 25.62** 33.40 16.91
Grain yield plant-1 3506.10** 3173.80 448.10
**, * = Significant at 1% and 5% probability level, respectively.
Table 2. Validity of hypothesis through two scaling tests
Parameter Analysis of Joint Regression Analysis
uniformity of Regression coefficient ± Hî: b = 0 Hî: b = 1 Wr-Vr (t2) Standard error
Spike length 0.81 b = 0.72 ± 0.20 2.69* 1.15
No. of spikelets spike-1 1.57 b = 0.62 ± 0.17 3.51* 4.20**
No. of grains spike-1 0.63 b = 0.61 ± 0.22 2.77* 3.79**
1000 grain weight 0.14 b = 0.85 ± 0.25 3.36* 2.69*
Grain yield plant-1 1.00 b = 0.95 ± 0.07 3.69* 3.40*
length. Due to involvement of over domi-nance, selection of this trait in early gen-erations would be difficult.
Number of Spikelets Spike-1
The significant ‘a’ and ‘b’ items exhib-ited the presence of additive and dominance genetic effects in the genetic control of number of spikelets spike-1 (Table 3). The
non-significant ‘b1’ item revealed the ab-sence of directional dominance. Similarly ‘b2’ and ‘b3’ items were also non-significant indicating the symmetrical distribution of genes and absence of specific genetic ef-fects in the inheritance of this character. Due to significant (P=0.05) ‘c’ item, the mean square of ‘a’ was retested against ‘c’ which then reduced to non-significant. It evidenced that additive genetic effects were suppressed by maternal effects for this par-ticular character. The ‘d’ item was observed to be non-significant.
Hayman’s analysis of variance (Table
3) suggested that the item ‘b’ was signifi-cant. Therefore further analysis of variance (Vr) and covariance (Wr) was conducted. To test the adequacy of the additive dominance model for the data sets two scaling tests were carried out. The analysis of data re-vealed that uniformity test of Wr-Vr vali-dated the model whereas joint regression analysis partially fulfilled the assumptions (Table 2). However, further analysis of ge-netic components could still be carried out. Dominance genetic variances (H1, H2, h2) to play an important role in the
expres-sion of this character as the values of non-additive genetic variances were significant (Table 4). Over dominance was suggested for this trait on the basis of (H1/D)1/2 ratio.
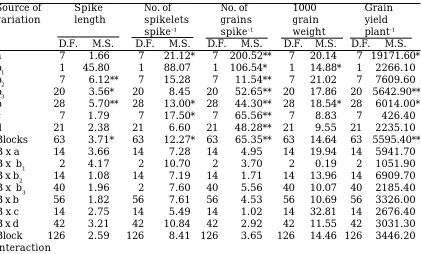
A low value (0.156) of the proportion H2/4H1 indicated that positive and negative alle-les were unequally distributed at the loci exhibiting dominance in the parental geno-types. The ratio of KD/KR proposed that more dominant alleles than the recessive Table 3. Formal analysis for some yield contributing traits in an 8 x 8 diallel cross
of wheat
Source of Spike No. of No. of 1000 Grain
variation length spikelets grains grain yield
spike-1 spike-1 weight plant-1
D.F. M.S. D.F. M.S. D.F. M.S. D.F. M.S. D.F. M.S.
a 7 1.66 7 21.12* 7 200.52** 7 20.14 7 19171.60*
b1 1 45.80 1 88.07 1 106.54* 1 14.88* 1 2266.10
b2 7 6.12** 7 15.28 7 11.54** 7 21.02 7 7609.60
b3 20 3.56* 20 8.45 20 52.65** 20 17.86 20 5642.90** b 28 5.70** 28 13.00* 28 44.30** 28 18.54* 28 6014.00*
c 7 1.79 7 17.50* 7 65.56** 7 8.83 7 426.40
d 21 2.38 21 6.60 21 48.28** 21 9.55 21 2235.10 Blocks 63 3.71* 63 12.27* 63 65.35** 63 14.64 63 5595.40** B x a 14 3.66 14 7.28 14 4.95 14 19.94 14 5941.70 B x b1 2 4.17 2 10.70 2 3.70 2 0.19 2 1051.90 B x b2 14 1.08 14 7.19 14 1.71 14 13.96 14 6909.70 B x b3 40 1.96 2 7.60 40 5.56 40 10.07 40 2185.40 B x b 56 1.82 56 7.61 56 4.53 56 10.69 56 3326.00 B x c 14 2.75 14 5.49 14 1.02 14 32.81 14 2676.40 B x d 42 3.21 42 10.84 42 2.92 42 11.55 42 3031.30 Block 126 2.59 126 8.41 126 3.65 126 14.46 126 3446.20 interaction
**, * = Significant at 1% and 5% probability level, respectively.
a (additive), b (non-additive), b1 (unidirectional dominance), b2 (asymmetric gene distribution), b3 (tests that part of dominance deviation which are not attributable to‘b1’ and ‘b2’), c (tests the presence of maternal effects), d (tests the reciprocal differences other than c).
were controlling this character. The ratio of h2/H
2 revealed that four groups of genes
might be controlling this character. Low values of heritability were obtained due to over dominance type of gene action. Over dominance gene action was also reported by Khan et al. (1992) and Altinbas and Bilgen (1996) for number of spikelets spike-1. The over dominance type of gene
action indicated that effective selection may not be possible in the early genera-tions. The variation in the results might be due to different genetic materials and environmental conditions involved.
Number of Grains Spike-1
The formal analysis of variance for number of grains spike-1 (Table 3) showed
that all the items were highly significant (P=0.01) except ‘b1 item which was
signifi-cant (P=0.05). The signifisignifi-cant ‘a’ and ‘b’ items revealed the presence of additive and dominance genes for number of grains spike-1. The significant ‘b
1’ item (P=0.05)
showed the presence of directional domi-nance. The parents contained differing number of dominant genes for this char-acter, as ‘b2’ item was significant. The
sig-nificant ‘b3’ item revealed the presence of
specific gene action. The significant ‘c’ and ‘d’ items showed the presence of maternal and reciprocal effects in the expression of this character. As ‘c’ and ‘d’ items are sig-nificant, the values of ‘a’ and ‘b’ items are to be tested against ‘c’ and ‘d’ items, respec-tively, (Mather and Jinks, 1982).
After retesting ‘a’ and ‘b’ items, the situation became quiet different. The non-significant ‘a’ item suggested that mater-nal effects had masked the genes acting additively. Similarly non-significant ‘b’, ‘b1’,
‘b2’ and ‘b3’ suggested the predominant role
of reciprocal effects on the development of number of grains spike-1. The analysis of
variance (Vr) and covariance (Wr) was car-ried out, since the item ‘b’ was significant for number of grains spike-1. The results of
the uniformity tests and joint regression analysis indicated that assumptions were completely fulfilled by uniformity test. How-ever, for regression analysis the data
par-Table 4.
Estimates of genetic components for some yield contributing traits in an 8 x 8 diallel cross of wheat
Spike length
No. of spikelets
spike
-1
No of grains
Spike
-1
1000 grain weight
Grain Yeild plant
-1 Parameter Estimates Estimates Estimates Estimates Estimates D 0
.444* ± 0.179
0.784 ± 0.654
10.309* ± 20.17
2.899* ± 1.242
210.357* ± 7.725
F
0.553 ± 0.426
1.1323 ± 1.554
-4.411 ± 4.788
1.270± 2.947
499.268 ± 0.247
H1
0.581± 0.415
4.12
5* ± 1.512
27.437* ± 4.658
5.861* ± 2.867
485.730* ± 4.127
H2
0.612 ± 0.361
2.586* ± 1.315
25.910* ± 4.053
1.058 ± 2.494
422.596* ± 4.164
h
2
0.373
± 0.241
11.513* ± 0.880
14.743* ± 2.711
-0.011 ± 1.669
82.715 ± 0.069
E
0
.854* ± 0.060
3
.041* ± 0.219
1.812
± 0.675
4.985** ± 0.416
70.433 ± 1.770
(H 1 /D) 1/2 1.139 2.293 1.631 1.421 1.111 H2 /4H 1 0.263 0.156 0.236 0.045 0.220 KD/KR 3.377 2.164 0.767 1.364 1.071 Heritability -0.053 0.119 0.495 0.039 0.607
(N.S.) **, * = Significant at 1% and 5% probability level, respectively. E = Environmental variance, D = Estimate of additive and some portions of additive x additive genetic variance, F = Estimate of
relative frequencies of dominant
and recessive alleles in the parents, H
1
and H
2
= Estimate of dominance and dominance x dominance interactions, respectively, h
2= Overall dominance effect,
H2
/4H
1
= Proportion of genes with positive and negative effects in the parents, (H
1
/D)
1/2
= Mean degree of dominance, KD=KR= Proportion of dominant and
tially fulfilled the assumptions. The esti-mation of genetic parameters could still be carried out.
The estimates of components of varia-tion i.e. D, H1, H2, F and h2 for number of
grains spike-1 showed that both additive
and non-additive types of gene actions were involved in the inheritance of this charac-ter as indicated by the significant additive and dominance variances (Table 4). Domi-nance genetic variances (H1,H2,h2) were
found to play an important role in the ex-pression of this character due to their higher magnitude. F value was negative and non-significant indicating greater fre-quency of recessive alleles than dominant ones. Over dominance was suggested for this trait on the basis of (H1/D)1/2 ratio. The
proportion of positive and negative alleles was close enough to 0.25 which indicated that both the alleles were distributed equally over the loci. Similar results were obtained by Sabour et al. (1996), Pandey et al. (1999) and Riaz and Chowdhry (2003) who reported over dominance gene action for number of grains spike-1. The character
thus seems difficult to fix and the progress in selection will be inherently slow.
1000 Grain Weight
The analysis of variance of compo-nents of variation in 1000 grain weight (Table 3) revealed that ‘a’ item was non-significant showing the absence of additive genetic effects in the manifestation of this character. The significant (P=0.05) ‘b1’ item showed the presence of directional domi-nance and ‘b’ item revealed the presence of dominance genes for 1000 grain weight, respectively. The genes were distributed symmetrically among the parents as the item ‘b2’ was non-significant. Similarly, non-significant ‘b3’ expressed the absence of specific gene action in the inherit-ance of 1000 grain weight. The maternal and reciprocal effects did not contribute in the genetic control of 1000 grain weight as ‘c’ and ‘d’ items were non-significant.
The results divulged that the item ‘b’ was significant(Table 3). Therefore analy-sis of variance (Vr) and covariance (Wr) was
accomplished for this trait. The two scal-ing tests i.e. uniformity of Wr-Vr and joint regression analysis were carried out to de-termine the fitness of data to additive dominance model (Table 2). The uniformity test completely fulfilled the assumptions while the joint regression analysis shows the partial failure. On the basis of these results, the data can still be processed for further genetic studies.
Both additive and non-additive types of gene actions were involved in the inherit-ance of 1000 grain weight as is indicated by significant additive and dominance vari-ances (Table 4). The dominance genetic ef-fects, however seemed to be more promi-nent due to higher magnitude of H1 than D. F value was positive suggesting the pres-ence of dominant genes in more frequency than recessive genes. (H1/D)1/2 ratio
evi-denced the over dominance genetic effects. The proportion of genes with positive and negative effects (H2/4H1) in the parents was less than 0.25 denoting asymmetry at the loci showing dominance. The KD/KR ratio suggested more dominant alleles in the parents for the trait. Similar results were also obtained by Hassan et al. (1996), Mishra et al. (1996), Sabour et al. (1996) and Chowdhry et al. (2002). Since the inherit-ance of the said trait involved over domi-nance therefore, early selection of this trait is highly difficult. The difference in the results might be attributed to the varia-tion in genetic constituvaria-tion of the geno-types and environmental conditions.
Grain Yield Plant-1
The formal analysis of variance for grain yield plant-1 (Table 3) showed that
both ‘a’ and ‘b’ items were significant (P=0.05) and indicated the presence of ad-ditive and dominance genetic effects con-trolling this character. The non-significant ‘b1’ and ‘b2’ items exhibited the absence of directional dominance and unequal distri-bution of genes. The significant (P=0.01) ‘b3’ item reflected the presence of specific gene action. The non-significant ‘c’ and ‘d’ items showed the absence of maternal and recip-rocal effects in the expression of this
acter.
Hayman’s analysis of variance of dial-lel tables showed that the item ‘b’ being significant for character under study, hence the analysis of variance (Vr) and Covariance (Wr) was carried out. To see the fitness of data for Hayman Jinks model of genetic analysis, two scaling tests were carried out. The uniformity tests supported the data while joint regression analysis partially fulfilled the assumptions suggest-ing that the simple genetic model was par-tially adequate to analyse the data.
The results showed that the estimates of additive (D) and non-additive (H1) genetic variances were significant indicating the importance of both additive and dominance types of gene actions(Table 4). However, the magnitude of non-additive gene effects (H1 and H2) was higher revealing the role of dominance gene effect. Over dominance genetic effects were also detected for this trait on the basis of (H1/D)1/2 ratio. The
pro-portion of genes with positive and negative effects H2/4H1 in the parents was less than 0.25 denoting asymmetry at the loci show-ing dominance. The KD/KR ratio suggested more dominant alleles in the parents for this character. The findings of Hassan et al. (1996), Lonc and Zalewsky (1996), Pandey et al. (1999), Chowdhry et al. (2002), Riaz and Chowdhry (2003) and Kashif and Khaliq (2003) agreed with the present re-sults.
It is therefore concluded that the prevalence of over dominance type of gene action controlling the yield contributing traits in bread wheat genotypes involved in this study. The selection for these traits in early generations may not be useful and it had to be delayed till segregating gen-erations. Although there is scope for im-provement of these yield traits, there exist limitations in the use of information gained because the eight parents crossed were specifically selected and did not rep-resent a random sample of all wheat geno-types. However, the present findings may not apply to whole of wheat germplasm and
therefore needs more testing.
LITERATURE CITED
Akbar, M. Anwar, J. Hussain, M. Qureshi, M.H. and Khan, S. 2009. Line x tester analysis in breadwheat (Triticum
aestivum L.). J. Agric. Res. 47(1): 411-420.
Altinbas, M. and Bilgen, G. 1996. A study on gene action for spike characters in two spring wheat (Triticum aestivum L.) crosses. Anadolu, 6: 84-99.
Chowdhry, M.A. Ambreen, A. and Khaliq, I. 2002. Genetic control of some polygenic traits in aestivum species. Asian J. Pl. Sci. 1: 235-237.
Chowdhry, M.A. Arshad, M.T. Subhani, G.M. and Khaliq, I. 1997. Inheritance of some polygenic traits in hexaploid spring wheat. J. Anim. and Pl. Sci. 7:77-79. Hassan, A.M. Sabour, M.S. Shafi, A.A.
Sherif, H.S. and Hamada, A.A. 1996. Genetic analysis of diallel cross in bread wheat under different environment con-ditions in Eygpt. Indian J. Genet. and Pl. Breed. 56(1): 34-48.
Hayman, B.I. 1954a. The theory and analy-sis of diallel crosses. Genetics, 39:789-809.
Hayman, B.I. 1954b. The analysis of vari-ance of diallel tables. Biometrics, 10: 235-244.
Hussain, M. Khan, N.I. Shah, S.S.D. and Bajwa, M.A. 1986. Diallel analysis of re-sponse to nitrogen and phosphorus in wheat. J. Agric. and Res. 24:251-257. Jinks, J.L. and Hayman, B.I. 1953. The
analysis of diallel crosses. Maize Genet-ics Cooperation Newsl. 27: 48-54. Kashif, M. and Khaliq, I. 2003. Mechanism
of genetic control for some quantitative traits in bread wheat. Pakistan J. Biol. Sci. 6(18): 1586-1590.
Khan, F.A. Aslam, M. and Rana, M.S.K. 1992. Genetic studies on yield and its components and plant height in spring wheat diallel crosses. Sarhad J. Agric. 8(2): 153-157.
Biuletyn-Instytutu-Hodowli-I-Aklimatyzacji- Roslin: 200: 267-275.
Mather, K. and Jinks, J.L. 1982. Biometri-cal Genetics. Chapman and Hall Ltd. Lon-don.
Mishra, P.C. Singh, T.B. Kurmvanshi, S.M. and Soni, S.N. 1996. Gene action in a diallel cross of wheat under late sowing conditions. J. Soil and Crop, 6(2): 128-131.
Pandey, D.P. Tashi, D. Sharma, D.L. and Dawa, T. 1999. Combining ability and gene action in intervarietal crosses in bread wheat. Crop Res. Hisar. 18(2): 261-265.
Patil, M.S. Manaka, B.S. Chavan, V.M. and Kachole, U.G. 1995. Diallel analysis in bread wheat. Indian J. Genet. and Pl. Breed. 56(3): 320-323.
Riaz, R. and Chowdhry, M.A. 2003. Genetic analysis of some economic traits of wheat under drought condition. Asian J. Pl. Sci. 2: 790-796.
Sabour, M.S.A. Hassan, A.M. Shafi, A.A.A. Sherif, H.S. and Hamada, A.A.1996. Ge-netic analysis of diallel crosses in bread wheat under different environment con-dition in Egypt. Indian J. Genet. and Pl. Breed. 56(1): 49-61.
Steel, R.G.D. and Torrie, J.H. 1980. Prin-ciples and Procedures of Statistics A Bio-logical Approach. McGraw-Hill Inc., New York. p.56-78.
Suleyman, S. and Akguni, N. 2007. Com-bining ability and inheritance of some agronomical traits in bread wheat (Titicum aestivum L.) Ziraat Fakultesi Dergisi. 21(41): 104-108.