A thesis presented for the degree of Doctor of Philosophy in the University of Oanterbur.t,
Christchurch, New Zealand.
Volume I contains the text, Volume II the figures, tables
and pla teso The endpaper to Volume II is a general reference
TJU3LE OF CONTENTS
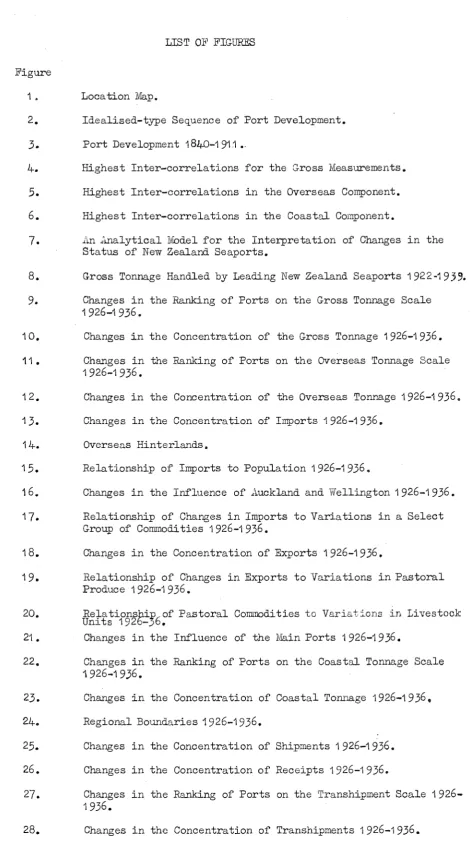
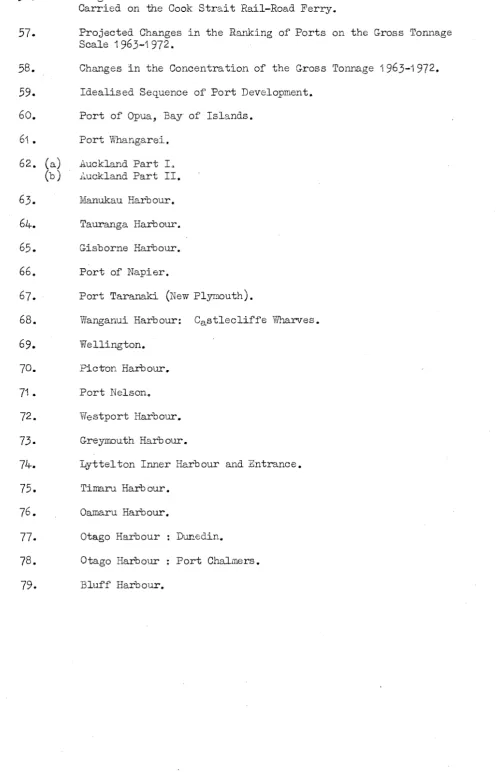
LIST OF FIGURES
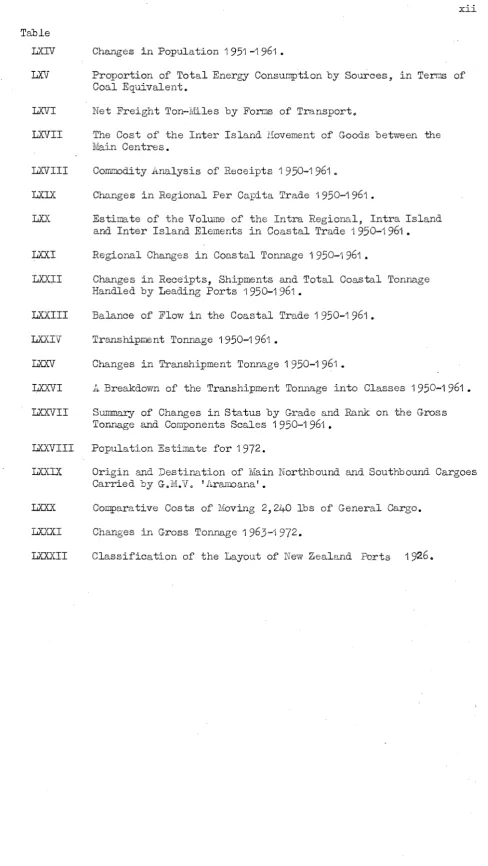
LIST OF Til.BI.ES
LIST OF PLATES .o••oaaaoCI•~~>•o•oe.ooeaooaaa.ooaoooo-•ooaaoo•••oo••
IJ:JTRODUCTION • o 111 • co .o • • " 4 o oo • • & • • o o • o D b o liP o o o t> o o • o •" e""' o • • a • • • P..tl.RT I. TFIE DEVELOPMENT OF' J\J"EV"i
ZEiJ..tf\.IID SE.APORTS Chapter
I P Il.TTERl\18 SlliGE 1 840
•...•...•••.••...
PJffiT II. ..:ill ~·.Ni>LYSIS OF THE CHlu"'ifGING ST~~.TUS OF NEW ZEAL.;J'ID SEJPORTS. Introduction.
II IN SE.tillCH OF i\. Iv1Eli.SUBE:tviENT • 0 • • • • • • • • • • • • • • • • • • • • • • • • • • • • Tr:E 1v1ETHOD OF ill'l".ll.LYSIS •••••••••••••••••••••••••• · ••••••••
IV CF....:i.NGES L~ THE OF SEJ.PORTS 1926-1936
v
CFL:;.NGES lli THEJ ST.c,.TUS 0111 SEilPORTS 1950-1961 • oO • • • • • • • • • • •OONCI1JSIO~T ... " •••••••••••••••••••••.•••••••
P.i>.RT III. SOlVIE OBSERVATIONS ON THE FuTUBE DEVELOPMENT OF
ZEl.Jui.ND SEllPORTS.
VI CHtiliGES lli THEJ STATUS Oii' SEi.PORTS 1963-1 •O•fleta•••a•~•
1\PPE:NDICES
...
""... .
I RECURRENT l'J<.;1l.TU:a:8S II\ Tiill LA.YOU'I: OF SEJ..POP:.T S.
II QUESTION~uuRE.
SURVEY OF THE NEW ZEll.Lil.:f\i"D SEJ.PORTS.
Page
iv - vi
vii - ix x - xii xili- xi'r
1 -
4
5 - 16
19 - 28
- 31 80 81 - 157
1 - 159
160 - 171 172 - 200
A work of this magnitude involves a considerable debt of gratitude to many individuals and organisations. In the first place I am grateful to the merrib er nations of the Com.rnonweal th which had commendable foresight in establishing a Colllil.lonweal th Scholarship ru1d J!'ellowship Scheme to enable
research s tndents to study in countries other than their own. 1'he award of a Commonwealth Scholarship under the Scheme has penni tted me to pursue full time research in New Zealand since April 1962. 'rhis unique opportunity has enabled me to deepen and broaden my knmvledge of an important country of the Commom-:real th. It is to be hoped that the dissemination of the experience gained in Ne1•v Zealand vd.ll make a small contribution tovvards the sponsor's
ai~B of deepening and strengthening the cultural links of individual Co~~n
wealth countries.
I would also like to thank the Vice Chancellor and Council of the University of Canterbury for providing research facilities during my stay in New Zealand. Acknowledgement is also made of the generous grant from the University Grants Co~mittee tovvards the cost of field work.
In the course of fieldwork many individuals, too nQrnerous to mention in detail, provided hospitality and inforr:ution. Although their contribution
Hk'1.Y not be fow1d directly in the pages tho.t follow they provided me with a deep insight into the New· Zealand character and the country's constantly changing geogro.phy. Special thanks, hovrever, are given to Ivir Peter Hosking (nmv of Southern Illinois University) and 1'Ir and lVIrs G. Kitching of ·rvai tarere Beach.
Committee, Holm Shipping Co. Ltd. (Capt. Holm), Union Steam Ship Co. of New Zealand Ltd, Anchor Co. Ltd, iuexander Turnbull Library, General
Librar.r, Dominion i!Xchives, Canterbu.r;:y Public Library (i!IIr
La.rrib)
and the University of In a sparsely the sole geographer
Library.
country like New Zealand /Rhere one may be a large topic) stiimllus is more likely to be derived from conversations with workers in outside the acade:-nic sphere. I therefore owe a special debt to Ivir J .i:.. Cashin, Chief
of Lyttelton Harbour Board, for his unfailing
to
discuss problems and new lines of approach. ~t wealth of infor:wution on New Zealandand ports has also been provid.ed by lvressrs R. Coorribes, Atholl Kirk, Allan Kirk, W. Laxton, I. Stewart, I. J:!,arquhar, W. C. Coorrib er and
7{. Pierre. I am also indebted to Nr I. Farquhar for reading rrw manuscript and providing helpful comments.
Iunong the staff of the University of Canterbu.r;:y Depart.'1lent of Geography my thav..ks are due to Professor R.S. lVIr J .N. Rayner, Dr L.J. King (now of Ohio UI"..iversi ty), Mr G. Goll<Jdge (now of Iowa University) and Professor l'tJ:cCarty (Visiting Professor 1962) for the stimulus of their questions or critical co1nments. Dr l•lfu.rray McCaskill deserves a special mention as he has provided a veritable storehouse of information on New Zealand In addition, Dr McCaskill has also read the manuscript and offered cor~tructive and penetrating comrnents. I would like to tharik the students in the Department of Geography for acclimatising me to New Zealand conditions. In I would like
to express my gratitude to the students whose parents gave me hospitality during 4Y fieldwork.
In Christchurch, thanks are due to Mrs I.~. Shaw and faJPily with whom I boarded for two years. The kindness of Dr and };Irs !Ill. lvicCaskill and family convalescence and the hospitality of Dr Jane Soons, Miss J •
.:.i..
li!Jiss M.]Jl. Eales and ·ivliss J .Ivi. Ryburn deserves special mention.Grateful acknowledgement is also made to
Mr
J .K. JVIacdonald and Ivlissc •
.:~. of the Department of Geography in the of Canterburyfor all ~ps and , to JI1Ir R. Sime for his assistance in
and to Miss Clare Chisman for proof reading the 1nanuscript. The consid-erable labour of typing the manuscript has been cheerfully and capably under-taken by li'Irs N. V. Duggan.
I am indebted to my parents,Iv.fr and Thirs J.W. Rimmer, without vvhose help I would not have had the opportunity of furthering lTIY research. In preparing this tJ1esis, however, I owe much to my tutor1Mr W. B. Johnston, for constant encouragement, stimulus and criticism.
Christchurch. Deceniber 1
964.
Figure 1. 2.
3.
4.
5.
6.
7.
8.
9.
1
o.
11 •
12.
13.
14.
15.
16.
18.
19.
20.21.
22.23.
24.
25.
26.
27.
28.
LIST OF FIGURES
Location :iYiap.
Idealised-type Sequence of Port Development. Port Development
1840-1 911 •.
Highest Inter-correlations for the Gross Measurements. Highest Inter-correlations in the Overseas Component. Highest Inter-correlations in the Coastal Component.
il.n Analytical N.10del for the Interpretation of Changes in the Status of New Zealand Seaports.
Gross Tonnage Handled
by
Leading New Zealand Seaports1922-1939.
Changes in the Ranking of Ports on the Gross Tonr~ge Scale1926-1936.
Changes in the Concentration of the Gross Tonnage
1926-1936.
Changes in the Ranking of Ports on the Overseas Tonnage Scale1926-1936.
Changes in the Concentration of the Overseas Tonnage
1 926-1 9 36.
Changes in the Concentration of Imports1926-1936.
Overseas Hinterlands.
Relationship of Imports to Population
1 926-1 936.
Changes in the Influence of Auckland and Wellington
1926-1936.
Relationship of Changes in Imports to Variations in a Select Group of Commodities1926-1936.
Changes in the Concentration of Exports
1926-1936.
Relationship of Changes in Exports to Variations in Pastoral Produce
1926-1936.
Relationshi:p
6of Pastoral Commodities to Vari&tions i:n Livestock
Units
1926-) •
Changes in the Influence of the Niain Ports 1 926-1 9 36.
Changes in the Ranking of Ports on the Coastal Tonnage Scale
1926-1936.
Changes in the Concentration of Coastal Tonnage
1926-1936.
Regional Boundaries 1926-1936.Changes in the Concentration of Shipments
1926-1936.
Changes in the Concentration of Receipts1926-1936.
Changes in the Ranking of Ports on the Transhipment Scale
1926-1936.
Figure
29.
Gross Tonnage Handled by the LeadingNew
Zealand Seaports1946-1963,
30.
Changes in the Ranking of Ports on the Gross Tonnage Scale1950-1961.
31.
32.
Changes in the Concentration of the Gross Tonnage
1950-1961.
Changes in the1950-1961.
of Ports on the Overseas Tonnage Scale
33.
Changes in the Concentration of the Overseas Tonnage1950-1961.
34.
The Turn-Round of Overseas Shipping on theNew
Zealand Coast1 941 /2-1 961 •
35.
Changes in the Concentration of Imports1950-1961 •
36.
Relationship of brports to Population/19 50..1 9·61.
37.
Import Hinterlands.38.
Relationship of Changes in Imports to Variations in Population1950-1 961.
39.
Details of Berthage, Permitted Draught and Permitted Vessel Size at Individual Ports1 961 •
Hierarchy of Ports for Distributing Imports of Value and Low Bulk.
Intrinsic
41.
The Percentage Accumulation of Selected Comrrodities Imported by All Ports in1 950
and 1961 •
42.
Relationship of Selected Corn.."llodi ties to Population1 950-1 961 •
43.
Relationship of Changes in Imports to Variations in a SelectGroup of Commodities
1950-1961.
44.
Changes in the Concentration of Exports1950-1961.
45.
Export Hinterlands.46.
Relationship of Pastoral Exportsto
Livestock Units1950-1961.
47.
Relationship of Changes in Exports to Variations in Pastoral Commodities1950-'i 96/1 •
48.
Changes in the Ranking of Ports on the Coastal Tonnage Scale1950-1 961.
49.
Changes in the Concentration of the Coastal 'ronnage1 950-1 961 •
50.
Regional Boundaries 1950-1961
51.
Changes in the Concentration of Shipments1950-1961.
52.
Changes in the Concentration of Receipts1 950-1 96'i •
53.
Methods Used by Sample Firms in Distributing Goods to Different Regions of New Zealand,1962.
54.
Changes in the Ranking of Ports on the Transhipment Tonnage Scale1950-1961.
Figure
56.
Origin and Destir~tion of Northbound and Southbound Traffic Carried on the Cook Strait Rail-Road Ferry.57.
58.
59.
60.
61.
62.
(a)
(b)
63.
64-.
65.
66.
67.
68.
69.
70.
71..
72.
73.
74-.
75.
76.
77.
78.
79.
Projected Changes in the Ranking of Ports on the Gross Tonnage Scale
1963-1972.
Changes in the Concentration of the Gross Tonnage
1963-1972.
Idealised Sequence of Port Development. Port of Opua,
Port Vfuangarei. Auckland Part I, 1:...uckland Part II. W!anukau Harbour. Tauranga Harbour. Gisborne Harbour. Port of Napier.
of Islands.
Port Taranaki (New Plyr~outh).
Wanganui Harbour: Castlecliffe Wharves. Wellington.
Picton Harbour. Port Nelson. Westport Harbour. Greymouth Harbour.
Lyttel ton Inner Harbour and Entrance. Tima.ru. Harbour.
Oama.ru Harbour.
Otago Harbour Dunedin.
LIST OF Tii.BLES Table
I Matrix of Intercorrelations of Gross Variables. II Matrix of Intercorrelations of Overseas Variables.
III l'ihtrix of Intercorrelations of Coastal Variables. IV Gross Tonnage 1922-1938.
V Changes in Gross ToP4~ge ~926-~936.
VI Overseas 1926-1936.
VII Changes in Overseas Tonnage 1926-1936. VIII Changes in Imports 1926-1936.
IX Leading Import Cornmodities 1926-1936. X Changes in Exports 1926-1936.
XI Balance of Flow in the Overseas Trade 1926-1936. XII Coastal Tonnage 1926-1936.
XIII Changes in Coastal Tonr~ge 1926-1936. XIV Changes in Shipments 1926-1936.
X:v · Regional Changes in Shipments 1926-1936.
XVI Changes in Receipts 1926-1936. XVII
XVIII XIX
XX
XXI
XXII
XXIII XXIV
XXVI
Regional Changes in 1 926-1936. Changes in Population 1926-1936.
Commodity Analysis of Shipments 1926-1936. Regional Per Capita Trade 1926-1 936.
Estimates of the Volume of Intra Regional, Intra Island and Inter Island Elements in the Coastal Trade 1926-1936.
Regional Changes in Coastal Torinage 1926-1936.
Changes in Trade Handled by Leading Ports 1926-1936. ·Balance of Flow in the Coastal Trade 1926-1936.
Transhipment Tonr~ge 1926-1936.
Changes in Transhipment Tonnage 1 926-1 9 36.
XXVII Volume and Percentage of Trade in Transhipment C~asses 1926-1936. XXVIII
XXIX
XXX
SUIDJl1.ary of Changes in Status by Grade and Rank on the Gross Tonnage and Component Scales 1926-1936.
Gross Tonnage 1946-1963. Changes in Gross
Table
XXXII Changes in Overseas Tonnage 1950-1961. XXXIII Changes in Imports 1950-1961,
XXXIV Nuniber of Calls Made by Overseas Ships 1 950-1 961 • XXXV l~£ival of Vessels by Ports of Entry.
XXXVI Port Charges.
XXXVII Deviations from Expected Imports on Basis of the Port's Hinterland Population '1950.
XXXVIII Deviations from Expected Imports on Basis of the Port's Hinterland Population 1 961 •
XXXIX Deviations from Expected Imports on Basis of Changes in a Port's Hinterland Population 1950-1961.
XL Imports of Petroleum Products.1950-1961. XLI Imports of IV.tanures 1950-1961.
XLII Imports of Harmvoods 1950-1961. XLIII Imports of Other Goods 1950-1 961 • XLIV Imports of Fresh Frn t 1950-"1961. XLV Imports of ~Jllheat and Flour 1950-1 961. XLVI Changes in Exports 1 950-1 961 •
XLVII Changes in Export Commodities 1 9 50-1 961 ~ XLVIII Changes in Pastoral Produce '1950-1961. ·
XLIX Estimated Tonnage Changes from Hinterland Adjustments 1950-1961. · L Vessels Departing for Overseas at the Final Port of Departure
Only 1 950-1 961 •
LI Changes in Livestock Units 1950-1961.
LII Variations in Pastoral Tonnage and Changes in Productivity 1950-1961 0
LIII Exports of Timber Products 1950-1961. LIV Exports of Fresh Fruit 1950-1 961 • LV Changes in Forelands 1950-1961. LVI Index of Concentration 1950-1 961.
LVII Balance of Flow in Overseas Trade 1950-1961 *
LVIII Coastal Tonnage 1950-1961.
LIX Changes in Coastal Tonnage 1 950-1961. LX Changes in Shipments 1950-1961.
LXI Regional Changes in Shipments 1 950-·t 961 • LXII Changes in Receipts 1950-1961.
Table LXIV
LXVI LXVII
LXVIII LXIX
LXX
LXXI
LXXJI
LXXIII
LXXIV
LXXVII
LXXIX
LXXX LXXXI LXXXII
Changes in Population 1 951 -1 961 •
Proportion of Total Energy Consumption by Sources, in Terms of Coal Equivalent.
Net Freight Ton-Miles by Forms of Transport~
The Cost of the Inter Island i!Iovement of Goods between the Main Centres.
Co~uodity Analysis of Receipts 1950-19610
Changes in Regional Per Capita Trade 1950-1961.
Estimate of the Volmne of the Intra Regional, Intra Island and Inter Island Elements in Coastal Trade '1950-1961.
Regior~l Changes in Coastal Tonnage 1950-1961.
Changes in Receipts, Shipments and Total Coastal Tonnage Handled by Leading Ports 1950-1961.
Balance of Flow in the Coastal Trade 1 950-1 961 • Transhipment Tonr~ge 1 950-1 961 •
Changes in Transhipment Tonr.age 1 950-1 961 •
~Breakdown of the Transhipment Tonnage into Classes 1950-1961.
Summary of Changes in Status by Grade and Rank on the Gross
Tor~e and Components Scales 1950-1961.
Population Es ti:na te for 'I 972.
and Destination of Iviain Northbound and Southbound Cargoes Carried by G.J\II.Vo 1 Aramoana 1
•
Comparative Costs of :Moving 2, 240 lbs of General Cargo. in Gross TonrlB.ge 1963-'i 972.
[image:12.595.56.545.33.900.2]Plate I II III
v
VI VII VIIIIX
X XI XII XIIIxrv
XVI XVII .XVIIIXIX
XX XXI XXII XXIIIxxrv
XXVI
XXVII
xx:viii XXIX XXXLIST OF PLA.TES
Cobb's Coach Fording the Flooded Waimakariri River.
Teams of Bullocks Hauling Wool Wagons, at Kurow, North Otago. Hoki tika River. Sketch of River and Shipping 1860's.
Greyrnouth : ~.i\ireck of S.S. 1 Star of the South', 1884.
Oamaru Harbour : Sketch of Shipping, 1880. The Pigroot Road, near Dunkirk, Central Otago. Loading Wool on the East Coast.
Wool Being Brought from a Back Country Station, East Coast. Taranaki Railway : 1\ Steep Incline in a Tarana.1ci Gorge. A Rough Track Through the King Countr-y.
A Lorry Rounds a Corner of a Perched on Coastal Cliffs. Wellington in the 1930's.
Tokoma.ru Bay : The First Stage in the Development of an Artificial Harbour.
New Plymouth at the Turn of the Century : The Second Stage in the Development of an ilrtificial Harbour.
Napier : The Third Stage in the Development of an 1\.rtificial F..arbour.
Opua, Bay of Islands. 'IThangarei Harbour •
The Town Basin, Vlliangarei.
Loading Cement at Portland, 'jiJhangarei. A General View of the Port of Auckland. 'Jilharves at l.uckland.
Onehu_nga 'Nharves.
The Town 'ifuarves, Tauranga.
'Wharves at Mount 1VIaunganui, Tauranga. Kaiti Basin, Gisborne.
Plate
XXXI The Port of Picton. XXXII Port Nelson.
XXXIII ~iiestport. XXXIV Greymouth.
XXXV Lyttelton
ana
Christchurch City. XXXVI Lyttelton Harbour.XXXVII The Port of Tima.ru. XXXVIII The Port of Oamaru. XXIX City 'V.'ha.rves, Dunedin. XL Port Chalmers.
XLI Bluff Harbour.
/J3BREVI.ATIONS
The following abbreviations are used in footnote citations of various journals.
A.A.A.G. lumals of the ociation of American Geographers.
A..J.H.R.
Eo on. Geogr. Geogr. J,
Geogr. Rev.
Journ. Roy. Stat. Soc.
Appendices to the Journals of the House of Representatives.
Economic Geography. Geographical Journal. Geographical Revievv.
Journal Royal Statistical Society. Spelling
I..n alternative spelling of Tologa Bay is Tolaga Bay,.
From Russell New Plymouth
To of Islands
It is the purpose of this study to determine and explain changes in the relative status of New Zealand seaports during two significant periods in the country's economic development, in an attempt to identify and understand the complex physical a~d hurran factors affecting the development of ports.
The origin and evolution of New Zealand seaports since the establish-ment of British settleestablish-ment in i 840 has closely mirrored the nature and the direction of the economic growth of the countrs. Indeed, seaports as places "equipped. to facilitate the necessary relations between ships as agencies of sea transport and the land111 have been of supreme importance in the development of New Zealand, particularly in view of the country's remoteness from the main concentration of population and markets in the world, the overwhelming
ence on international trade and the necessity of sea transport vvithin and between the North and the South Islands.
In spite of their importance to the national econorny seaports, in marked contrast to agricultural, pastoral, urban and manufacturing activities, have been neglected by geographers and workers in related fields. An
economist yet to attempt a comprehensive survey of the role of seaports in the national economy. Although there have been over thirty sizeable ports operating in New Zealand at various times, historians have provided only seven
2
published studies on five individual ports. Government departments, official organisations and private individuals also have been reluctant to undertake work in this field. Nor has the contribution of geographers been markedly
1
:Morgan, F.
vv·.
~arr,
John Thompson, R.S. Bmvman, H. 0.il~cLintock, A.H. : Allan, Ruth Hassall, C.E. Carey,
Ports and Harbours, 2nd ed, London, 1958, p.13. The Ports of Auckland, Auckland, 1926.
Port of Otago, 2nd ed, Dunedin, 1945.
Port Chalmers- Gatevmy to_Q_tago, Wellington, 1951. The Port of Otago, Wellington, 1951.
The History of Port Nelson, Y!ellington, 1954. A Short His tory of t..1-:te Port of Timaru 1 852 .. 1 955, Timaru, 1951 •
superior. There has been no work published geographers on New Zealand seaports. Studies in _ geography have hitherto given little consider-ation to seaports, but rather have concentrated on the changing patterns of land use, settlement and population at significant periods in the country's development. The most fruitful source of background material has been provided unpublishe~ lli~iversity theses on individual ports, aspects of a group of ports and the functions of coastal shipping.3 Most of the theses give an adequate description of the present status of ports, but do not go deeply enough into relationships underlying their past and present character. Thus, i t is not s:rrprising that there is little published information on New Zealand seaports.
The paucity of research and accessible literature on port geography in New Zealand has had important repercussions. For instance, vii thout
reliable information on the past development and functions of New Zealand ports i t is difficult to forecast the future role of seaports. A pressing problem is how many ports should be maintained for the coastal trade in the light of road, rail, air and rail-ferry developments. Slinilarly, i t is virtually
impossible to make a reasoned assessment of H. l~yer's provocative suggestion for the nation-vvide co-ordination of port planning, voJhich would involve "the allocation of traf'fic among those ports best equipped to handle it, vvi th the elimination of those vmich are least efficient and offering least potential :for improvement.114 Bold planning along these lines requires a deeper
appreciation of- how ports have evolved in response to past and present stimuli.
3
Gracey, Lilian 1::1.: 'The Export Hinterlands of the Ports of. the North Island' (unpublished M.A. thesis, University of J:~ew Zealand, 1951 ).
Nicholas, lvi.O. : 'The Significance of Coastal Shipping in the Economic Development of Northern New Zeala..nd' (unpublished lvi.A. thesis, University of New Zealand, 1953).
_ Sha\il"e, A.G. : 'New Zealand's Coastal Trade' (unpublished lVL.Sc. thesis, University of New Zealand, 1959).
IVard, A.G. : 'The Seaports of the South Island of New Zealand' (unpublished lv!_.A. thesis, University of Nevv Zealand, 1954).
Farrant, A.E. : 'The Ports of Otago and Bluff : Geographic Com-parison and Contrast' (unpublished Ivi.A. thesis, University of New Zealand, 1
'Nheeler, R.H. : 1 The Port of Timaru' (unpublished Ivi.A. thesis,
University of New Zealand, 1957).
-McFarlane, ~Viarion : 1 The Port of Bluff' (unpublished M.A. thesis,
University of Otago, 1962).
Buckland, J.F. : 'The Port of Tauranga and its Hinterland', (unpublish-ed JI!.A. thesis, University of Auckland, 1963).
4n/Iayer, H.Iv1. : 1Some Urban Problems in New Zealand', New Zealand
In an attempt to identify and understand the !11air: the development of
their relative status ment of the counb:--.;r.
Zealand seaports, it is proposed to exa~dne changes in
t-vYO in the economic
develop-As the status of a port is a direct reflection pasc; development, a survey of the evolution of New Zealand ports is made in Part I} to put the of the ~No selected periods in perspective. .fl...n idealised-type sequence of development is evolved to provide a standard for comparing the development of New Zealand ports. By applying the idealised-t;y-pe sequence to the distribution of ports at different times it is possible to gauge vv-hich ports have developed faster than others. The explanation of the differing rates of grovvth reveals the main factors that have affected the development of ports. I thus fonns the background to the detailed analysis of t!1e
tvm in Part II of the study. Part II b with a search for an acceptable measurement of the respective status of a port. In the hope of revealing the best measurement,a statistical experiment was set up to examine the available criteria. On the evidence of the experiment, the study proceeds to an of the reasons behincl the changes in the rankings of NevY Ze:::,land seaports, in an errleavour 'to deterrnine the critical factors producing the
changes in status. The two periods are defined as
follows:-(i)
1926- 1936.Ir: this period the seaports are examined during the disruption the New Zealand economy by the depression.
(ii) i950 - 1961.
The status of ports is considered during a period of development.
economic
In each of the studies the respective of coastal and transhipment trade are treated separa-tly.
in the overseas, The overseas function is concerned with the transport of passengers, goods and rr.ails at least 1 , 200 miles, whereas the coastal function is one of the alternative methods of
transport for moving goods long and short hauls within and betvveen the North and South Isl&~ds.
of goods between
However, the transhipment function involves the movement; within the confines of New Zealand ports. The over·set:.ts trade has always been of great importance in the economic development of NeYI Zealand as the country is virtually dependent on the sea ~s an avenue of
has continually been recast in the light of developments in transport, notably rail, road and air, to perfo1cm the necessary internal communications. The importance of the transhipment trade, however, hns varied with the changes in the part played by ports in the coastal and overseas trade. From the contrast-ing studies of the functions of ports in the overseas, coastal and transhipment trade and the ~vo different periods of economic development, an attempt will be made to gauge the relative importance of the various factors involved in the development of ports, and to provide an insight into the character of the present problems affecting New Zealand ports. Finally, in Part II, there is a
dis-cussion of the relevance of the study to the development of techniques by which ports may be compared and classified.
As the future seems certain to bring forth drastic changes in the exist-ing pattern of New Zealand ports, an attempt is made, vvi th the aid of the
CH.APTER I
PAT'I'Elli\fS SL\fCE 1840
The first part of this study is concerned vd_ th the origin, development and changes in J~e status of New Zealand seaports since 1840. In theory, all possible sites for ports had an equal prospect of developed. Thus_, the selection of and emphasis on particular ports at di:f.ferent phases in the economic growth of New Zealand controlled their respective status. A of the
relevant factors involved in the changes and ranking of 1\ew Zealand ports, therefore, provides the basis for considering the dominant themes of the last fifty years.
A
factor in the changing status of New Zealand seaports has been the improvement of internal accessibility thl~ugh the expansion of the transport netvvork. From the beginning of organized settlement, the expansion appeared to be 11at once a continuous process of spatial diff'Usion.@CJ,an irregular or sporadicprocess 111 conditioned by many specific physical and human factors. Both pro-cesses have been at work in the development of New Zealand seaports. As there also seem to be broad regularities underlying the process of spatial diffusion in New Zeala.."ld, parallel to those recognised by Taafe, lvlorrill and Gould2 in the transport expansion of underdeveloped countries, it is possible to evolve a sbnilar idealised-type sequence of transport development. The idealised-type sequence evolved in this study, however, :focuses attention on the development of seaports, rather than on ~~e expansion of the transport netvvork as such. Greater emphasis, therefore, is placed on the changes in the organisation of ITaritime space, wnich is as essential to a port as the development of its
landward connections. Incorporating both the changes in the maritime and land-ward transportation networks, the idealised-type sequence serves as a yardstick for comparing changes in the evolution of New Zealand seaports.
1
Taafe, Underdeveloped
p.503.
2Ib.,
~'
E.J., Morrill, R.L. and Gould, P.R. : 'Transport Expansion in
Countries :
A
Comparative Aru::1.lysis', Geogr. Rev. Vol.53. 1963,
Trill SEQUENCE OF PORT DEVELOPMJ:iJNT
Three phases are recognised in the idealised-type sequence of the
development of seaports (Fig. 2). The first phase (A) consists of a dispersed pattern of seaports sea ttered along the c oas t lDnited hinterlands. There is little interconnection between the ports, except for irregular visi-ts
of trading vessels and an indigenous mosquito fleet. Yet, with the emergence of the main lines of penetration into the interior (B), the hinterland costs are reduced for certain ports, enabling them to develop as marketing centres. The impetus derived from an expanded hinterland initiated the concentration of shipping at particular ports, as illustrated at P , P, and P •
a o c Port
concen-tration is accentuated, as P ,
a and develop as the foci for the feeder routes. As the feeder routes rise to hinterland capture, the larger ports expand their influence at the exper~e of smaller ports,which either close or survive in an attenuated form. The feeders continue to develop until the interior and major ports are linked together in a transportation ne~rork. As Pb is linked to both P and P , its development slackens, as it is subject to
a c
competition from the other two ports(C). It is, therefore, reduced to a secondary role, vdth less shipping and trade than and P •
c In this phase it is possible to recognise the major ports P and
a the secondary port Pb and the surviving minor ports.
It is probably more realistic to think of the entire sequence as a process, rather than as a series of distinct phases. Thus, at a given point in time, the pattern of New Zealand seaports may reveal the co-existence of all three phases. It is convenient, however, to consider the sequence in phases.
T'"rlE FIRST PI-I.ASE : SCATTERED PORTS
In New Zealand it is possible
to
identify an early period of numerous scattered ports and coastal settlements w~th trading functions. When statistics were first published as a whole in 185.3, there was already adispersed pattern of ports. With 11 overseas ports of entry scattered through-out the country to serve a European population of .30,000, development was clearly
. .3
centre (Fig.).A.).
3The use of the value of cargo
to
indicate variations in the status ofYet, it v~s not a haphazard development. It reflected the of organised grai'ted onto the surviving re:rrmants at Russell, lviangonui and
of the preceding of destructive exploi tatior. of the natural resources of the land and the sea. Motivated the desire to establish agriculture as t..he :firm basis of settlement, the colonising bodies
(the New Zealand Company ar...d the Imperial founded their colonies at ( 1
840)
with an offshoot at Wanganui (1 842),
Auckland ( 1840),
Nelson(1842),
New Plymouth(1842),
Otago(1848)
and Canterbury(1850)
on, or adjacent to, fertile lowlands. Penetration lines from the settlements to the were weakly but networks of tracks connected with restricted hinterlands. as the lowlands were cut of£' from each other by mountains, dense a multiplicity of rivers and occasionally hostile natives,. the need for interconnection by sea was paramount.exception of New Plymouth,
4
the settlements were chosen with access to safe and cormnodious harbours.5
to shelter the frail vessels6
-
none of whichexceeded
800
gross tons. As the services provided by the brigantines, top sail schooners, cutters and scov~ were irregular and infrequent, each portthe
developed in some degree of Indeed, the geographical position of could be represented by Edinburgh, Hull, , Brest and
~~th the natural difference that there were no roads between any nvo of the ports
this
~ ., d ' . l
7
vv.uee.t.e ven1c es. The development of parochialism fostered during of isolation has been a persistent feature of the subsequent
to develop New Zealand ports.
Carrington, F .A. : A Syno12iical Account of the IvJ.aking of a Harl;:gur Nevv Plymouth, 1868. Carrington made the shrewd observAtion good land but vvithout a harbour had more chance of success harbour with little fertile land.
5
commodious was the adjective frequently used to describe the harbours serving the organised settlements. See 'Copy of from Governor Hobson to the Private Secretary of State for the Colony, No.4"1/39,
from Great :Britair. Parliamentary Papers relating to New Zealar.d, No.65, 1841
and His Hon. the Superintendent's Oper~ng Address, Acts and Proceedings of the Wellington Provincial Council, session1853-4.
6
Richards, G.Ha and F.J.: The New Zealand Pilot, London,
1856,
pp.1-1
O. Much emphasis was on harbours of refuge for small ships to ride out a storm.The full expression of the scattered distribution of ports did not eventuate until the spread of economic activity extended beyond the confining boundaries of the planned settlements. It occurred with such bewildering rapidity that by 1867 almost the whole range of possible sites for ports had been explored ro.d exai11ined8 (Fig.3B). Shipping intelligence columns in
contemporary newspapers revealed that 11 2 ports vrere in operation, of which 26 were overseas ports of entry. There Yvere so many ports that a circle, or part
of a circle, described around each one would give an average undisputed hinter· .. land of only 25 miles.
The profusion of ports was the direct result of two agents. First, there was the spread of extensive pastoralism - based on merino sheep - onto the natural tussock grasslands of the South Island and the fern clad areas of the VVairarapa and Hawke' s Bay. Secondly, there were the major discoveries of gold in Otago (1861 ), viestland (1865) and Thames (1867). The impact of the new developments did not affect all parts of the country as war with the Ivlaoris inhibited economic progress in the North Island. But elsewhere, vath the movement of activity avvay from the established centres, in search of gold and fresh pastures, effective co~~unication by land became difficult and tenuous as the frontiersmen were soon separated from the original nuclei by physical obstacles. Dense bush, rugged, dissected mountains and ffivift flowing streams proved formidable obstacles to land transport. Only on the smooth Canterbury and Otago plains did conditions favour commQ~ications. Even here there were hazards to transport, as mile-wide, braided rivers, such ~s thu Rangitata, Waimakariri and Wait~~i, took their toll of early travellers who tried to cross
them in time of flood
9
(Plate I). At such an early stage in the economic development of New Zealand it is not surprising that railways were poorly developed. The total length all in the South Island - Ill/aS only 46 miles, in two separate sections, with two different gauges. Roads did little to remedy the situation, as the mountainous terrain, abundant rainfall and the8
of 70 ports 'liThose lliilits were defined under the Marine Act 1867
59 were included in the first schedule. See 'Ports Scheduled under the Marine Act, 186G' New Zealand Gazette, 1868, p.549.
lack of sui table road.roaking :materials made roadbuilding dif'ficult. Consequently, ''madefl roads radiated only 15-20 miles from the main settlements. Elsewhere,
rough traCkR through the bush, across unenclosed grassland, or along the b
had to suffice. transfer of heavy and bulky goods, such as wool or timber, on >vagons driven by horse or bullock, was slow, tedious and costly (Plate
"Generally we Iright say that the tractive power which drew two tons at home would not draw more than one ton in New Zealand."10 Even the coaches that ran along the nroads11 had to be more resilient than their English counterparts,
to enable them "to bend and twist about, ford rivers and go over the roughest 11
ground". If the driver carne upon a bridge broken by flood, "vd. thout hesitation he took the coach a cross a bit of a stream and then along broken ground rough vrith furze bushes, tussock, grass and the like, a.r1d vfithout any road till he
12 got back to the track11
•
As it is difficult to establish and finance effective land comnUPications under these conditions, it is not surprising, in a newly settled countr'J like New Zealand, that 11 the saltvvater highvvay11 vras most convenient and economic
means of lirJdng the scattered settlements in both islands. Almost every settlement established its own port to effect the reciprocal transfer of between the sea and the So dependent was the economic life of the
on sea transport, that the only concentration of population away from tidewater was on the alluvial goldfields of Central Otago.
Unfortunately, good harbours and pastoral, agricultural and goldbearing land did not coincide in New Zealand. Excellent harbours, such as those in Fiordland and the IVIarlborough Sounds, had to be ignored, and ports established at sheltered places which did not provide the basic requirements of all year round accessibility, sufficient depth ru1d adequate protection. At least
1 0
The New Zealand Handbook or Guide to Britain of the South, 9th ed, London,
1864,
p.1 02.11
Lyttelton, Lord : Two Lectures on a Visit to a Canterbury Colony, Lecture II : The Colony, London, 1868, p.26.
12Th· d 26
53 negotiating Kew Zealand ports were or wrecked in 1 867.1 3 On the Hokitika bar alone as many as 32 ships foundered between
1865-67~
4 The problem became so great a·(; the port that the l'West Coast Times11 published aseparate column for Yvrecks and strandings III).
At
this in the economic development of New Zealand, ports vdth dangerous bars, which were accessible only to ships very small tonnage, were of' 11 no trifling importance when the delay and difficulty attendant upon the transport by land in a new country were consid.ered11 1 5 (Plate TV). Most of the early ports have long since::destroyed the growth of the :aain , or else they linger on as relict ports, vdth visits of an occasional coastal vessel to remind tl1em of their
THE SECOND PHASE : PEI'·iETRATION LTh"'ES AND PORT CONOE:i\l"'TRII.TION
In theory, all had an equal chance of developing. But it vvas apparent in 1867 that, d.espi te the dispersed pattern of ports, there was a concentration of activity on a limited number of them 3B). Dunedin, Lyttelton, 'iVellington, Auckland, Nelson, Hoki tika and Greymouth, at
the termini of the earliest penetration routes built to reach areas of mineral exploitation, to develop agricultural areas3 and to establish milita~J
control in the North Island, had thrived at the expense of their "'"'""·'-!",~··~
They had developed at the foci of maritime by providing direct United Kingdom, trans-Tasw~n, inter-provincial and provincial services. As the seven ports collectively enjoyed a virtual monopoly of imports, they served as transhipment centres for the remaining ports. The importance of transhipment functions, coupled with their emergence as the main administrative and
manu-centres, confirmed their dominance.
The incipient concentration of activity on a limited number of ports,
'-'V"'-"'-.J..""Ciu. in 1867, vvas confirmed in 1881 by the impetus derived from the
of railway penetration lines. Between 1 867-1 881 the length of increased from
46
to 1287 miles. It was not in a connected ne~work1
3Ingram, O.W.N. and ViJheatley, P.O. New .Zealand Shipwrecks
1725-1960~
3rd Wellington, 1961, p.400.1
4nid.' p.400. 15----,..
but in 'b.velve s sections (Fig. Indeed, most ports developed their own railway connections vdth their hinterlands long before through lines were contemplated, much less completed. The general layout, therefore, was of short lines from a port to an inland settlement. 16 Although primarily intended as a means of opening up the country to settlement,
construction in effect, given the port with a railvray an advantage over its neighbours vvithout a railway, for road transport beyond the main towns and shingle roads of the Canterbury plains was still slow, hazardous and prinutive,
's public works programme.17 despite improvements iru>tituted as of
The e:x--pansion of the land transport net-vmrk reacted on the organisation of marl time space also, as stc[~.mm~ se;;r""vicc;s -rrere established to serve the termini of the penetration lines. With the concentratioL of activity on the ternnni, the ports endeavoured to facilitate the loading and discharge of cargo by providing wharves, warehouse facilities and adequate depths.
The development of the penetration lines generated a series of spatial readjustments, as the comparative locational advantages of ports shifted. Port concentration was marked. By 1 881 Dunedin, Lyttel ton~ Auckland and Wellington, collectively, monopolised the imports and exports, handling 80 per cent of the total trade In contrast, many of the smaller ports lost their function in the external trade, because of the concentration.
Tr~
THIRD PF-ASE.
mTERCONI\lECTION AND PORT PIRACYPenetration was followed by lateral interconnection as feeder lines moved out from the ports on t.."le landward side. The process of/ concent.ration was accentuated by the feeder net-work of certain ports reaching out and
the linterlanc,s of their neighbours. As feeder netv;rorks became stronger, some of them connected the original penetration lines, enabling the larger port to expand its hinterland eve.n further.
In 1881, the process pernutted the greater concentration of trade on Dunedin and Lyttelton. The economic suprerr~cy of these tvro areas derived from
16
In the narrow Auckland peninsula the first railways
(Auckland-Onehun::::~~.
1873, Auckland-1\ilercer 1875, Ri verhead-Helensville 1875) were portage railways,connecting ports on the east and west coasts.
1
the continued development of the wool "monoculture" and the subsequent
development of the bonanza wheat farms on the Ca..'1.terbury and North O~t_(:l,g()_~o
plains, resulting in their hinterlands obtaiv.ing a larger share of the new transport developments than the rest of the country. Indeed, the idealised cycle of port development was completed on the east coast of the South Island by 1881 , as all ports from Waipara to Bluff vrere connected by the 425 rr>.ile South Island l\Jlain Trwik railway (Fig.3C). Some rationalisation of ports followed from the lateral interconnection, as many of the ports on the east coast of the South Island vrere closed or reduced in status by 1881, because they had been deprived of a large proportion of their trade.
Although the lateral interconnection of ports was achieved on the east coast of the South Island betvveen 1867-1881, the short lived phase of the development of penetration lines from Timaru and Oamaru was sufficient for these ports to develop resistance to competition from Dunedin and Lytteltono They continued to develop their artificial ports despite the strong competition brought by the railway (Plate V). This competi tio:r~ w-::1.s intensified by the railway rates, which were designed to concentrate cargoes on larger ports at
18
the expense of the smaller ports. It was claimed at the time that the pt:nal rate system operated by the railvvays was an important factor contributing
" 19
towards the bankruptcy of the Oamaru Harbour Board. Yet, in spite of the difficulties, both Oamaru ard Timaru survived, as vested interests were deter-mined to retain them as outlets for their respective districts. "But, argue
some people, New Zealand does not require these secondary ports. In the cases of Timaru and Oaxnaru, Lyttel ton lies to the north and Port Chalmers to the
20 south, each connected by railways made at great expense to the colony. 11
The mere successful construction of an artificial harbour ~~s not considered a necessary or justifiable reason for retaining a port, once the town was
t d t "1 21
connec e o a Tal way. However, the full development of the ideal sequence
in the South Island, vmich would have eli1ninated Oamaru and Timarc1, if it had continued to its logical conclusion, was thwarted by fierce local patriotism and heavy capital investment in harbour works.
1
~The
Chairxnan's Report', Annual Report of the Timaru Harbour Board, Timaru, 1890.
19
The Oamaru Harbour Board was in the hands of the receiver from 1893-1911 •
20
Bradshaw, John : New Zealand of TodaJ[, London, 1888, p.339. 21
The persistence of the secondary ports, such as Oamaru and Timaru, vvas apparent when the development of feeder routes and interconnections expanded in areas outside the favoured east coast of the South Island where, hitherto, the expansion of· the transport netvrork had been retarded by the highly dissected topography (Plate VI), extensive forests and recurring native troubles.
Stimulated by the opportunity of exporting f'rozen meat, butter and cheese to the United Kingdom, after the first successful export of refrigerated produee in 1882, communications expanded rapidly in the North Island, for the combined efforts of the savvmiller and fanner transformed the bush into exotic pastures. As the prime means of opening up areas to settlement, the railway system expanded to 2,789 miles in
191~~
2 involving the linking of many separated lines, including the North Island lVla.in Trunk line between Wellington and Auckland (1908). 'A'hen the link up affected ports which had developed in some degree of isolation, fierce competition often resulted and smaller ports were deprived of a large proportion of their trade. Certain ports, such as Napier, New Plyn1outh, Wanganui and Waitara, survived the link up, even though the accompanying development of shipping outstripped their capacities. Vessels had to be lightered in the roadstead as they were too large to enter ·the confines of the port23 (Plate VII). Yet, the ports survived because they specialised in exporting refrigerated produce, which was expensive to move long distances on account of its perishable nature and high bulk in relation to value. In con-trast, where the relatively i.l.igh value, low bulk and non-perishable imports were concerned, the expansion of the transport network pen<1itted '~Vellington,Auckland, Dunedin and Lyttelton to develop at the expense of other ports liru:ed to the railvray system. In 191 1 , their aggregate share of the imports increased to 88 per cent, as their main railvvay connection and subsidiary coach routes enabled them to serve a wide area more effectively.
In addition, a further series of spatial processes was set in motion within the main group of ports. The positions held by Dunedin and Lyttelton,
22
only eight per cent of the European population were more than ten miles away from the railway line. The Pcailvvays Report', A.J.H.R. D.2, 1911.
23
in "1 881 , were usurped by Welling ton and Auckland by "1 911 (Fig. 3D) • These changes resulted from the acceleration of economic development in the l'Torth Island, which enabled the North Isl~d to outstrip the South Island in popu-lation and volume of trade. With the parallel expar~ion of the transport networks in the North Island, Wellington and Auckland obtained the greatest share of the trade generated by the new activities. Indeed, Wellington emerged as the leading port of New Zealand in "191 "1. The port received more ships than any other centre to load frozen meat, butter and wool, as almost all the produce from the well-developed fanning areas of the Y\Tairarapa and the Manawatu were exported through Wellington. However, Wellington's main strength was derived from her unique position in connecting the t:-->.nsport
net-k f b th . 1 d d th . h. . l" 2
4
wor o o lSJ.an s an e rnaln overseas s. lpplng lnes. It was admir-ably situated to serve the almost balanced population of the ~vo islands. Wellington, therefore, superseded Dunedin as the Dominion's main distribution
centre. Many firms, with headquarters in Dunedin, moved to Wellington to obtain the benefits of the capital's central position. It was claimed that Dunedin contributed to its ovm dow~all, as high import charges and fewer
direct shipments from the United Kingdom precipitated the departure of a large nwriber of firms to the North Island. 25 Dunedin 1 s decline appeared virtually
inevitable with the movement of business and population to the North Island. The full concentration of trade and shipping on a limited number of ports, as envisaged in the idealised-type sequence, was not yet fully realised in 1911. There were still ports serving areas such as Northland, the East Coast (Plate VIII) and the Bay of Plenty in the North Island, and the West Coast, wmrlborough, Nelson and the Lake District in the South Island, which had not reached the third phase in the ideal sequence of transport development. Even at the beginning of the detailed survey of New Zealand seaports in 1926,
the ports serving these areas - with the exception of Hokitika and Greymouth, which were linked to the South Island Main Trunk railway in 1 923 - continued
2
4-rn 1 9'1 'l vVellington was the first port of call for the United Kingdom mails (via Suez), the main passenger terminal and the main port in the trans-Tasman trade linking t.l-J.e Sydney via Auckland a.'ld the Melbourne via Bluff routes.
25
McLintoc~
to thrive in the absence of effective competition from other ports. Indeed, the ports retained their independence until either the further extension of the railways (Plate IX) or the development of road transport (Plates X and XI) successfully integrated them into the main transport netYrork.
.liN .ili\f.ALYSIS OF TBE CB!u\fGI.i\fG STATUS
In the search for the critical factors associated vvith the distribution and relative importance of
with the interpretation of
Qn~~·~~, the second of the study is concerLed
in the: status of
two periods in the development of the New Zealand economy.
during
An
of the trends and directions of in the status of New Zealand is important in the basis for a reasoned assessment of their present and future potentialities. Without a full grasp of pastthere is a danger of structural patterns.
transient conjectures of circumstance vvith basic
A reasoned assessment of New Zealand ports is conditioned by the
location.
of data that will properly describe their character, importance and It is not possible to delve O.eeply into the factors associated Viith cha..11ges in the stab.s of New Zealand ports until the lication of new and refined statistics after
1922.
The publication of these statistics does, however, pose a problem as to what is the best measurement of a port1s status,In the part of the study, the value of comi1lerce was used as the criterion, as figures for this were the most available. The
part of the study ai."'DS at a was given in the first part.
interpretation of the changes in status than a fuller consideration of the available criteria is necessary. A statistical experiment is, therefore, set up to investigate which of the available criteria ~~l provide the best measurement of a port1s status (Chapter II). On the basis of the evidence of the
an analytical framewoit is established (Chapter III), and the study proceeds to detailed of the two selected periods,
1926-36
(Chapter IV) and1950-61
(Chapter
V) •
The seaports are examined at the beginning and end of each period to discover changes in their status. The critical factors associated
CF...APTER II
n\f SEARCH OF A :MEASUREMENT
Geographers interested in the relative stature of seaports have
speculated for years about the best measurement for comparing and classifying ports. Although many detailed studies have been made of individual ports, there seems
to
be no acceptable scale against which the activities or relative stature of any given port can be measured. Yet,there is implicit in the literature the assumption that some of the measurements are to be preferred to others.Morgan, for example, has contended that the net registered tonnage of shipping1 using a port "is the most cor4J?rehensive figure for evaluating ports as places concerned vvith the arrival and departure of ships.112 The advantage of net registered tonrage is that it applies to all ports, except naval base?, and includes all ships that come to a port. It embraces all classes of traffic - 11the passenger liner with little cargo and a high net tonnage figure, the cargo liner, the passenger-cargo liner, the tramp vath a great weight of cargo for its net tonnage figure, the cargo liner, the tanker, the collier and the packet or ferry steamer." 3 But the use of net registered tonnage over a lengthy period of tirne has been criticised. Marine architects have tried to keep the figure as low as possible, for wharf dues are charged in proportion to
net tonnage. In other words, they try to reduce the net registered tonnage relative to the
ca~jing
capacity of the ship.4
Consequently the growth of net1
Net registered tonnage (n.r.t.) is gross registered tonnage (the measurement of the enclosed volume of a vessel, 100 cubic feet being taken as one ton) less an allo~ance for machinery and crew space.
2
Morgan, p.17. 3
Ibid., p.17.
tonnage falls short of the actual growth in the capacity of shipping. 5
The shortcomings of net registerea tonnage has led to Alexanaersson an~
- •• 6
Norstrom, and Ullman8 to select the weight of cargo, given in measu:r:c:-ment tons,
9
as the most satisfactory single measure of the size of aport~
There are dravroacks in the use of measurement tonnage, as it favours ports handling bulk cargoes o Under this system seaports specialising in handlingcoal and oil cargoes rank among the leading ports in the world. Hampton Roads, for example, would sucyass New York as the premier importing centre of the
United States, on account of its large oil intake.10 lv.fany ports are not very significant on account of the weight of cargo handled, although they are visi~ed
by a large net registered tonnage of shipping. If the weight of cargo were used as the sole criterion, the importance of these ports would be unaervalued,
The alternative measurements - the number of , the value of cargo and indices relating to the physical capacity of the port - have all been
. t d 11
reJec e • As vary in size, it is claimed that their numbers do not proviae a good inaicaiion of a port's status~ It would be possible for one ship to carry more cargo than four others. The fluctuating 1vorth of the pound sterling has led to a repudiation of value. Also eliminated vrere inaices
relating to the size of individual ports, such as the number of berths of 600:tt" ivith 38fto alongside at Wellington, and the number at 550ft. vdth 32ft. along~
side at Timaru, Yvriters claim that there is a danger in drawing conclusions from such indices~ Within the port of Otago, for example, Port Chalmers can accommodate larger ships than Dunedin, but the latter receives and dispatches
5Net registered tonnage statistics in New Zealand are inflated by th8 ferries in shuttle traffic between the North and South Islands.
6
Alexandersson, Gunnar a.l'ld NorstrBm, Goran : World Shipping, An Economic Geography of Ports and the Seaborne Trade, New York, 1963, p.118.
7weigend, G.C. : 1Some Elements in the Study of Port Geography', Geogr. Revo Vol,
47.
1958, pp.192-3.8
Ullman, E.L. : 'Transportation Geography1
, in James P.E. and Jones
C.F. :American Geography Inventory and Prospect~ Syracuse, 1954, p.319, 9
A
measurement ton was originally the space occupied by a ton of wine which was 50 cubic feet.. It is now 40 cubic feet, approximately equal to four quarters or a short ton of wine.1 0
oarter, RoE .. : 'A Comparative Analysis of United States Ports and their Traffic Characteristics' • . ~ Geogr. Vol. 38. 1962, p.171.
11
see Morgan, pp.16-17.
1 2 more shipping and cargo.
Behind the acceptance and rejection of all measurerrents is the asswnption that a single criterion is sufficient basis for assessing the status of a
par·~.-However, a measurement of status, based on a single criterion, is subject to any abnormalities it might exhibi to It may not, therefore, provide a good measurement of ports vath divergent functions. There have been attempts to overcome the problem by conibining two or more measurements. Bird, for example: used two different measurements - net registered tonnage and value. 13 Carter proposed a multi-criteria system for describing and differentiating between United States ports.1
4
Six different measurements were used to construct aseries of maps depicting important traffic characteristics of ports. From an analysis of the maps, Carter concluded that the multi-criteria system was more comprehensive and more widely applicable than a single criterion for gauging the status of a port. If Carter's premise is accepted, the next step is to com-bine his criteria as ratios or formulae.
Before progress can be made along these linesj three questio1w require investigation9
(i) Hovr much difference is there between the various criteria for measuring the status of ports? Can the superiority of one criterion be established statistically?
(ii) If there is such a measurement, would it also be valid for overseas and coastal trade?
(iii) Would such a measurement be applicable to several different years, or is it useful for only one specific year?
PROC'EDURE
To see if the superiority of one criterion for measuring ports can be established statistically, an investigation was undertaken of the gross~ over seas and coastal trade of New Zealand seaports for four different years- 1926,
12
The respective controlling depths at Port Chalmers and Dunedin are 30ft. and 23ft. But in 1961
84
per cent of the cargo was handled at Dunedin and only 16 per cent at Port Chalmers.13 Bird, James : The Major Seaports of the United Kingdom, London, 1963, pp.21-2.
14
1 936, 1 950 and 1 961 • 1 5 The basic problem was to seek the coefficients of correlation between the several possible measurements for the gross, overseas
16 and coastal trade of New Zealand ports.
The first task -rms to select the criteria for individual ports from s. variety of sources for the years in question. The New Zealand Port Information Nhnual17 provides details of the respective length of berthage, the limiting depths at the harbour entrance, in the fainvay and alongside the berths, the various types of mechanical equipment available and the maximum draught of
shipping permitted at individual ports. As there were still roadstead ports in operation, which had no berthage or m~chanical equipment for all the years being analysed, it was decided to choose the maximum draught of shipping as the
representative measure of a port's physical status. Four further measurements of a port's status are given in the Report on the Transport Statistics of New
18
Zealand. First, there is the weight of cargo given in "measurement tonsn loaded and discharged in the overseas, coastal and transhipment trade of New Zealand seaports. Secondly, there is the number of commodities landed and shipped in the overseas coastal and transhipment trade of the majority of ports" Thirdly, there is the number of overseas and coastal ships visiting a port each year. Fourthly, there is the net registered tonruge of overseas and coastal shipping visiting each port given in t'IYO tables. There is one that enw~erates, for the overseas trade, the ports at which they have first "entered" to discharge cargo, and where they 11cleared11 their last port of call. The other distin-quishes, by ports, the nurrber of calls made by shipping engaged in either the
15
For the purpose of the experiment transhipments were included in the overseas and the coastal trade.
16
similar studies have been made on the relative merits of different measurements of manufacturing. See Alexander, J.W. : 'Location of Manufactur-ing : Methods of Measurement', A.A.A.G. Vol.
48.
1958, pp.20-26, and Alexander, J.vV. and Lindbergh, J.B.: 'Measurements of ]I;Ianufacturing: Coefficients of Correlation, Journal of Regional Scienc~, Vol. 7. 1961, pp.71-81.17
N
.z_.
Marine Department, New Zealand Port Information Mamlal,mi
I Text, Part II Plans, Wellington, 1957
18
N
.z •
Department of statisticsi
Report, on the Transport statisticsof New Zealand, Wellington, (published annually since
1949)4
Prior to1949
cal'gO statistics were given in N .z ~ Department of Statistics : Nevt Zealand