ISSN Online: 2161-7589 ISSN Print: 2161-7570
DOI: 10.4236/ojg.2019.911088 Sep. 30, 2019 752 Open Journal of Geology
Geotechnical and Hydrological Characterization
of Subsurface for Metallic Minerals Mining
Operations in Punjab, Pakistan
Mian Sohail Akram
*, Kamran Mirza, Usman Ali, Muhammad Zeeshan
Institute of Geology, University of the Punjab, Lahore, Pakistan
Abstract
The study area is covered by alluvium having average thickness of about 200 m that is underlain by the Precambrian basement rock units including iron ore to be mined in future. In this regards, necessary campaign of subsurface investigations including both geotechnical and hydrogeological has been car-ried. In geotechnical investigations, disturbed and undisturbed samples were collected from five (5) boreholes and hydrological investigations by using water pump out test were conducted to determine the characteristics of aqui-fer. Rock samples were also collected from already drilled boreholes for iron ore estimation from a depth of more than 200 m. The laboratory testing has classified alluvium as silty sand/sandy silt (SP-SM/SM) and clayey silt/non-plastic silt (CL-ML/ML) as per soil classification criteria having angel of friction of 31.4 - 38.5 degree with bulk density of 1.461 - 1.853 g/cc. The initial void ratio (eo) varies from 0.412 to 0.952 with no swell potential in
consolidation tests. The chemical analyses of the soil have indicated values of 0.003% - 0.006%, 0.0012% - 0.0057%, 0.013% - 0.030% sulphate, chloride and organic matter contents respectively with pH-value of 6.92 - 7.56. The strength of the underlying rock was found to be medium strong to very strong corres-ponding to values of 25 - 140 MPa in uniaxial compression and indirect ten-sile strength of 15.66 MPa. Hydrological study reveals that aquifer is uncon-fined and generally isotropic in nature. The average transmissivity, hydraulic conductivity and storage coefficient are 6038 m2/day, 4.0 × 101 m/day and
0.016, respectively that presented aquifer is quite permeable. The cone of in-fluence covered area of 65 m from main production well. For the open pit mining operation, stability analysis is performed by assuming a 4V:1H slope in the bedrock while 1V:1H in the overlying sediments cover using Lim-it-Equilibrium (LE) analysis in Slide computer program. However, overbur-den slope was concluded to be unstable with the analyzed slope angle. The How to cite this paper: Akram, M.S.,
Mirza, K., Ali, U. and Zeeshan, M. (2019) Geotechnical and Hydrological Characteri-zation of Subsurface for Metallic Minerals Mining Operations in Punjab, Pakistan. Open Journal of Geology, 9, 752-767. https://doi.org/10.4236/ojg.2019.911088
Received: September 4, 2019 Accepted: September 27, 2019 Published: September 30, 2019
Copyright © 2019 by author(s) and Scientific Research Publishing Inc. This work is licensed under the Creative Commons Attribution International License (CC BY 4.0).
DOI: 10.4236/ojg.2019.911088 753 Open Journal of Geology deformation analysis for mine slopes by finite element method was per-formed using Phase 2 (RS) software. The results show maximum deformation is likely to be in order of as high as 700 mm for individual slope riser whereas in the range of 300 to 400 mm for the overall slope.
Keywords
Subsurface Investigation, Rock and Soil Samples, Laboratory Tests, Slope Analyses
1. Introduction
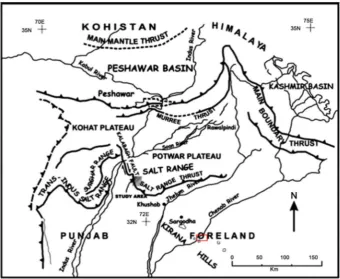
[image:2.595.210.534.383.704.2]The location of the study area is situated in Punjab (Figure 1) approximately 158 km North-West from Lahore and located on the left riverbank of Chenab near Chiniot town that is bounded with rock outcrops of Kirana and Sargodha. This study emphasized on geotechnical and hydrological characterization of subsur-face in view of mining activities for metallic mineral in future. Paige-Green [1] studied distribution parameters of soil particle size. Erguler [2] investigated grain size distribution of soil by using quantitative methods. Giasi et al. [3] stu-died several equations correlating soil’s properties of compressibility to its liquid limit and plasticity index properties. Messad and Moussai [4] tested samples that
DOI: 10.4236/ojg.2019.911088 754 Open Journal of Geology were prepared by using distilled water with different salt concentrations and re-sults displayed the decrease in pore fluid salinity by using procedure of conven-tional water content and increase by using method of fluid content. Ogunsanwo [5] investigated characteristics of shear strength of laterite soils of Nigeria influ-enced by preparation of samples and testing modes. Marsland et al. [6] con-ducted the site investigation for foundation and earthworks of soil.
This study accentuated the geotechnical investigation, the characteristics of subsurface materials, and the details of field and laboratory testing. The hydro-logical study is also planned to determine the characteristics of groundwater aquifers and preliminary slope stability analysis is also analyzed by using Lim-it-Equilibrium (LE) analysis.
2. Methodology of the Study
The detailed methodology to carry out this study is presented in Figure 2.
3. Tectonic Setting and Geology
3.1. Tectonics
[image:3.595.248.504.375.704.2]Punjab province in eastern Pakistan lies on the northwestern margin of the In-dian continental tectonic plate, the slow northward migration of which has resulted
DOI: 10.4236/ojg.2019.911088 755 Open Journal of Geology in the continuing growth of the Himalayas mountain belt. The study area com-prised of alluvial plains that is irrigated by various canals. The study area is lo-cated in the foreland of Himalayas connected by Chenab, Jhelum and Indus Rivers (Figure 3). The study area situated in the plains of Himalaya and sedi-ment cover is underlain by the Precambrian shield rocks. The outcrops of base-ment rocks can easily be observed at Kirana, Rabwah, Chiniot and at Sangla Hills.
3.2. Geology
The field investigation developed the understanding of the study area that is covered by both the loose overburden materials and the rock formations. In Study area, the recent alluvium deposits of unconsolidated and uniform in na-ture are being deposited by the Chenab River. Sediment deposit is consisting of silt, clay, loam, sandy clay, sand and silty clay. There are two stratigraphic units Hachi Formation, Asianwala Formation are exposed around the study area.
3.2.1. Asianwala Formation
Asianwala Formation is well exposed on the western side of Chenab River. The formation consists of quartzites, slates, phyllites and tuffs. Quartz veins, dolerite dykes and sills are intruded at places [8] [9].
3.2.2. Hachi Group
The lithology of Hachi group comprised of phyllites, quartzites, slates and tuffs. The light grey color of volcanic breccias is consisting of fragments of rock and
[image:4.595.198.539.414.693.2]DOI: 10.4236/ojg.2019.911088 756 Open Journal of Geology phenocrysts of feldspar, quartz occur in matrix of fine grain [8] [9].
4. Field and Laboratory Studies
Geotechnical investigations are carried out to define geotechnical conditions of both rock and soil at site for development mining activities in the future. There-fore, five (5) boreholes were drilled up to the depth of 70 m at angle of 90˚ to determine the subsurface properties of strata. The borehole locations are given in Figure 4.
4.1. Subsurface Exploration
Straight rotary method was used to drill five (5) boreholes up to a depth of 70 m below natural surface level. Geological logs were prepared on site and later on verified by the laboratory results and attached. The bed rock starts from about 200 m depth.
4.1.1. Standard Penetration Tests (SPTs)
Several researchers [11] [12] [13] [14] [15] used SPT to determine the relative density of soil. Therefore, SPTs were carried out by following ASTM Designa-tion D-1586-67. The SPT blow count “N” recorded at various depth and plotted on borehole logs. The hammer with weight of 63.5 kg was dropped manually (Vallejo 2007). The loose material from boreholes was removed properly before each SPT and by using split spoon sampler disturbed soil samples were gathered. Total 77 SPTs were carried out at various depths and the data obtained by these tests was used to determine the compactness of sediment cover.
4.1.2. Disturbed and Undisturbed Samples
[image:5.595.140.538.472.705.2]Total 11 undisturbed samples were conducted from boreholes by using pitcher
DOI: 10.4236/ojg.2019.911088 757 Open Journal of Geology samplers according to the instructions of ASTM D 1587 [16]. Later on, these samples were preserved for laboratory testing. Disturbed samples were collected from the boreholes by using split spoon samplers and preserved in polythene bags for further more laboratory testing [17] [18].
4.2. Water Pump out Test
The Pump out test is used to determine the characteristics of groundwater aqui-fers by installing pumping well and observatory wells [17]. Mironenko [19] stu-died the aquifer properties by pump out test. In this study test was conducted to determining the aquifer properties for mining purpose. The production tubewell upto 76 m depth were installed including three (3) observation wells up to depth of 23 m, 30 m, 38 m at several meters distance from the production well.
The test was run for 72 hours with 2 cusec discharge rate, whereas, observa-tion wells were run for specific time intervals to determine the water table depths. The water level drawdown and residual drawdown data were collected to determine the aquifer characteristics (transmissivity, storage coefficient and hy-draulic conductivity). The observation wells OBS-1, OBS-2, OBS-3 are located at a 3 m, 15 m, 30 m from the center of a production well. The production well was drilled by straight rotary drilling method. For tubewell designs following points were taken in consideration:
• Tubewell discharge design capacity with minimum drawdown • Water should be sand free
• Well should be stable for long time
The PVC pipes were used for tubewell and observatory wells. The composite lithological log was prepared during tubewell drilling. The shrouding material was placed around the well to increase the permeability of the zone around the tubewell. The shrouding material was well graded, rounded and without calca-reous material. The turbine pump with a capacity of 3 cusecs was installed for the development of tubewell.
The tubewell and observatory wells were installed after collecting all the in-formation regarding the study area. A pond or certain dimensions were build to avoid flooding due to pumped water. Turbine pump of diesel engine of 2 cusecs capacity was installed at a depth of 21 m. The rate water flow was determined by this expression [17]:
Q Av= Q = water flow rate (m3/s or L/s)
A = area of the channel (m2)
v = Velocity of water flow (m/s)
Thies [20] develop a formula for unsteady state flow that introduces the time factor and storativity. The simplest form of the equation is as under.
( )
4S Q= π ∗T u W
DOI: 10.4236/ojg.2019.911088 758 Open Journal of Geology s = the drawdown in piezometer at a distance “r” from well.
Q = well discharge in m3/day.
T = the transmissivity of the aquifer in m2/day.
w(u) = Well function of u and represents an exponential integral.
2 4
U r S Tt=
r = distance in meter from the center of the pumped well. S = storativity (dimensionless).
t = time since pumping started in days.
Following hydraulic parameters were also measure as discussed below.
4.2.1. Transmissivity (T)
Transmissivity can define the capacity of an aquifer to transmit water and it is a product of the thickness of aquifer (D) and average hydraulic conductivity.
2.30 4
T = Q π∆s
Delta can be deduced from time drawdown log.
4.2.2. Coefficient of Storativity (s)
Storativity or the storage coefficient is the volume of water released from storage per unit decline in hydraulic head in the aquifer, per unit area of the aquifer. It can be calculated by using the time drawdown graph with zero intercepts (to) of
the straight line.
2.25 o 4
S= Tt π∆s
4.3. Laboratory Studies
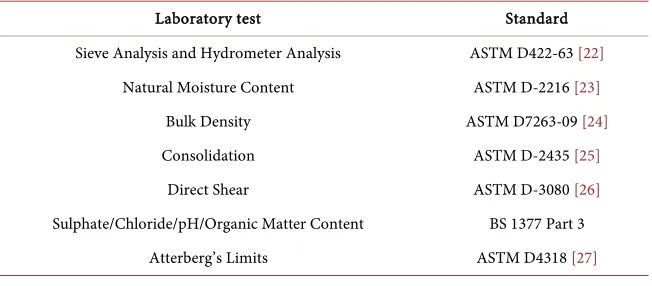
The number of laboratory tests was performed on collected samples from the boreholes. These tests were performed according to the standard of ASTM and BS [17] [18] [21]. The detailed list of followed standards according to the specific test of soil is given in Table 1.
Similarly, several rock tests were performed by following these standards as mentioned below:
[image:7.595.213.539.588.731.2]• Index Properties Tests (Moisture Content, Porosity and Unit Weight) • Unconfined Compressive Strength Test
Table 1. List of laboratory tests for soil according to standards.
Laboratory test Standard
Sieve Analysis and Hydrometer Analysis ASTM D422-63 [22]
Natural Moisture Content ASTM D-2216 [23]
Bulk Density ASTM D7263-09 [24]
Consolidation ASTM D-2435 [25]
Direct Shear ASTM D-3080 [26]
Sulphate/Chloride/pH/Organic Matter Content BS 1377 Part 3
DOI: 10.4236/ojg.2019.911088 759 Open Journal of Geology • Tensile Strength Test (Indirect Method)
• Hoek Direct Shear Test on Saw Cut Samples
5. Results and Discussions
5.1. Pump out Test
The production well and piezometers were installed to determine the ground-water properties. The change in ground-water table was measured through production well and observation wells using the water level indicator with time interval as 0.5, 1, 1.5, 2, 2.5, 3, 3.5, 4, 5, 6, 7, 8, 10, 12, 15, 20, 25, 30, 40, 60, 75, 90, 105 and 120 minutes. After this practice, the water level was checked and record after each 30 minutes for 72 hours. The water level recovery was recorded after the termination of the pump out test in the production well and three observation wells (BH-A, B, C).
The water of all the observation points was recorded before the start of pump out test.
• Production Tubewell: 10.22 m
• BH-A: 10.16 m
• BH-B: 10.175 m
• BH-C: 10.19 m
The water level drawdown data of production tubewell and three (3) observa-tory well pump out test for 4320 minutes and residual drawdown data collected during the recovery for 48 hours. The study reveals that clay layers are not so thick and continuous and thus do not act as barrier or confining beds. From the borehole logs and from the subsurface geology of the area, it is assessed that it is an isotopic unconfined aquifer.
The drawdown and radius of influence (ro) of the pumped well constitute the
nature of cone of depression. The distance drawdown graph is shown in Figure 5. Graph presented that cone of depression expands upto a maximum depth of 65 m of the well and gradually decreases to zero at the distance of 65 m round the well.
[image:8.595.221.528.588.707.2]The hydrological study reveals that the water table depth varies from 10 - 11 m depth. The electrical conductivity of ground water is <1500 μs/cm that shows good quality of water. The thickness of fresh groundwater is extended to an average
DOI: 10.4236/ojg.2019.911088 760 Open Journal of Geology depth of 150 m and recharge of main ground water aquifers are from nearly flowing Chenab river. The aquifer composed of fine to coarse grained sand with alternate minor silt and clay layers. The presence of thin layer of impervious material does not act as a barrier for the flow of ground water. Therefore, it is concluded that aquifer is unconfined and isotropic in nature. The average transmissivity, Hydraulic conductivity and storage coefficient are 6038 m2/day,
4.0 × 101 m/day and 0.016 respectively that presented aquifer is quite permeable.
The cone of influence covered area of 65 m from the main production well.
5.2. Standard Penetration Test (SPT)
The SPT blow counts (N Values) were obtained by all exploratory boreholes. The uncorrected (N) and corrected (N70) were plotted against depth and
pre-sented in Figure 6. The distribution of blow counts with depths was seemed regular. Beyond 30 m depth, the in situ relative density of underneath material feels very dense due to weight of upper covered material. The soil compaction varies between loose to medium dense.
5.3. Hoek-Brown Parameters
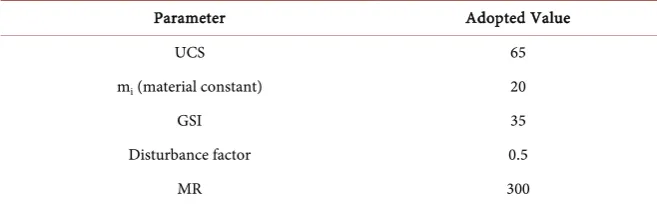
Hoek-Brown strength criterion is a prevailing empirical tool available in the rock engineering industry for the assessment of rock mass parameters. For this min-ing project, the rock mass parameters will be mainly required for the under-ground works. The Hoek-Brown criterion involves the use of uniaxial and tri-axial compressive strength testing usually with a set of five samples tested at in-creasing confining pressure. To date, no triaxial testing has been carried out for which the Hoek-Brown parameters are assumed currently and adopted from the literature review. The Hoek-Brown characterization was performed using the Rocscience software Roclab (Table 2).
5.4. Proposed Design Criteria
[image:9.595.60.540.553.707.2]The mining project would also include several types of structures and geotechnical study is required for the stability of structures foundation as well as excavation
DOI: 10.4236/ojg.2019.911088 761 Open Journal of Geology stability. The foundations of structures should meet the following instructions for minimum foundation criteria.
• The factor of safety 3 is recommended to secure the foundation by shear failure. • The angular distortion between two adjacent foundations should not exceed
1/500 in order to avoid differential settlement.
• The foundation must stay safe under tensile loading, lateral moment, eccen-tricity or inclined loading, and vibrational loadings.
Following soil parameters (Table 3) will support engineers to calculate the al-lowable bearing capacity of various structures and these parameters are based on field and laboratory studies.
5.5. Foundation Design
Square of strip spread foundation is quite favorable to spread a load of light to moderate structures loads to the ground. Mat foundation can be considered for moderate to heavy load structures. The rigidity of foundation should be increased by providing plinth or tie beams where required. Internationally, 1 m depth below the natural surface level is recommended for spread and mat foundations types. The NSL is the top ground of any point for is of investigation. The foundation depth can be increased where required.
The allowable bearing pressure for square and strip foundation is evaluated for 1 - 4 m wide strip foundation and 1 - 4 m wide square foundation against shear failure and settlement of ground. The foundation proportioning curves were made for depth below 1 m NSL by using Teng’s, Bowle’s and Meyerhoff’s equation as shown in Figure 7 and Figure 8.
5.6. Slope Stability Analyses
[image:10.595.208.537.542.645.2]The accumulation of strain due to excessive deformations for mining leads to the failure of large slopes. Therefore, studying the deformation behavior of geoma-terials forms an essential component of designing side slopes of open pit mines.
Table 2. Hoek-Brown parameters summary.
Parameter Adopted Value
UCS 65
mi (material constant) 20
GSI 35
Disturbance factor 0.5
MR 300
Table 3. Summary of preliminary subsurface parameters.
Depth (m) Material Type Density (g/cm3) Bulk Cohesion (kg/cm2) Design SPT Blows (N) Angle of Internal Friction
[image:10.595.206.540.677.727.2]DOI: 10.4236/ojg.2019.911088 762 Open Journal of Geology Figure 7. Indicative allowable bearing pressure curves for square footings.
Figure 8. Indicative allowable bearing pressure curves for strip footings.
[image:11.595.58.542.345.622.2]DOI: 10.4236/ojg.2019.911088 763 Open Journal of Geology Figure 9. Results of limit equilibrium analysis for catastrophic failure.
can be noticed by a low factor of safety however it is anticipated that the actual ground conditions could be better than predicted here.
The deformation analysis of the open pit mine slopes is performed using the Rocscience finite element based software Phase 2. The result of the analysis is shown in Figure 10 which shows quite rational patterns of deformation. The maximum deformation is likely to be in order of as high as 700 mm for individ-ual slope riser whereas in the range of 300 to 400 mm for the overall slope. These numbers should become more representative with expanding the geotechnical database for the project and carrying out numerous such analyses with excava-tion stages since the modulus to elasticity in both soils and rocks is not a con-stant rather depend on the changing stress and strain.
Following analyses are made at this stage for preliminary understandings when very limited information is available to study the slope stability conditions. Therefore, it is highly recommended that detailed slope stability analyses will be carried out at the stage of detailed design for mining.
6. Conclusions and Recommendations
This study was conducted to determine the initial geotechnical and hydrological characterization of the study area with the context of infrastructures for mining activities of iron ore in future. Therefore, following points are concluded: • Several samples of soil and rocks were collected to understand the
DOI: 10.4236/ojg.2019.911088 764 Open Journal of Geology Figure 10. Results of finite element analysis for deformation patterns.
samples: Grain size analyses, Atterberg limits, bulk density, consolidation test, swell pressure, moisture content, direct shear test and chemical test of soil, Point load, Uniaxial compressive strength, tensile strength test.
• The result of grain size analyses and Atterberg limit reveals that soil types of Silty sand/sandy silt (SP-SM/SM) and Clayey silt/non plastic silt (CL-ML/ML) are prevailing in the study area. Moisture content varies from 14.60% - 21.38% and the bulk density varies between 1.461 and 1.853 g/cc. The direct shear test predicted that values vary from 31.4 - 38.5 degree with zero cohe-sion in all samples. The consolidation test result gives the initial void ratio (eo) varying between 0.412 and 0.952 and not a single sample presented swell
potential. The sulphate content ranged from 0.003% - 0.006%, the chloride content varied from 0.0012% to 0.0057%, the organic matter found between 0.013% - 0.030% and the pH-value varied from 6.92 - 7.56.
• The laboratory tests of rock samples predicted that UCS values are ranged between 25 MPa and 140 MPa that belongs to medium strong rock. Indirect tensile strength test of rock samples has minimum strength of 6.82 MPa and maximum of 15.66 MPa. The average angle of internal friction found during the Direct shear tests is 30 degree.
DOI: 10.4236/ojg.2019.911088 765 Open Journal of Geology storage coefficient are 6038 m2/day, 4.0 × 101 m/day and 0.016 respectively
that presented aquifer is quite permeable. The cone of influence covered an area of 65 m from the main production well.
• Slope stability analyses were also carried out by using Slide software. The sta-bility analysis is performed assuming a 4V:1H slope in the bedrock while 1V:1H in the overlying sediments cover. 0.79 Factor of safety were calculated according to the assumed water table and other conditions at this very initial stage. The software Phase 2 was used for deformation analysis for mine slopes by finite element method. The maximum deformation is likely to be in order of as high as 700 mm for individual slope riser whereas in the range of 300 to 400 mm for the overall slope.
This study is included an initial understanding of geotechnical and hydrolog-ical condition of study area and not recommended for detail design of mining. At this stage the preliminary information was collected for this study and it is recommended to collect the detailed information to enhance the level of confi-dence for geotechnical and hydrological design related to mining activities. The depth of geotechnical parameters must be extended to the bedrock in order to col-lect, examine and test the rock samples as well as soil samples at several depths for more improvement of rock mass characterization information.
Conflicts of Interest
The authors declare no conflicts of interest regarding the publication of this pa-per.
References
[1] Paige-Green, P. (1999) A Comparative Study of the Grading Coefficient, a New Par-ticle Size Distribution Parameter. Bulletin of Engineering Geology and the Envi-ronment, 57, 215-223. https://doi.org/10.1007/s100640050039
[2] Erguler, Z.A. (2016) A Quantitative Method of Describing Grain Size Distribution of Soils and Some Examples for Its Applications. Bulletin of Engineering Geology and the Environment, 75, 807-819. https://doi.org/10.1007/s10064-015-0790-1
[3] Giasi, C.I., Cherubini, C. and Paccapelo, F. (2003) Evaluation of Compression Index of Remoulded Clays by Means of Atterberg Limits. Bulletin of Engineering Geology and the Environment, 62, 333-340. https://doi.org/10.1007/s10064-003-0196-3
[4] Messad, A. and Moussai, B. (2016) Effect of Water Salinity on Atterberg Limits of El-Hodna Sabkha Soil. Bulletin of Engineering Geology and the Environment, 75, 301-309. https://doi.org/10.1007/s10064-015-0733-x
[5] Ogunsanwo, O. (1993) Influence of Sample Preparation and Mode of Testing on the Shear Strength Characteristics of Laterite Soils from Southwestern Nigeria. Bulletin of the International Association of Engineering Geology, 47, 141-144.
https://doi.org/10.1007/BF02639602
[6] Marsland, A., McGown, A. and Derbyshire, E. (1980) Soil Profile Mapping in Rela-tion to Site EvaluaRela-tion for FoundaRela-tions and Earthworks. Bulletin of the Internation-al Association of Engineering Geology, 21, 139. https://doi.org/10.1007/BF02591554
DOI: 10.4236/ojg.2019.911088 766 Open Journal of Geology Sultana, S. (2017) Ethnopharmacological Relevance of Medicinal Plants Used for the Treatment of Oral Diseases in Central Punjab-Pakistan. Journal of Herbal Med-icine, 1-23.
[8] Kazmi, A.H. and Jan, M.Q. (1997) Geology and Tectonics of Pakistan. Graphic Pub-lishers, Karachi.
[9] Shah, S.M.I. (2009) Stratigraphy of Pakistan. Geological Survey of Pakistan, Me-moir, 22.
[10] Ahmad, S., Ali, A. and Irfan, M.K. (2005) Imprints of Transtensional Deformation along Kalabagh Fault in the Vicinity of Kalabagh Hills, Pakistan. Pakistan Journal of Hydrocarbon Research, 15, 35-42.
[11] Yagiz, S., Akyol, E. and Sen, G. (2008) Relationship between the Standard Penetra-tion Test and the Pressure Meter Test on Sandy Silty Clays: A Case Study from De-nizli. Bulletin of Engineering Geology and the Environment, 67, 405-410. https://doi.org/10.1007/s10064-008-0153-2
[12] Akca, N. (2003) Correlation of SPT-CPT Data from the United Arab Emirates. En-gineering Geology, 67, 219-231. https://doi.org/10.1016/S0013-7952(02)00181-3
[13] Clayton, C.R.I. (1995) The Standard Penetration Tests (SPT): Methods and Use (R143). CIRIA, London, 144.
[14] Marcuson, W.F. and Bieganousky, W.A. (1977) SPT and Relative Density in Coarse Sands. Journal of the Geotechnical Engineering Division, 103, 1295-1309.
[15] Skempton, A.W. (1986) Standard Penetration Test Procedures and the Effect in Sands of Overburden Pressure, Relative Density, Particle Size, Aging and Over-Consolidation. Geotechnique, 36, 425-447.
https://doi.org/10.1680/geot.1986.36.3.425
[16] ASTM D1587/D1587M (2015) Standard Practice for Thin-Walled Tube Sampling of Fine-Grained Soils for Geotechnical Purposes. ASTM International, West Consho-hocken.
[17] Vallejo, L.I.G. and Mercedes, F. (2007) Geological Engineering. CRC Press, London. [18] Das, B.M. (2007) Fundamentals of Geotechnical Engineering. 3rd (Third) Edition,
CL-Engineering Publisher, Nevada.
[19] Mironenko, V.A. (1982) A Study of the Hydrogeomechanical Properties or Rocks Using Experimental Filtration Tests and Observations of Ground Water Movement. Bulletin of the International Association of Engineering Geology, 26, 489-491. https://doi.org/10.1007/BF02594264
[20] Theis, C.V. (1935) The Relation between the Lowering of the Piezometric Surface and the Rate and Duration of Discharge of a Well Using Groundwater Storage. Transactions of the American Geophysical Union, 16, 519-524.
https://doi.org/10.1029/TR016i002p00519
[21] Liu, C. and Evett, J.B. (2008) Soil Properties: Testing, Measurement, and Evaluation. Pearson Publisher, Englewood Cliffs, New Jersey.
[22] ASTM (2007) Standard D422-63: Standard Test Method for Particle-Size Analysis of Soils. ASTM International, West Conshohocken.
[23] ASTM Standart D2216 (2005) Test Methods for Laboratory Determination of Wa-ter (Moisture) Content of Soil and Rock by Mass. ASTM InWa-ternational, West Con-shohocken. http://www.astm.org
https://doi.org/10.1520/D2216-05
DOI: 10.4236/ojg.2019.911088 767 Open Journal of Geology 04.09.
[25] ASTM D2435 (2011) Standard Test Methods for One-Dimensional Consolidation Properties of Soils Using Incremental Loading. Annual Book of ASTM Standards, Section 4, Vol. 04.01, Soil and Rock, Building Stones. ASTM International, West Conshohocken.
[26] ASTM D3080 (2011) Standard Test Methods for Direct Shear Test of Soils under Consolidated Drained Conditions. ASTM International, West Conshohocken. [27] ASTM D4318 (2010) Test Methods for Liquid Limit, Plastic Limit, and Plasticity
![Figure 1. The location of the study area (Modified after Fatima et al. [7]).](https://thumb-us.123doks.com/thumbv2/123dok_us/8934935.392835/2.595.210.534.383.704/figure-location-study-area-modified-fatima-et-al.webp)