Food and Nutrition Sciences, 2011, 2, 304-313
doi:10.4236/fns.2011.24044 Published Online June 2011 (http://www.scirp.org/journal/fns)
Detection, Identification and Characterization of
Staphylococci in Street Vend Foods
—
Characterization of Staphylococcus IsolatesYadahalli Shrihari Rohinishree, Pradeep Singh Negi
Human Resource Development, Central Food Technological Research Institute, Mysore, India. Email:[email protected]
Received January 13th, 2011;revised March 28th, 2011; accepted April 7th, 2011.
ABSTRACT
In the present investigation the diversity of the Staphylococcus species in different street vend food samples was studied. A total of 35 staphylococcal food isolates comprising of various species from 14 different street vend food samples were identified and characterized phenotypically. Staphylococcus aureus was found to be the most prevalent species in these foods. A PCR-RFLP analysis based on 16S rRNA gene was used for identification of Staphylococcus species. Isolates showing distinct RFLP pattern for AluI restriction digestion were selected for nucleotide sequence analysis. Phyloge-netic tree constructed using the multiple alignments of 16S rRNA gene sequences of isolates showed a hotspot region of
169 bp and the relationship among species was evaluated by bootstrap values generated in phylogenetic analysis.16S rRNA gene sequences allowed bacterial identification that was reproducible and more accurate than that obtained by phenotypic testing. 16S rRNA gene sequence analysis would be helpful in timely and correct identification of pathogens.
Keywords: Staphylococcus,16S rRNA Gene Sequence, RFLP, Phylogenetic Tree
1. Introduction
Members of Staphylococci are wide spread in nature and have been isolated sporadically from a wide range of environmental sources such as air, water, soil and plant surfaces, meat, poultry and dairy products [1]. They are capable of causing mild to life threatening diseases, which also includes food borne illnesses. Several species in this genus are having capability to produce a wide range of heat stable enterotoxins, and the main members of this genus, S. aureus is considered the third most
im-portant cause of foodborne diseases in the world among the reported foodborne pathogens [2-4].
Several Staphylococcus species other than S. aureus
are reported to produce enterotoxins [5]. The coagulase positive S. hyicus and S. intermedius are the predominant
non-S. aureus species, which have been shown to
pro-duce staphylococcal enterotoxins (SEs) and are involved in staphylococcal food poisoning outbreaks [6-9]. Among the coagulase negative species, S. cohnii, S. epidermidis, S. xylosus and S. haemolyticus have been isolated from
ewe’s milk and were found to produce one or the other SEs [10]. Other non Staphylococcus aureus species such
as S. saprophyticus, S. warneri, S. chromogenes and S.
lentus isolated from healthy goat milk and dry-cured hams
were found to have the enterotoxigenic potential [11-14]. Screening for Staphylococcus species among various
ready to serve food products available in the street vend shops is important for epidemiological reasons. As most of these products are sold in open conditions, this screening will also indicate the level of hygiene followed by these vendors. Therefore, the aim of the present in-vestigation was to study the distribution of various Sta- phylococcus species in street vend food.
2. Materials and Methods
2.1. Isolation of Staphylococcus Species from Different Food Sources
Street vend food samples were collected from Mysore city limits in a sterilized container, transported under cold condition to the laboratory and screened for the presence of Staphylococcus species within an hour. The
isolation of Staphylococcus species from different food
lurite (0.3%) solution. The plates were incubated under aerobic conditions at 37˚C for 24 to 48 h. From each plate, gray to black colonies with lecithinase positive as well as negative activity were chosen for further identi-fication of species by biochemical and gene based meth-ods. Staphylococcus aureus (FRI 722), S. saprohyticus
(ATCC 15305), S. epidermidis (ATCC 12228), S. xylosus
(ATCC 35033) and S. hemolyticus (ATCC 29978) were
used as reference strains.
2.2. Conventional Biochemical Test
Biochemical identification and characterization of iso-lates were done after confirmation of Gram reaction and catalase test, and only positive isolates were selected for further study. Biochemical tests included production of DNase, TNase, phosphatase, nitrate reductase and ace-toin; haemolytic activity (sheep blood); tube coagulase test; antibiotic sensitivity test to novobiocin; utilization of D-mannitol and salt tolerance test at 10% and 15% NaCl concentration [15]. On the basis of biochemical test results, isolates were identified to species level with the aid of Bergey’s Manual of Systematic Bacteriology [1].
2.3. DNA Extraction
Genomic DNA was isolated as described previously (A. K. Saxena, Manual of DNA Sequencing and Microbial Identification, National Training Programme, September 1 - 7, 2008, National Bureau of Agriculturally Important Microorganisms, Mau Nath Bhanjan, India) with slight modification. In brief, the bacterial cultures were grown in pre sterilized brain heart infusion broth (pH-7) over-night at 37˚C and harvested by centrifuging it at 10,000 rpm for 5 min at room temperature to collect the pellet. Pellet was washed with 1 ml TE (10 mM Tris-HCl, pH 8.0 and 1 mM EDTA pH 8.0) and resuspended in 0.5 ml SET buffer (75 mM NaCl, 25 mM EDTA pH 8.0, 20 mM Tris-HCl pH 8.0) containing 100 μg lysozyme and incu-bated at 37˚C for 1 h. To this 1/10 volume of 10% SDS and 100 μg of proteinase K was added and incubated at 55˚C for 1 h. After incubation, 1/3 volume of 5 M NaCl and equal volume of phenol: chloroform: isoamylalcohol (25:24:1) were added and incubated at 37˚C for further 30 min. After centrifuging it at 5000 rpm for 15 min at 4˚C, aqueous layer was collected in a fresh eppendorf tube and precipitated with ethanol. The pellet obtained by
centrifugation at 10,000 rpm for 5 min at 4˚C was wash- ed with 70% ethanol by centrifugation at 10,000 rpm for 5 min at 4˚C, air dried and dissolved in TE buffer. The concentration and quality of genomic DNA was calcu-lated by the spectrophotometer reading at 260 nm. Integ-rity of the DNA was checked by running in 0.8% agarose gel.
2.4. PCR Amplification of 16S rRNA and Purification
16S rRNAUniversal primer forward 5’ AGA GTT TGA TCC TGG CTC AG 3’ and reverse 5’ AAG GAG GTG ATC CAG CCG CA 3’ were synthesized from Sigma Aldrich (Bangalore, India). A reaction mixture contain-ing approximately 1 ng of template DNA, 2.5 μl of 10X buffer, 20 pM concentration of each PCR primer, 10 mM dNTP mix and 1 U of Taq polymerase (Bangalore Genei, Bangalore, India) in a total of 25 μl was prepared by adding sterile milli Q water for all the reactions. The PCR was carried out in a Thermal Cycler (Mastercycler, Eppendorf, Hamburg, Germany). The amplified product of 16S rRNA gene was purified with the PCR purifica-tion kit following the standard protocol as supplied by the manufacturer (HiMedia, Mumbai, India). The purifi-cation involved adding binding buffer to the PCR mix and centrifuging through filter tubes. The unincorporated nucleotides were removed by adding wash buffer and centrifugation at 10,000 rpm for 2 min. The PCR prod-ucts were eluted using elution buffer by centrifugation at 10,000 rpm for 1 min.
2.5. Restriction Endonuclease Digestion
The 16S rRNA amplified products were digested with
BamHI, HindIII, EcoRI, AluI and HaeIII restriction
en-zymes (Bangalore Genei, Bangalore, India). PCR product was digested separately with 10 U of each enzyme for 3 h at 37˚C in a circulating water bath (Julabo, Germany). Reaction was stopped by incubating the samples at 65˚C for 5 min [16]. Digested samples were electrophoresed on 2.5% agarose gel and photographed by gel documen- tation system (Vibler Lourmat, Marne-la-Vallee, France).
2.6. Cluster Analysis
Different fragments on the gel were numbered sequen-tially, followed by scoring the samples based on presence and absence of fragments (present 1, absent 0) and com-pared according to the genetic distance method. The strains were clustered by the Unweighted Pair Group Method with Arithmetic Mean (UPGMA) with the aid of NTSYS software (Applied Biostatistics Inc V.1.07).
2.7. Sequence Analysis of 16S rRNA Gene
The purified product was sequenced in an automated DNA sequencing facility (Bangalore Genei, Bangalore, India). The results were processed into sequence data with sequence analysis Chromas software (version 2.33; Technelysium Pvt. Ltd;
Detection, Identification and Characterization of Staphylococciin Street Vend Foods 306
both forward and reverse sequences with the aid of Wil-liam Pearson’slalignprogram
(http://www.ch.embnet.org/software/lalign_form.html). A single sequence analysis data obtained was blasted in NCBI database for the identification of isolates. These sequences were compared with the reported Staphylo-coccus species 16S rRNA gene sequences available in
the GenBank database
(http://www.ncbi.nlm.nih.gov/Genbank/index.html). Based on the highest percentage homology to the reported se-quences, the food isolates were identified. Multiple se-quence alignments were performed using clustalW (Ky- oto University, Bioinformatics Center;
http://align.genome.jp/). Phylogenetic tree and Bootstrap- ping were constructed based on the 16S rRNA gene se-quences using CLC Main workbench software (version 5.6.1, CLC bio, www.clcbio.com).
2.8. Nucleotide Sequence Accession Numbers
The 16S rRNA sequences determined for the food iso- lates were submitted to the eMBL database
(http://www.ebi.ac.uk/embl/Submission/).
3. Results
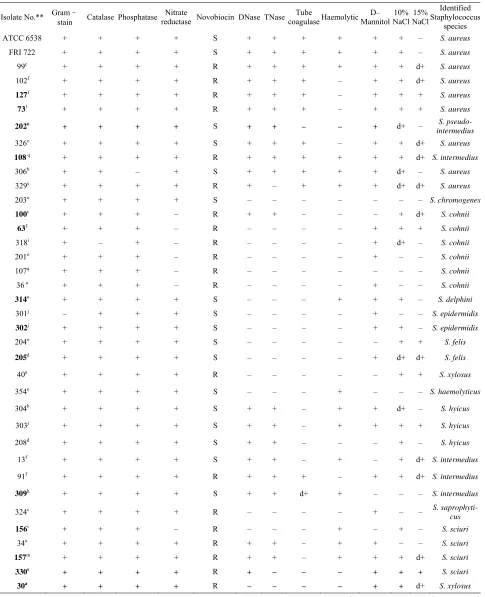
Based on differences in morphological characteristics on BPA such as big to pin point colonies showing grayish black to black colour with lecithinase positive as well as negative activity, a total of 35 native isolates were se- lected from 14 street vend food samples in Mysore city area. The results of biochemical characterization of these isolates showed that S. aureus was the most frequently
isolated species among different food samples account- ing for 20.0% the population studied. The other Staphy- lococcus isolates were distributed as S. cohnii (17.14%); S. sciuri and S. intermedius (11.42% each); S. hyicus
(8.57%); S. chromogenes and S. intermedius (8.43%
each); S. epidermidis; S. xylosus and S. felis (5.70%each);
and S. haemolyticus; S. delphini; S. pseudointermedius; S. saprophyticus and S. chromogenes (2.85% each) (Table 1).
To confirm the phenotypic identification of the food isolates, definitive species identification was done on the basis of PCR-RFLP and sequence data analysis for the 16S rRNA gene. All Staphylococcal food isolates and reference strains generated a single PCR product of about 1500 bp length for 16S rRNA gene. The PCR products were then digested with BamHI, HindIII, EcoRI, HaeIII
and AluI for RFLP analysis. It was observed that major-
ity of the isolates and reference standards namely S. au-reus (FRI 722), S. epidermidis (ATCC 12228), S. sap- rophyticus (ATCC15305), S. haemolyticus (ATCC 29978)
and S. xylosus (ATCC 35033) had identical restriction
profiles with BamHI, HaeIII, HindIII and EcoRI, but
these strains yielded different digestion patterns when subjected to AluI restriction digestion. On the basis of
scoring, presence and absence of fragments (present 1, absent 0), phylogenetic tree was constructed with the help of NTYSIS software and isolates found at different branching nodes were selected for further sequence analysis. When comparing with the reference standards to the food isolates using biochemical tests it was ob- served that even the isolates of same species were form- ing in different nodes (Figure 1) this indicates that either
there is a difference among the Staphylococcus species or
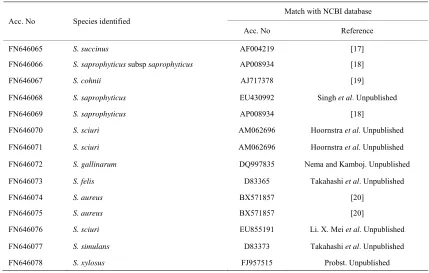
biochemical test is not so accurate for identification at species level. Therefore, 14 isolates that were found at different nodes were selected for sequence analysis and the data were compared with NCBI database (Table 2).
The highest similarity with a best match to the reported sequence data were S. cohnii (99%); S. sciuri (99%); S. saprophyticus (97%); S. saprophyticus subsp saprophyticus
(98%) and S. gallinarum (96%)indicating high degree of
similarity between the food isolates and the reported spe- cies. These sequences were deposited in EMBL database
under accession No FN646065 - FN646078.
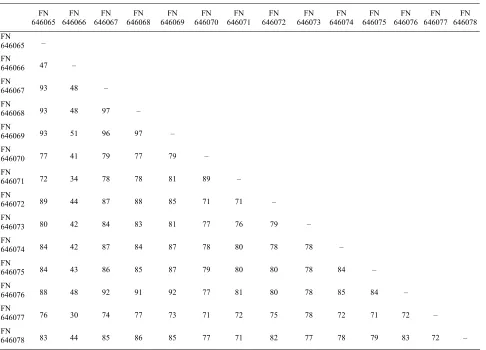
Multiple alignments of 16S rRNA gene data sequences of Staphylococcus food isolates were obtained using
ClustalW programme. Sequence similarity of 16S rRNA gene among 14 different Staphylococcus species ranged
from 30% - 97% with a mean similarity of 63.5% (Table 3). These values are consistently lower and indicate high
discrimination among the different Staphylococcus
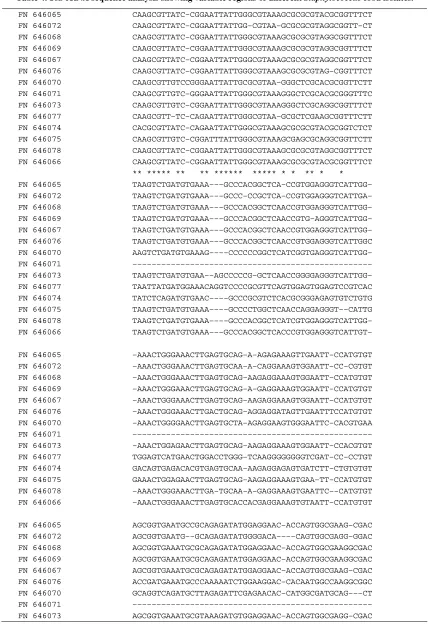
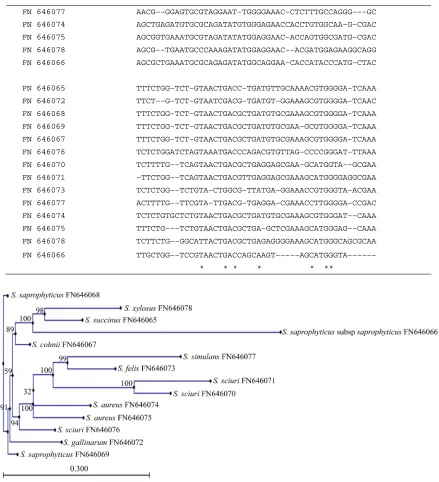
spe-cies and the most variability among all the food isolates was observed at 595 to 763 bp region of 169 bp (Table 4). The pair wise comparisons among different
Staphy-lococcal species showed a wide variability (3 to 70%). The highest percentage similarity was observed between the species S. cohnii and S. saprophyticus isolates(96.5%), S. cohnii and S. sciuri isolates (92%) and S. saprophyti- cus and S. sciuri isolates (91.5%), and the least similarity
was observed between S. saprophyticus subsp saprophy- ticus and S. simulans (30%).
The relationships among species of the genus Staphy-lococcus were confirmed by phylogenetic analysis based
on the 16S rRNA gene sequencing, and the topology of the tree was evaluated by bootstrap values. The phy-logenetic tree (Figure 2) showed that Staphylococcus
species were divided in distinct subgroups. The group consisting of S. cohnii, S. saprophyticus subsp sapro-phyticus and S. xylosus was characterized as being
novo-biocin resistant, and it formed a monophyletic clade in the phylogenetic tree with 89% of the bootstrap value. S. cohnii has a relatively deep subline with in a cluster
group of S. saprophyticus subsp saprophyticus.
Table 1. Biochemical characterization of Staphylococcus food isolates*.
Isolate No.** Gram–
stain Catalase Phosphatase Nitrate
reductase Novobiocin DNase TNase Tube
coagulaseHaemolytic D– Mannitol
10% NaCl
15% NaCl
Identified Staphylococcus
species
ATCC 6538 + + + + S + + + + + + – S. aureus
FRI 722 + + + + S + + + + + + – S. aureus
99c + + + + R + + + + + + d+ S. aureus
102f + + + + R + + + – + + d+
S. aureus
127f + + + + R + + + – + + + S. aureus
73l + + + + R + + + – + + + S. aureus
202o + + + + S + + – – + d+ – S.
pseudo-intermedius
326o + + + + S + + + – + + d+ S. aureus
108 q + + + + R + + + + + + d+ S. intermedius
306b + + – + S + + + + + d+ –
S. aureus
329s + + + + R + – + + + d+ d+ S. aureus
203o + + + + S – – – – – – –
S. chromogenes
100c + + + – R + + – – – + d+ S. cohnii
63f + + + – R – – – – + + + S. cohnii
318i + – + – R – – – – + d+ –
S. cohnii
201o + + + – R – – – – + – –
S. cohnii
107q + + + – R – – – – – – –
S. cohnii
36 a + + + – R – – – – + – – S. cohnii
314o + + + + S – – – + + + – S. delphini
301j – + + + S – – – – + – –
S. epidermidis
302j + + + + S – – – – + + – S. epidermidis
204o + + + + S – – – – – + +
S. felis
205d + + + + S – – – – + d+ d+ S. felis
40a + + + + R – – – – – + + S. xylosus
354o + + + + S – – – + – – –
S. haemolyticus
304b + + + + S + + – + + d+ – S. hyicus
303j + + + + S + + – + + + +
S. hyicus
208d + + + + S + + – – – + – S. hyicus
13f + + + + S + + – + – + d+
S. intermedius
91f + + + + R + + + – + + d+ S. intermedius
309h + + + + S + + d+ + – – – S. intermedius
324c + + + + R – – – – + – – S.
saprophyti-cus
156r + + + – R – – – + – + – S. sciuri
34a + + + + R + + – + + – – S. sciuri
157m + + + + R + + – + + + d+ S. sciuri
330s + + + + R + – – – + + + S. sciuri
30a + + + + R – – – – + + d+ S. xylosus
*+: Positive, –: Negative, R: Resistant, S: Sensitive, d+: Delayed Positive; **Food source of isolates a–Agra Peda, b–Badam milk, c–Bhelpuri, d–Boiled milk, f–
Churmuri,h– Curd rice, i– Dosa batter, j– Icecream, l– Laddu, m–Namkeen, o–Raw milk, q– Sevpuri, r– Sweet, s– Voda. Highlighted
Detection, Identification and Characterization of Staphylococciin Street Vend Foods 308
Figure 1. Unrooted Neighbour–joining phylogenetic tree of Staphylococcus food isolates constructed on the basis of digestion of 16S rRNA gene product with AluI restriction enzyme. The scale bar indicates the evolutionary distance value between the species.
Table 2. Molecular identification of Staphylococcus food isolates.
Match with NCBI database Acc. No Species identified
Acc. No Reference
FN646065 S. succinus AF004219 [17]
FN646066 S. saprophyticus subsp saprophyticus AP008934 [18]
FN646067 S. cohnii AJ717378 [19]
FN646068 S. saprophyticus EU430992 Singh et al. Unpublished
FN646069 S. saprophyticus AP008934 [18]
FN646070 S. sciuri AM062696 Hoornstra et al. Unpublished
FN646071 S. sciuri AM062696 Hoornstra et al. Unpublished
FN646072 S. gallinarum DQ997835 Nema and Kamboj. Unpublished
FN646073 S. felis D83365 Takahashi et al. Unpublished
FN646074 S. aureus BX571857 [20]
FN646075 S. aureus BX571857 [20]
FN646076 S. sciuri EU855191 Li. X. Mei et al. Unpublished
FN646077 S. simulans D83373 Takahashi et al. Unpublished
[image:5.595.82.511.445.718.2]Table 3. Sequence similarity (%) of 16S rRNA gene of different Staphylococcus food isolates.
FN 646065
FN 646066
FN 646067
FN 646068
FN 646069
FN 646070
FN 646071
FN 646072
FN 646073
FN 646074
FN 646075
FN 646076
FN 646077
FN 646078 FN
646065 –
FN
646066 47 –
FN
646067 93 48 –
FN
646068 93 48 97 –
FN
646069 93 51 96 97 –
FN
646070 77 41 79 77 79 –
FN
646071 72 34 78 78 81 89 –
FN
646072 89 44 87 88 85 71 71 –
FN
646073 80 42 84 83 81 77 76 79 –
FN
646074 84 42 87 84 87 78 80 78 78 –
FN
646075 84 43 86 85 87 79 80 80 78 84 –
FN
646076 88 48 92 91 92 77 81 80 78 85 84 –
FN
646077 76 30 74 77 73 71 72 75 78 72 71 72 –
FN
646078 83 44 85 86 85 77 71 82 77 78 79 83 72 –
which showed a monophyletic clade of 100% bootstrap value. The phylogenetic tree showed different individual branches for isolates of S. saprophyticus and S. gallina-rum.
4. Discussion
Using conventional biochemical test methods, S. aureus
was identified as a major contaminant of street vends foods. Conventional biochemical methods used for the identification of Staphylococcus at species level are not
so accurate as compared to molecular methods. There-fore, as an alternative multilocus methods such as RFLP analysis and 16S rRNA sequence analysis were used [21, 22]. With advances in molecular biology techniques, comparative DNA sequence analysis of genes of con-served macromolecules have become common in micro-biology for taxonomic grouping of microorganisms, and the 16S rRNA gene is reported to be the most useful and extensively investigated taxonomic marker molecules [23]. 16S rRNA sequence analysis is more discriminative than other ribosomal regions for differentiating species and sub species of Staphylococcus, and it provides
accu-rate identification of Staphylococcus at species level
[24].
When compared with the 16S rRNA sequence analysis, biochemical tests were able to identify S. xylosus, S. sci-uri and S. cohinii correctly, butmisidentified other
spe-cies. Two isolates of S. saprophyticus weremisidentified
biochemically as S. intermedius and S. aureus. The
mis-matching between biochemical and molecular identifica-tion may be due to the close relatedness among the spe-cies, as evident from the phylogenetic tree (Figure 2).
This variability in results of biotyping and 16S rRNA sequence also has been reported in other study also [25]. Further, the identification to subspecies level is not pos-sible by biochemical means and it is not pospos-sible to iden-tify the S. saprophyticus subsp saprophyticus correctly
by biochemical analysis. Molecular characterization is reported to be more accurate [23,26], and in present study also sequencing of the 16S rRNA fragment was discriminative enough to differentiate Staphylococcus
food isolates at the sub species level. Kwok et al. [24]
Detection, Identification and Characterization of Staphylococciin Street Vend Foods 310
Table 4. 16S rRNA sequence analysis showing variable regions of different Staphylococcus food isolates.
FN 646065 CAAGCGTTATC–CGGAATTATTGGGCGTAAAGCGCGCGTACGCGGTTTCT
FN 646072 CAAGCGTTATC–CGGAATTATTGG–CGTAA–GCGCGCGTAGGCGGTT–CT
FN 646068 CAAGCGTTATC–CGGAATTATTGGGCGTAAAGCGCGCGTAGGCGGTTTCT
FN 646069 CAAGCGTTATC–CGGAATTATTGGGCGTAAAGCGCGCGTAGGCGGTTTCT
FN 646067 CAAGCGTTATC–CGGAATTATTGGGCGTAAAGCGCGCGTAGGCGGTTTCT
FN 646076 CAAGCGTTATC–CGGAATTATTGGGCGTAAAGCGCGCGTAG–CGGTTTCT
FN 646070 CAAGCGTTGTCCGGGAATTATTGCGCGTAA–GGGCTCGCACGCGGTTCTT
FN 646071 CAAGCGTTGTC–GGGAATTATTGGGCGTAAAGGGCTCGCACGCGGGTTTC
FN 646073 CAAGCGTTGTC–CGGAATTATTGGGCGTAAAGGGCTCGCAGGCGGTTTCT
FN 646077 CAAGCGTT–TC–CAGAATTATTGGGCGTAA–GCGCTCGAAGCGGTTTCTT
FN 646074 CACGCGTTATC–CAGAATTATTGGGCGTAAAGCGCGCGTACGCGGTCTCT
FN 646075 CAAGCGTTGTC–CGGATTTATTGGGCGTAAAGCGAGCGCAGGCGGTTCTT
FN 646078 CAAGCGTTATC–CGGAATTATTGGGCGTAAAGCGCGCGTAGGCGGTTTCT
FN 646066 CAAGCGTTATC–CGGAATTATTGGGCGTAAAGCGCGCGTACGCGGTTTCT
** ***** ** ** ****** ***** * * ** * *
FN 646065 TAAGTCTGATGTGAAA–––GCCCACGGCTCA–CCGTGGAGGGTCATTGG–
FN 646072 TAAGTCTGATGTGAAA–––GCCC–CCGCTCA–CCGTGGAGGGTCATTGA–
FN 646068 TAAGTCTGATGTGAAA–––GCCCACGGCTCAACCGTGGAGGGTCATTGG–
FN 646069 TAAGTCTGATGTGAAA–––GCCCACGGCTCAACCGTG–AGGGTCATTGG–
FN 646067 TAAGTCTGATGTGAAA–––GCCCACGGCTCAACCGTGGAGGGTCATTGG–
FN 646076 TAAGTCTGATGTGAAA–––GCCCACGGCTCAACCGTGGAGGGTCATTGGC
FN 646070 AAGTCTGATGTGAAAG––––CCCCCCGGCTCATCGGTGAGGGTCATTGG–
FN 646071 ––––––––––––––––––––––––––––––––––––––––––––––––––
FN 646073 TAAGTCTGATGTGAA––AGCCCCCG–GCTCAACCGGGGAGGGTCATTGG–
FN 646077 TAATTATGATGGAAACAGGTCCCCGCGTTCAGTGGAGTGGAGTCCGTCAC
FN 646074 TATCTCAGATGTGAAC––––GCCCGCGTCTCACGCGGGAGAGTGTCTGTG
FN 646075 TAAGTCTGATGTGAAA––––GCCCCTGGCTCAACCAGGAGGGT––CATTG
FN 646078 TAAGTCTGATGTGAAA––––GCCCACGGCTCATCGTGGAGGGTCATTGG–
FN 646066 TAAGTCTGATGTGAAA–––GCCCACGGCTCACCCGTGGAGGGTCATTGT–
FN 646065 –AAACTGGGAAACTTGAGTGCAG–A–AGAGAAAGTTGAATT–CCATGTGT
FN 646072 –AAACTGGGAAACTTGAGTGCAA–A–CAGGAAAGTGGAATT–CC–CGTGT
FN 646068 –AAACTGGGAAACTTGAGTGCAG–AAGAGGAAAGTGGAATT–CCATGTGT
FN 646069 –AAACTGGGAAACTTGAGTGCAG–A–GAGGAAAGTGGAATT–CCATGTGT
FN 646067 –AAACTGGGAAACTTGAGTGCAG–AAGAGGAAAGTGGAATT–CCATGTGT
FN 646076 –AAACTGGGAAACTTGACTGCAG–AGGAGGATAGTTGAATTTCCATGTGT
FN 646070 –AAACTGGGGAACTTGAGTGCTA–AGAGGAAGTGGGAATTC–CACGTGAA
FN 646071 ––––––––––––––––––––––––––––––––––––––––––––––––––
FN 646073 –AAACTGGAGAACTTGAGTGCAG–AAGAGGAAAGTGGAATT–CCACGTGT
FN 646077 TGGAGTCATGAACTGGACCTGGG–TCAAGGGGGGGGTCGAT–CC–CCTGT
FN 646074 GACAGTGAGACACGTGAGTGCAA–AAGAGGAGAGTGATCTT–CTGTGTGT
FN 646075 GAAACTGGAGAACTTGAGTGCAG–AAGAGGAAAGTGAA–TT–CCATGTGT
FN 646078 –AAACTGGGAAACTTGA–TGCAA–A–GAGGAAAGTGAATTC––CATGTGT
FN 646066 –AAACTGGGAAACTTGAGTGCACCACGAGGAAAGTGTAATT–CCATGTGT
FN 646065 AGCGGTGAATGCCGCAGAGATATGGAGGAAC–ACCAGTGGCGAAG–CGAC
FN 646072 AGCGGTGAATG––GCAGAGATATGGGGACA––––CAGTGGCGAGG–GGAC
FN 646068 AGCGGTGAAATGCGCAGAGATATGGAGGAAC–ACCAGTGGCGAAGGCGAC
FN 646069 AGCGGTGAAATGCGCAGAGATATGGAGGAAC–ACCAGTGGCGAAGGCGAC
FN 646067 AGCGGTGAAATGCGCAGAGATATGGAGGAAC–ACCAGTGGCGAAG–CGAC
FN 646076 ACCGATGAAATGCCCAAAAATCTGGAAGGAC–CACAATGGCCAAGGCGGC
FN 646070 GCAGGTCAGATGCTTAGAGATTCGAGAACAC–CATGGCGATGCAG–––CT
FN 646071 ––––––––––––––––––––––––––––––––––––––––––––––––––
FN 646077 AACG––GGAGTGCGTAGGAAT–TGGGGAAAC–CTCTTTGCCAGGG–––GC
FN 646074 AGCTGAGATGTGCGCAGATATGTGGGAGAACCACCTGTGGCAA–G–CGAC
FN 646075 AGCGGTGAAATGCGTAGATATATGGAGGAAC–ACCAGTGGCGATG–CGAC
FN 646078 AGCG––TGAATGCCCAAAGATATGGAGGAAC––ACGATGGAGAAGGCAGG
FN 646066 AGCGCTGAAATGCGCAGAGATATGGCAGGAA–CACCATACCCATG–CTAC
FN 646065 TTTCTGG–TCT–GTAACTGACC–TGATGTTGCAAAACGTGGGGA–TCAAA
FN 646072 TTCT––G–TCT–GTAATCGACG–TGATGT–GGAAAGCGTGGGGA–TCAAC
FN 646068 TTTCTGG–TCT–GTAACTGACGCTGATGTGCGAAAGCGTGGGGA–TCAAA
FN 646069 TTTCTGG–TCT–GTAACTGACGCTGATGTGCGAA–GCGTGGGGA–TCAAA
FN 646067 TTTCTGG–TCT–GTAACTGACGCTGATGTGCGAAAGCGTGGGGA–TCAAA
FN 646076 TCTCTGGATCTAGTAAATGACCCAGACGTGTTAG–CCCCGGGAT–TTAAA
FN 646070 TCTTTTG––TCAGTAACTGACGCTGAGGAGCGAA–GCATGGTA––GCGAA
FN 646071 –TTCTGG––TCAGTAACTGACGTTGAGGAGCGAAAGCATGGGGAGGCGAA
FN 646073 TCTCTGG––TCTGTA–CTGGCG–TTATGA–GGAAACCGTGGGTA–ACGAA
FN 646077 ACTTTTG––TTCGTA–TTGACG–TGAGGA–CGAAACCTTGGGGA–CCGAC
FN 646074 TCTCTGTGCTCTGTAACTGACGCTGATGTGCGAAAGCGTGGGAT––CAAA
FN 646075 TTTCTG–––TCTGTAACTGACGCTGA–GCTCGAAAGCATGGGAG––CAAA
FN 646078 TCTTCTG––GGCATTACTGACGCTGAGAGGGGAAAGCATGGGCAGCGCAA
FN 646066 TTGCTGG––TCCGTAACTGACCAGCAAGT–––––AGCATGGGTA––––––
[image:8.595.79.518.80.562.2]* * * * * **
Figure 2. Neighbour–joining phylogenetic tree of Staphylococcus food isolates constructed on the basis of 16S rRNA gene sequence.
nation at the sub species level, but results presented here show that 16S rRNA might be more discriminative target sequence to differentiate among subspecies. Pair wise comparison of the 16S rRNA gene sequences of 14
Staphylococcus food isolates ranged from 30% – 97%
with mean similarity value of 63.5% (Table 3) indicating
suitability of 16S rRNA gene for discrimination among the Staphylococcus food isolates, as the higher %
simi-larity is less discriminatory [24]. While comparing relat-edness among the food isolates, the phylogenetic tree
(Figure 2) also showed distant groups indicating
suit-ability of the method used for differentiation.
5. Conclusions
In present study, S. aureus was found to be the most
prevalent species among the species of Staphylococcus
[image:8.595.83.518.83.582.2]Detection, Identification and Characterization of Staphylococciin Street Vend Foods 312
16S rRNA sequencing employed in this study for identi-fication of Staphylococcus species may be useful for
pre-cise and timely identification and prevention of any un-toward staphylococcal food poisoning incidences.
6. Acknowledgements
Authors are grateful to Dr. V. Prakash, Director, CFTRI and Dr. M. C. Varadaraj, Head, HRD, CFTRI for con-stant encouragement. YSR acknowledges the financial assistance in form of Senior Research Fellowship from Council of Scientific and Industrial Research, New Delhi for Ph. D. programme.
REFERENCES
[1] W. E. Kloos and K. H. Schleifer, “Genus IV Staphylo-coccus,” In: P. H. A Sneath, et al., Eds., Bergey’s Manual of Systematic Bacteriology, Vol. 2, Williams & Wilkins, Baltimore, 1986, pp. 1013-1035.
[2] H. Asperger and P. Zangerl, “Staphylococcus aureus,” In: H. Roginski, J. W. Fuquay and P. F. Fox, Eds., Encyclo-pedia of Dairy Sciences, Vol. 4, Academic Press and El-sevier Science, Amsterdam, 2003, pp. 2563-2569. [3] J. A. Boerema, R. Clemens and G. Brightwell,
“Evalua-tion of Molecular Methods to Determine Enterotoxigenic Status and Molecular Genotype of Bovine, Ovine, Human and Food Isolates of Staphylococcus aureus,” Interna-tional Journal of Food Microbiology, Vol. 107, No. 2, 2006, pp. 192-201.
doi:10.1016/j.ijfoodmicro.2005.07.008
[4] G. Normanno, A. Firinu, S. Virgilio, G. Mula, A. Dam-brosio, A. Poggiu, et al, “Coagulase–Positive Staphylo-cocci and Staphylococcus aureus in Food Products Mar-keted in Italy,” International Journal of Food Microbiol-ogy, Vol. 98, No. 1, 2005, pp. 73-79.
doi:10.1016/j.ijfoodmicro.2004.05.008
[5] J. M. Jay, “Staphylococcal Gastroenteritis. Modern Food Microbiology,” 4th Edtion, Van Norstrand Reinhold, New York, 1992, pp. 455–478.
[6] A. A. Adesyn, S. R. Tatini and D. Hoover, “Production of Enterotoxin by Staphylococcus hyicus,” Veterenary Mi-crobiology, Vol. 9, No. 5, 1984, pp. 487-495.
doi:10.1016/0378–1135(84)90069–5
[7] K. Becker, B. Keller, C. Von Eiff, M. Brück, G. Lubritz, J. Etienne and G. Peters, “Enterotoxigenic Potential of Sta-phylococcus intermedius,” Applied and Environmental Microbiology, Vol. 67, No. 12, 2001, pp. 5551-5557. doi:10.1128/AEM.67.12.5551–5557.2001
[8] E. Y. Hirooka, E. E. Muller, J. C. Freitas, E. Vicente, Y. Yoshimot and M. S. Bergdoll, “Enterotoxigenicity of Staphylococcus intermedius of Canine Origin,” Interna-tional Journal of Food Microbiology, Vol. 7, No. 3, 1988, pp. 185-191. doi:10.1016/0168–1605(88)90036–0 [9] F. M. Khambaty, R. W. Bennet and D. B. Shah,
“Appli-cation of Pulse–Field Gel Electrophoresis to the Epide-miological Characterization of Staphylococcus
interme-dius Implicated in a Food–Related Outbreak,” Epidemi-ology and Infection, Vol. 113, No. 1, 1994, pp. 75-80. doi:10.1017/S0950268800051487
[10] L. Bautista, et al., “A Quantitative Study of Enterotoxin Production by Sheep Milk Staphylococci,” Applied and Environmental Microbiology, Vol. 54, No. 2, 1988, pp. 566-569.
[11] M. A. Al–Bustan, E. E. Udo and T. D. Chugh, “Entero-toxin Production by Coagulase–Negative Staphylococci in Restaurant Workers from Kuwait City May be a Poten-tial Cause of Food Poisoning,” Journal of Medical Mi-crobiology, Vol. 48, No. 9, 1999, pp. 819-823.
doi:10.1099/00222615–48–9–819
[12] M. E. Marin, M. C. de la Rosa and I. Cornejo, “Entero-toxigenicity of Staphylococcus Strains Isolated from Spanish Dry–Cured Hams,” Applied and Environmental Microbiology, Vol. 58, No. 3, 1992, pp. 1067-1069. [13] J. Valle, L. E. Gomez, S. Piriz, J. Goyache, J. A. Orden
and S. Vadilo, “Enterotoxins Production by Staphylococ-cal Isolated from Healthy Goats,” Applied and Environ-mental Microbiology, Vol. 56, No. 5, 1990, pp. 1323- 1326.
[14] F. Vandenesch, S. J. Projan, B. Kreiswirth, J. Etienne and R. P. Novick, “Agr-Related Sequences in Staphylococcus lugdunensis,” FEMS Microbiology Letter, Vol. 111, No. 1, 1993, pp. 115-122.
doi:10.1111/j.1574–6968.1993.tb06370.x
[15] T. L. Bannerman, “Staphylococcus, Micrococcus, and Other Catalase–Positive Cocci That Grow Aerobically,” In: P. R. Murray, et al., Eds., Manual of Clinical Micro-Biology, ASM Press, Washington DC, 2003. pp. 384-404. [16] D. W. Russell and J. Sambrook, “Molecular Cloning: A
Laboratory Manual,” Cold Spring Harbor Laboratory, Cold Spring Harbor, 2001.
[17] L. H. Lambert, T. Cox, K. Mitchell, R. A. Rossello–Mora, C. D. Cueto, D. E. Dodge, P. Orkand and R. J. Cano, “Staphylococcus succinus sp. Nov, Isolated from Do-minican Amber,” International Journal of Systematic Bacteriology, Vol. 48, No. 2, 1998, pp. 511-518.
[18] M. Kuroda, A. Yamashita, H. Hirakawa, M. Kumano, K. Morikawa, M. Higashide, A. Maruyama, Y. Inose, et al., “Whole Genome Sequence of Staphylococcus sapro-phyticus Reveals the Pathogenesis of Uncomplicated Urinary tract Infection,” Proceedings of the National Academy of Science, Vol. 102, No. 37, 2005, pp. 13272-13277.
doi:10.1073/pnas.0502950102
[19] I. Tiago, A. P. Chung and A. Verissimo, “Bacterial Di-versity in a Nonsaline Alkaline Environment: Heterotro-phic aerobic Populations,” Applied and Environmental Microbiology, Vol. 70, No. 12, 2004, pp. 7378-7387. doi:10.1128/AEM.70.12.7378–7387.2004
Academy of Science, Vol. 101, No. 26, 2004, pp. 9786- 9791. doi:10.1073/pnas.0402521101
[21] J. G. Neigel and A. C. Avise, “Phylogenetic Relationship of Mitochondrial DNA under Various Models of Speci-ation,” In: S. Karlin and E. Nevo, Eds., Evalution Process and Theory, Academic Press, New York, 1986, pp. 515- 534.
[22] N. Takahata and M. Nei, “Gene Genealogy and Variance of Interpopulational Nucleotides Difference,” Genetics, Vol. 110, No. 2, 1985, pp. 325-344.
[23] K. Becker, D. Harmsen, A. Mellmann, M. Christian, P. Schumann, G. Peters and C. von Eiff, “Development and Evaluation of a Quality–Controlled Ribosomal Sequence Database for 16S Ribosomal DNA–Based Identification of Staphylococcus Species,” Journal of clinical Microbi-ology, Vol. 42, No. 11, 2004, pp. 4988-4995.
doi:10.1128/JCM.42.11.4988–4995.2004
[24] A. Y. C. Kwok, et al., “Species Identification and Phy-logenetic Relationships Based on Partial HSP60 Gene Sequences within the Genus Staphylococcus,” Interna-tional Journal of Systematic Bacteriology, Vol. 49, No. 3, 1999, pp. 1181-1192. doi:10.1099/00207713–49–3–1181 [25] M. Palka-Santini, S. Puzfeld, B. E. E. Cleven, M. Kronke
and O. Krut, “Rapid Identification, Virulence Analysis and Resistance Profiling of Staphylococcus aureus by Gene Segment–Based DNA Microarrays: Application to Blood Culture Postprocessing,” Journal of Microbiologi-cal Methods, Vol. 44, No. 7, 2006, pp. 2389-2397. [26] J. E. Clarridge III, “Impact of 16S rRNA Gene Sequence
Analysis for Identification of Bacteria on Clinical Micro-biology and Infectious Diseases,” Clinical Microbiology Review, Vol. 17, No. 4, 2004, pp. 840-862.