Shewhart Control Charts for Monitoring an Automotive Glass Fixing Process
Full text
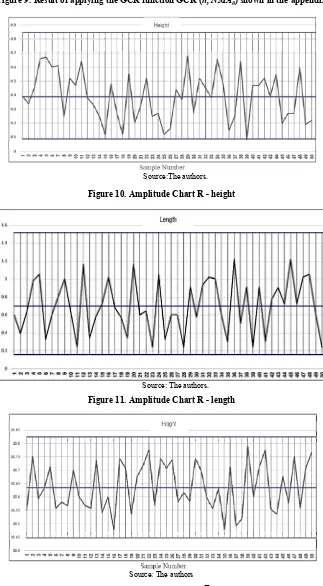
Figure

Related documents
In addition to those who claim Joaquin and Manuel were killed at Cantua Creek, some believe this was the wrong group, although the State paid the Rangers an additional $5,000 bonus
INSTALLATION 3.2 Regular Mounting 3 VOLT LITHIUM BATTERY BACK TAMPER SWITCH (OPTIONAL) SENSOR LEDS RF MODULE FRONT TAMPER SWITCH RANGE SELECT JUMPER LED ON/OFF JUMPER.
Lewis Research Center, “Capabilities and Facilities of the Plum Brook Station,” c1970, NASA Glenn History Collection, Plum Brook Collection, Cleveland,
The existing septic tank and dosing chamber shall be used as a temporary holding tank until the necessary repairs to the soil absorption cell can be achieved. The
The objectives of this study were to (1) examine the effects of field plot size on AGB regression model qual- ity, (2) assess plot boundary effect and its impact on model quality
practical bottom-up assessment of the full range of REDD+ costs, including opportunity, implementation, transaction and institutional costs for three Tanzanian REDD+ pilot
Resettlement has become an almost entirely technical subject (indeed, it has become a highly dull subject, in my opinion, as someone who reads a great deal of research on
We define a name of a tubing on a path and a plumbing leading us to construct the dendriform algebra of the collection of maximal tubings on paths1. Moreover, we give an
