ISSN Online: 1949-5005 ISSN Print: 1949-4998
DOI: 10.4236/health.2019.115049 May 31, 2019 578 Health
Perceptions of Body Mass Index as a Valid
Indicator of Weight Status among Adults in
the United States
Brenden E. Garrett, Joshua H. West, Benjamin T. Crookston, P. Cougar Hall
Department of Public Health, Brigham Young University, Provo, USA
Abstract
Background: Being overweight or obese increases risk for heart disease, stroke, type 2 diabetes, joint disease, and certain cancers. The Body Mass In-dex (BMI) is commonly used to determine weight status. As rates of over-weight and obesity have risen sharply in the United States over the past 30 years, perceptions of a “normal” or healthy weight are subject to change. The purpose of this study was to analyze perceptions of BMI as an indicator of weight status. Methods: An online survey was administered to 376 US adults. The survey collected demographic information including height, weight, and perceived weight status (underweight, healthy weight, overweight and obese). The survey software calculated and presented participants with their personal BMI values. Participants then answered questions about their perception of the BMI as a valid indicator of weight status. Results: More participants re-ported a healthy weight status (51.6%) than were classified as such according to their computed BMI (43.6%). The majority of the sample (85.1%) consi-dered BMI to be a valid indicator of weight status, although perceptions of validity varied by weight status. Participants that perceived BMI to be invalid most commonly cited incongruence with one’s perception of their own body weight, no accounting for unique body shapes, and no accounting for addi-tional muscle mass. Conclusion: BMI is generally perceived to be a valid in-dicator of weight status. These perceptions of validity can vary depending on the individuals’ actual weight status. In instances where perceptions are not favorable toward BMI, it is largely attributable to opinions of incongruence with BMI and body shape, type, or composition. Continued use of BMI as a preliminary tool for determining weight status appears to be accepted. Efforts to increase BMI-related awareness and education may be necessary for indi-viduals that currently see it as invalid.
How to cite this paper: Garrett, B.E., West, J.H., Crookston, B.T. and Hall, P.C. (2019) Perceptions of Body Mass Index as a Valid Indicator of Weight Status among Adults in the United States. Health, 11, 578-591.
https://doi.org/10.4236/health.2019.115049
Received: April 15, 2019 Accepted: May 28, 2019 Published: May 31, 2019
Copyright © 2019 by author(s) and Scientific Research Publishing Inc. This work is licensed under the Creative Commons Attribution International License (CC BY 4.0).
http://creativecommons.org/licenses/by/4.0/
DOI: 10.4236/health.2019.115049 579 Health
Keywords
Body-Mass Index (BMI), Overweight, Obesity, Weight Status
1. Introduction
The World Health Organization (WHO) defines overweight and obesity as ab-normal or excessive fat accumulation that may impair health [1]. Specifically, overweight is defined as a body-mass index (BMI) greater than or equal to 25, while obesity is a BMI greater than or equal to 30. Increasing rates of overweight and obesity represent a primary public health concern globally [2][3]. An esti-mated 1.9 billion adults worldwide, approximately 40% of the adult population, are overweight, with 650 million (13%), of those also classified as obese [1]. In the United States, the percentages are especially prodigious with 71.6% of adults classified as overweight and 39.8% as obese [4]. This predicament represents a public health crisis as both overweight and obesity are strongly associated with metabolic syndrome generally, cardiovascular diseases including heart disease and stroke, diabetes, musculoskeletal diseases including osteoarthritis, and many cancers [2]. Underweight, defined as a BMI less than 18.5, receives far less atten-tion in public health, yet has been associated with higher rates of respiratory, in-testinal, and reproductive problems [5].
The Body Mass Index (BMI) is a computed metric derived from the mass (weight) and height of an individual. It is defined as weight in kilograms divided by the square of height in meters (kg/m2). This calculation yields a score useful
in objectively determining general weight status. BMI categories established by the WHO include: underweight (<18.5), normal weight (18.6 - 24.9), overweight (25.0 - 29.9), and obese (>30) [1]. BMI is best suited for population-level moni-toring and evaluation of weight status and is the same for both sexes and for all ages of adults. While not specifically designed for clinical settings, the compara-tive ease of calculating the BMI has made it a common tool for establishing an individual’s weight status [6]. Criticisms of such use include inattention to varia-tions in body type and body composition. For example, lean athletes often have a high muscle-to-fat ratio and therefore a BMI that is misleadingly high relative to actual percentage of body fat [7]. Despite these limitations, BMI is a common and preliminary tool for general appraisals of weight status and allows health professionals an opportunity to discuss weight concerns more objectively with patients and clients [8].
misper-DOI: 10.4236/health.2019.115049 580 Health
ceptions are prevalent among parents who are unlikely to recognize their over-weight children as overover-weight [10] [11]. Adolescents also struggle in correctly evaluating their weight status as demonstrated by a study of urban low-income African Americans which concluded that one-third of participants did not ap-propriately classify their weight status when asked to do so [12]. Similar studies exploring misperceptions related to weight status have been conducted in Mex-ico [13], Ghana [14], Pakistan [15] and South Korea [16]. Misperceptions related to weight status are potential health threats. Perceiving weight status to be nor-mal when in actuality one is underweight, overweight, or obese prevents needed and healthful behavior change interventions. Similarly, perceiving weight status to be underweight, overweight, or obese when in fact one is a healthy weight may illicit unnecessary stress, anxiety, and unhealthful behavioral weight gain or weight loss strategies. Indeed, studies indicate a strong association between per-ceived weight status and weight control behaviors [17][18]. For these reasons, correct evaluation and perception of weight status have serious implications for individuals as well as medical and public health professionals.
An abundance of research demonstrates discordance between subjectively perceived weight status and objectively measured weight status as determined by the BMI. To date, however, no study has specifically sought to measure an indi-vidual’s subjective agreement with his objectively measured weight status. The purpose of this study was to both measure concordance between perceived weight status and actual weight status as defined by BMI among adults in the United States and identify the level of agreement among self-perceived subjec-tive measures with the objecsubjec-tive BMI measure. In particular, the following re-search questions guided this study: 1) How accurate are American adults in identifying their weight status as determined by BMI? 2) What percentage of adults consider the BMI to be a valid measure for them personally? 3) What are adults’ reasons for considering the BMI an invalid measure of their weight sta-tus?
2. Methods
2.1. Design
This study utilized a cross-sectional survey with questions on demographics, nutritional status, physical and mental health, and perception of BMI as a meas-ure of individual weight status.
2.2. Sample
non-DOI: 10.4236/health.2019.115049 581 Health
sensical values such as highly-improbable height and weight combinations were eliminated, resulting in a final sample of 376 participants.
2.3. Procedure
The Institutional Review Board at Brigham Young University approved this study. An electronic questionnaire created using Qualtrics was distributed through MTurk. A pilot test was conducted before the distribution of the ques-tionnaire to check for item clarity and determine the amount of time needed to complete the questionnaire. An active link to the questionnaire was uploaded to MTurk. All participants provided informed consent and demonstrated that they met the general inclusion criteria before the full survey could be accessed. Par-ticipants received $1.00 (USD) for their participation. The 400 responses were collected in September 2018 after which the questionnaire was removed from MTurk. Data were exported from Qualtrics for cleaning and analysis.
2.4. Instruments
The questionnaire included 24 items. In addition to standard demographic ques-tions, items addressed overall physical health, body height and weight, self-reported levels of weekly physical activity, current body weight objectives (e.g., dieting to lose or gain weight), and perceptions related to how current body weight compares to other adults. Imbedded in the survey was a BMI calcu-lator that provided each participant their own BMI value, based on their self-reported height and weight. Participants were presented with their BMI and then asked if they considered the BMI to be a valid or invalid indicator of their current weight status and the reasoning for this belief.
2.5. Analysis
Stata version 15.0 was used for all data analysis. Descriptive statistics were used to describe the sample, with Chi-square tests used to test for significance and multiple regression analysis to explore associations among key variables.
3. Results
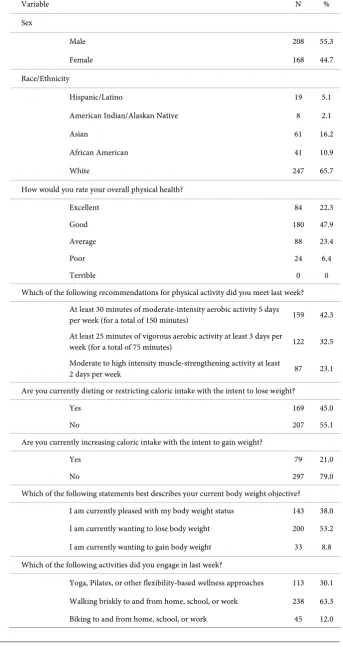
The majority of study participants were male (55.3%), white (65.7%), and re-ported they were in good or excellent health (70.2%) (Table 1). Less than half (45.0%) of respondents were currently dieting while over half (53.2%) currently wanted to lose weight. A small portion (21.0%) were intentionally increasing ca-loric intake to gain weight.
DOI: 10.4236/health.2019.115049 582 Health
Table 1. Demographics, n = 376.
Variable N %
Sex
Male 208 55.3
Female 168 44.7
Race/Ethnicity
Hispanic/Latino 19 5.1
American Indian/Alaskan Native 8 2.1
Asian 61 16.2
African American 41 10.9
White 247 65.7
How would you rate your overall physical health?
Excellent 84 22.3
Good 180 47.9
Average 88 23.4
Poor 24 6.4
Terrible 0 0
Which of the following recommendations for physical activity did you meet last week? At least 30 minutes of moderate-intensity aerobic activity 5 days
per week (for a total of 150 minutes) 159 42.3 At least 25 minutes of vigorous aerobic activity at least 3 days per
week (for a total of 75 minutes) 122 32.5 Moderate to high intensity muscle-strengthening activity at least
2 days per week 87 23.1
Are you currently dieting or restricting caloric intake with the intent to lose weight?
Yes 169 45.0
No 207 55.1
Are you currently increasing caloric intake with the intent to gain weight?
Yes 79 21.0
No 297 79.0
Which of the following statements best describes your current body weight objective? I am currently pleased with my body weight status 143 38.0 I am currently wanting to lose body weight 200 53.2 I am currently wanting to gain body weight 33 8.8 Which of the following activities did you engage in last week?
DOI: 10.4236/health.2019.115049 583 Health
Table 2. Accuracy in identifying weight status as determined by BMI, n = 376.
Relative to your height, do
you consider yourself to be… BMI status Agreement*
Category N % N % N %
Underweight 20 5.3 38 10.1 9 23.7 Healthy weight 194 51.6 164 43.6 131 79.9 Overweight 103 27.4 86 22.9 49 57.0
Obese 39 10.4 42 11.2 13 31.0
Morbidly obese 20 5.3 46 12.2 16 34.8 *Agreement includes individuals that are in a BMI category and correctly report that same category.
Participants with a lower BMI were more likely to believe that BMI was a valid indicator of body weight status (p < 0.012) (Table 3). For example, most (92.1%) participants who were underweight felt BMI was a valid indicator, while 89.6% of healthy weight, 84.9% of overweight, 73.8% of obese, and 73.9% of morbidly obese respondents felt BMI was a valid indicator.
Among the 14.9% of participants who felt BMI was not a valid indicator of weight status, 48.2% felt their BMI weight status was inconsistent with their personal weight status perception and 37.5% felt BMI was not valid for most in-dividuals, did not take into account greater than average muscle mass, or take into account unique body types (Table 4). Other common reasons as to why BMI was not a valid indicator included BMI failing to account for genetics (25.0%) or gender differences (17.9%).
4. Discussion
The purpose of this study was to measure concordance between perceived weight status and actual weight status as defined by BMI among adults in the United States and identify the level of agreement among perceived subjective measures with the objective BMI measure. Questionnaire items were created to measure participants’ accuracy in identifying their weight status as determined by the BMI, to learn what portion of participants considered the BMI to be a va-lid measure for them personally, and to understand participants’ reasons for considering the BMI an invalid measure of their weight status.
While accuracy in predicting weight status varied, more than half of the par-ticipants in this study correctly identified their weight status as determined by BMI. These results are lower than those found by Chang et al.[9] and Mogre et al.[14] who reported that approximately 70% and 80% of participants accurately predicted their weight status respectively. Approximately 57% of overweight and 31% of obese individuals in the current study accurately predicted their weight status. These results are again different from those reported by Chang et al.[9]
DOI: 10.4236/health.2019.115049 584 Health
Table 3. Considering the BMI to be a valid measure personally, n = 376.
BMI is a valid indicator of body weight status
BMI is not a valid indicator of body
weight status Total P 0.012
Underweight N 35 3 38
% 92.1 7.9
Healthy weight N 147 17 164
% 89.6 10.4
Overweight N 73 13 86
% 84.9 15.1
Obese N 31 11 42
% 73.8 26.2
Morbidly obese N 34 12 46
% 73.9 26.1
Total 320 56 376
Table 4. Reasons for considering the BMI an invalid measure, n = 376.
Variable N %
BMI Validity
BMI is a valid indicator of weight status for my body 320 85.1 BMI is not a valid indicator of weight status for my body 56 14.9 Reasons why BMI is not a valid indicator of body weight status N = 56
My body weight status as measured by the BMI is inconsistent with my personal perception of my body weight status 27 48.2
I believe the BMI is not a valid indicator of body weight status for most individuals 21 37.5
While I believe the BMI is a valid indicator of body weight status for most individuals, I believe it is not a valid measure for me personally 9 16.1
The BMI does not take into account my greater than average muscle mass 21 37.5 The BMI does not take into account my greater than average bone density 8 14.3 The BMI does not take into account my greater than average fitness level 9 16.1 The BMI does not take into account my unique body type 21 37.5 The BMI does not take into account my sex or gender 10 17.9 The BMI does not take into account my race or ethnicity 5 8.9 The BMI does not take into account my genetics or hereditary factors 14 25.0
[image:7.595.218.537.355.646.2]assess-DOI: 10.4236/health.2019.115049 585 Health
ing weight status respectively. Despite lower agreement among those classified as obese or morbidly obese in the current study, these findings are generally con-sistent with those from several global settings [13][14][15][20][21] in demon-strating a greater misperception of weight status among overweight and obese individuals considering themselves to be a normal weight. As the incidence of overweight and obesity increases around the world, shifting social norms and related normative beliefs present a public health challenge as overweight and obese individuals become less likely to consider their weight problematic, seek subsequent medical attention, or engage in health behavior change efforts. Social norms have been shown to be powerful predictors of behavioral intentions and subsequent behavior change [22]. An increasingly high prevalence of overweight individuals creates a situation where overweight may be perceived as normative. This perceived norm has the potential to further increase misperceptions and decrease both awareness of body weight status and the need for behavior change efforts. It is also highly plausible that as overweight and obesity become increa-singly normative, the BMI will increaincrea-singly be perceived as less valid.
The current study also sought to understand what percentage of participants personally considered the BMI to be a valid indicator of weight status. While the agreement with weight status as determined by the BMI generally decreased as weight status increased from underweight to morbidly obese, the vast majority of participants in the current study considered the BMI to be a valid measure for them personally. Deficiencies of the BMI have been well publicized and include a lack of sensitivity to ethnicity, sex, age and body composition [7]. The BMI is limited in that it does not directly measure an individual’s body composition, the ratio of lean tissue to adipose tissue, or the distribution/location of adipose tissue within the body. Rothman notes these important limitations create misclassifica-tion problems and bias, especially when used to predict and quantify the various health risks of overweight and obesity [7]. Despite these limitations, the Centers for Disease Control and Prevention (CDC) note the utility of the BMI as a measure to track weight status in populations [23]. For individuals and clinical settings, the BMI serves as an inexpensive and non-invasive initial screening tool. Within the context of recent and dramatic population increases in over-weight and obesity, attention paid to limitations of the BMI, while important, may cause individuals and groups to unnecessarily rationalize or discredit BMI results. Results showing that most participants in this study consider the BMI to be a valid measure of their body weight status are thus encouraging. False posi-tives related to BMI classifications, especially for those categorized as overweight or obese and which lead one to seek additional and increasingly accurate health assessments, can be considered an acceptable outcome of this imperfect measure.
DOI: 10.4236/health.2019.115049 586 Health
been noted, many individuals are poor at subjectively estimating their own body weight status [24][25]. As individuals incorrectly evaluate their weight status to be more or less healthy than it actually is, they are naturally prone to disagree with information and assessments which contradict their beliefs. The rejection of new information contradicting one’s ideas may reflect a cognitive bias known as Semmelweis Reflex [26] [27], where contradictions to a current paradigm are grounds for immediate dismissal of new information. It is interesting, therefore, that this was the most commonly stated reason for disagreeing with the BMI in this study. Many participants in this study who considered the BMI to be perso-nally invalid also felt it was invalid for all people, while far fewer reported the BMI to be valid for most individuals, just not them personally. A cognitive error known as illusory superiority helps explain an individual’s tendency to overes-timate their own qualities when compared to others and is helpful in interpret-ing these findinterpret-ings [28].
phenome-DOI: 10.4236/health.2019.115049 587 Health
non, some argue that focus should be placed on physical activity, exercise, and cardiorespiratory fitness, instead of on weight status [47], while others contend the strong association between weight status and health outcomes maintains the value of such measures [49]. Another way fitness level may influence BMI is in-directly through increased muscle mass and decreased fatty tissue. As exercise helps to determine the ratio of fat-free or lean tissue to fat tissue, fitness can in-directly lead to higher BMI values [7]. Considering each of these variables and the subsequent limitations of the BMI in accounting for them, perhaps the low percentage of participants in this study considering the BMI to be invalid is noteworthy.
Limitations
These results should be considered in light of several study limitations. This study used self-reported height and weight in calculating BMI scores. While self-report is common in social science, this methodology is prone to error. The current study has limited generalizability provided that the study sample con-sisted of Amazon MTurk platform users who self-selected for participation and do not represent the general population. Finally, because this study was funded by a modest $500 undergraduate studies mentoring grant the size of the study sample was limited which may have impacted the results. Despite these limita-tions, the current study provides unique insights relative to perceived weight status and perceived validity of the BMI. Future studies may consider collecting heights and weights in a clinical setting to ensure greater precision of measure-ment and subsequent accuracy of BMI scores. Finally, understanding why par-ticipants do or do not consider the BMI to be a valid indicator of weight status may be better understood using qualitative approaches such as interviews or fo-cus groups.
5. Conclusion
This study aimed to understand perceptions of body weight status as objectively measured using the BMI and reasons for considering the BMI to be an invalid indicator of weight status. Findings indicate that many U.S. adults are inaccurate in subjectively classifying their own weight status. While other studies have ex-plored the effectiveness of the BMI in determining body fat percent and how in-accurate people are in estimating their own BMI weight category, the current study was unique in that it sought to determine what portion of adults agree with the BMI personally, and what reasons people have for disagreement. These findings may help healthcare professionals to better promote healthy behaviors by understanding who is most likely to consider the BMI invalid and why.
Acknowledgements
DOI: 10.4236/health.2019.115049 588 Health
Conflicts of Interest
The authors declare no conflicts of interest regarding the publication of this pa-per.
References
[1] World Health Organization (WHO) (2018) Obesity and Overweight. https://www.who.int/news-room/fact-sheets/detail/obesity-and-overweight
[2] Di Angelantonio, E., Bhupathiraju, S., et al. (Global BMI Mortality Collaboration) (2016) Body-Mass Index and All-Cause Mortality: Individual-Participant-Data Me-ta-Analysis of 239 Prospective Studies in Four Continents. The Lancet, 388, 776-786. https://doi.org/10.1016/S0140-6736(16)30175-1
[3] Ng, M., Fleming, T., Robinson, M., et al. (2014) Global, Regional, and National Prevalence of Overweight and Obesity in Children and Adults during 1980-2013: A Systematic Analysis for the Global Burden of Disease Study 2013. The Lancet, 384, 766-781. https://doi.org/10.1016/S0140-6736(14)60460-8
[4] Hales, C., Carroll, M., Fryar, C. and Ogden C. (2017) Prevalence of Obesity among Adults and Youth: United States, 2015-2016. NCHS Data Brief, National Center for Health Statistics, Hyattsville, MD.
[5] Lusky, A., Barell, V., Lubin, F., Kaplan, G., Layanizipora, V., Boaz, S. and Wiener, M. (1996) Relationship between Morbidity and Extreme Values of Body Mass Index in Adolescents. International Journal of Epidemiology, 25, 829-834.
https://doi.org/10.1093/ije/25.4.829
[6] Perrin, E., Flower, K. and Ammerman, A. (2004) Body Mass Index Charts: Useful Yet Underused. The Journal of Pediatrics, 144, 455-460.
https://doi.org/10.1016/j.jpeds.2004.01.047
[7] Rothman, K. (2008) BMI-Related Errors in the Measurement of Obesity. Interna-tional Journal of Obesity,32, S56-S59. https://doi.org/10.1038/ijo.2008.87
[8] Pietrobelli, A., Faith, M., Allison D., Gallagher, D., Chiumello, G. and Heymsfield, S. (1998) Body Mass Index as a Measure of Adiposity among Children and Adoles-cents: A Validation Study. Journal of Pediatrics, 132, 204-210.
https://doi.org/10.1016/S0022-3476(98)70433-0
[9] Chang, V. and Christakis, N. (2003) Self-Perception of Weight Appropriateness in the United States. American Journal of Preventive Medicine, 24, 332-339.
https://doi.org/10.1016/S0749-3797(03)00020-5
[10] Doolen, J., Alpert, P. and Miller, S. (2009) Parental Disconnect between Perceived and Actual Weight Status of Children: A Metasynthesis of the Current Research.
Journal of the American Academy of Nurse Practitioners, 21, 160-166. https://doi.org/10.1111/j.1745-7599.2008.00382.x
[11] Eckstein, K., Mikhail, L., Ariza, A., Thomson, J., Millard, S. and Binns, H. (2006) Pediatric Practice Research Group. Parents’ Perceptions of Their Child’s Weight and Health. Pediatrics, 117, 681-690. https://doi.org/10.1542/peds.2005-0910 [12] Wang, Y., Liang, H. and Chen, X. (2009) Measured Body Mass Index, Body Weight
Perception, Dissatisfaction and Control Practices in Urban, Low-Income African American Adolescents. BMC Public Health,9, 183.
https://doi.org/10.1186/1471-2458-9-183
DOI: 10.4236/health.2019.115049 589 Health [14] Mogre, V., Mwinlessna, P. and Oladele, J. (2013) Distorted Self-Perceived Weight
Status and Its Associated Factors among Civil Servant in Tamale, Ghana: A Cross-Sectional Study. Archives of Public Health, 71, 30.
https://doi.org/10.1186/2049-3258-71-30
[15] Bhanji, S., Khuwaja, A., Siddiqui, F., Aza, I. and Kazmi, K. (2011) Under-Estimation of Weight and Its Associated Factors among Overweight and Obese Adults in Pa-kistan: A Cross Sectional Study. BMC Public Health, 11, 363.
https://doi.org/10.1186/1471-2458-11-363
[16] Lim, H. and Wang, Y. (2013) Body Weight Misperception Patterns and Their Asso-ciation with Health-Related Factors among Adolescents in South Korea. Obesity, 21, 2596-2603. https://doi.org/10.1002/oby.20361
[17] Riley, N., Bild, D., Cooper, L., et al. (1998) Relation of Self-Image to Body Size and Weight Loss Attempts in Black Women. American Journal of Epidemiology, 148, 1062-1068. https://doi.org/10.1093/oxfordjournals.aje.a009583
[18] Strauss, R. (1999) Self-Reported Weight Status and Dieting in a Cross-Sectional Sample of Young Adolescents: National Health and Nutrition Examination Survey III. Archives of Pediatric and Adolescent Medicine, 153, 741-747.
https://doi.org/10.1001/archpedi.153.7.741
[19] Van Minnen, K., Davis, W., Bruce, D. and Davis, T. (2011) Accuracy, Determinants, and Consequences of Body Weight Self-Perception in Type 2 Diabetes: The Fre-mantle Diabetes Study. Journal of Diabetes and Its Complications, 25, 1-6. https://doi.org/10.1016/j.jdiacomp.2009.11.001
[20] Guitierrez-Fisac, L., Garcia, E.L., Rodriguez-Artalejo, F., Banegas, J. and Gual-lar-Castillon, F. (2002) Self-Perception of Being Overweight in Spanish Adults. Eu-ropean Journal of Clinical Nutrition, 56, 866-872.
https://doi.org/10.1038/sj.ejcn.1601404
[21] Howard, N., Hugo, G, Taylor, A. and Wilson, D. (2008) Our Perception of Weight: Socioeconomic and Sociocultural Explanations. Obesity Research and Clinical Prac-tice, 2, 125-131. https://doi.org/10.1016/j.orcp.2008.03.003
[22] Ajzen, I. (1991) The Theory of Planned Behavior. Organizational Behavior and Human Decision Processes, 50, 179-211.
https://doi.org/10.1016/0749-5978(91)90020-T
[23] Centers for Disease Control and Prevention (CDC) (2018) Body Mass Index. https://www.cdc.gov/healthyweight/assessing/bmi/index.html
[24] Kuchler, F. and Variyam, J. (2003) Mistakes Were Made: Misperception as a Barrier to Reducing Overweight. International Journal of Obesity,27, 856-861.
https://doi.org/10.1038/sj.ijo.0802293
[25] Wetmore, C. and Mokdad, A. (2012) In Denial: Misperceptions of Weight Change among Adults in the United States. Preventive Medicine,55, 93-100.
https://doi.org/10.1016/j.ypmed.2012.04.019
[26] László, R. (2018) The Savior of Mothers and Newborns, Whom We Shall Always Be Proud of Ignác Semmelweis (1818-1865). One Who Defeated the Disease, Yet Could Not Convince the People, Doctor of Medical Sciences and Surgery, Master of Obstetrics, Professor of Theoretical and Practical Obstetrics at the Pest Royal Hun-garian University of Sciences. Orvosi Hetilap, 159, 1041-1054.
[27] Mangione1, S. and Vu, A. (2018) Semmelweis at 200: Creativity, Skepticism and Charm in Medicine. Medicina Historica, 2, 82-84.
DOI: 10.4236/health.2019.115049 590 Health [29] Evans, B., and Colls, R. (2009) Measuring Fatness, Governing Bodies: The Spatialities
of the Body Mass Index (BMI) in Anti-Obesity Politics. Antipode, 41, 1051-1083. https://doi.org/10.1111/j.1467-8330.2009.00706.x
[30] Snijder, M., Kuyf, B. and Deurenberg, P. (1999) Effect of Body Build on the Validity of Predicted Body Fat from Body Mass Index and Bioelectrical Impedance. Annals of Nutrition and Metabolism, 43, 277-285. https://doi.org/10.1159/000012795 [31] Deurenberg, P., Yap, M. and van Staveren, W. (1998) Body Mass Index and Percent
Body Fat: A Meta Analysis among Different Ethnic Groups. International Journal of Obesity, 22, 1164-1171. https://doi.org/10.1038/sj.ijo.0800741
[32] Gallagher, D., Visser, M., Sepúlveda, D., Pierson, R.N., Harris, T. and Heymsfield., S.B. (1996) How Useful Is Body Mass Index for Comparison of Body Fatness across Age, Sex, and Ethnic Groups? American Journal of Epidemiology, 143, 228-239. https://doi.org/10.1093/oxfordjournals.aje.a008733
[33] Heo, M., Faith, M., Pietrobelli, A. and Heymsfield, S. (2012) Percentage of Body Fat Cutoffs by Sex, Age, and Race-Ethnicity in the US Adult Population from NHANES 1999-2004. American Journal of Clinical Nutrition, 95, 594-602.
https://doi.org/10.3945/ajcn.111.025171
[34] Jackson, A., Stanforth, P., Gangon, J., et al. (2002) The Effect of Sex, Age and Race on Estimating Percentage Body Fat from body Mass Index: The Heritage Family Study. International Journal of Obesity, 26, 789-796.
https://doi.org/10.1038/sj.ijo.0802006
[35] Ranasinghe, C., Gamage, P., Katulanda, P., Andraweera, N., Thilakarathne, S. and Tharanga, P. (2013) Relationship between Body Mass Index (BMI) and Body Fat Percentage, Estimated by Bioelectrical Impedance, in a Group of Sri Lankan Adults: A Cross Sectional Study. BMC Public Health, 13, 797.
https://doi.org/10.1186/1471-2458-13-797
[36] Deurenberg-Yap, M., Schmidt, G., van Staveren W.A. and Deurenberg, P. (2000) The Paradox of Low Body Mass Index and High Body Fat Percentage among Chinese, Malays and Indians in Singapore. International Journal of Obesity,24, 1011-1017. https://doi.org/10.1038/sj.ijo.0801353
[37] Lear, S., Humphries, K., Kohli, S. and Birmingham, C. (2007) The Use of BMI and Waist Circumference as Surrogates of Body Fat Differs by Ethnicity. Obesity, 15, 2817-2824. https://doi.org/10.1038/oby.2007.334
[38] Rush, E., Freitas, I. and Plank, L. (2009) Body Size, Body Composition and Fat Dis-tribution: Comparative Analysis of European, Maori, Pacific Island and Asian In-dian Adults. British Journal of Nutrition, 102, 632-641.
https://doi.org/10.1017/S0007114508207221
[39] Wang, J., Thornton, J., Russell, M., Burastero, S., Heymsfield, S. and Pierson, R. (1994) Asians Have Lower Body Mass Index (BMI) but Higher Percent Body Fat than Do Whites: Comparisons of Anthropometric Measurements. American Jour-nal of Clinical Nutrition, 60, 23-28. https://doi.org/10.1093/ajcn/60.1.23
[40] Beydoun, M. and Wang, Y. (2009) Gender-Ethnic Disparity in BMI and Waist Cir-cumference Distribution Shifts in US Adults. Obesity, 17, 169-176.
https://doi.org/10.1038/oby.2008.492
[41] Chiu, M., Austin, P., Manuel, D., Shah, B. and Tu, J. (2011) Deriving Ethnic-Specific BMI Cutoff Points for Assessing Diabetes Risk. Diabetes Care, 34, 1741-1748. https://doi.org/10.2337/dc10-2300
DOI: 10.4236/health.2019.115049 591 Health and Insulin Resistance in Adults. Diabetes Care, 32, 683-687.
https://doi.org/10.2337/dc08-1638
[43] Blüher, S. and Schwarz, P. (2014) Metabolically Healthy Obesity from Childhood to Adulthood—Does Weight Status Alone Matter? Metabolism, 63, 1084-1092. https://doi.org/10.1016/j.metabol.2014.06.009
[44] Brochu, M., Tchernof, A., Dionne, I., et al. (2001) What Are the Physical Characte-ristics Associated with a Normal Metabolic Profile despite a High Level of Obesity in Postmenopausal Women? Journal of Clinical Endocrinology and Metabolism, 86, 1020-1025. https://doi.org/10.1210/jc.86.3.1020
[45] Bunn, J., Eustace, D., Miskech, T. and Jiroutek, M. (2018) The “Fit But Fat” Con-cept: A Re-Evaluation of National Health Data. Medicine & Science in Sports & Ex-ercise, 50, 75. https://doi.org/10.1249/01.mss.0000535330.50578.3f
[46] Cadenas-Sanchez, C., Ortega, F. and Migueles, J. (2019) Further Evidence on Car-diorespiratory Fitness as a Key Factor for the Metabolically Healthy Obese Pheno-type Independent of Race. Journal of Adolescent Health, 64, 290-291.
https://doi.org/10.1016/j.jadohealth.2018.12.014
[47] Lavie, C., Ortega, F. and Kokkinos, P. (2018) Impact of Physical Activity and Fitness in Metabolically Healthy Obesity. Journal of the American College of Cardiology, 71, 812-813. https://doi.org/10.1016/j.jacc.2017.10.106
[48] Ortega, F., Lee, D., Katzmarzyk, P., et al. (2013) The Intriguing Metabolically Healthy but Obese Phenotype: Cardiovascular Prognosis and Role of Fitness. Euro-pean Heart Journal, 34, 389-397. https://doi.org/10.1093/eurheartj/ehs174
[49] Guo, F. and Garvey, W. (2016) Trends in Cardiovascular Health Metrics in Obese Adults: National Health and Nutrition Examination Survey (NHANES), 1988-2014.