ISSN Online: 2164-0408 ISSN Print: 2164-0386
DOI: 10.4236/ape.2019.94015 Sep. 10, 2019 215 Advances in Physical Education
Neural Network Algorithm in Predicting
Football Match Outcome Based on Player
Ability Index
Hengzhi Chen
Bashu Secondary School, Chongqing, China
Abstract
Nowadays, when people want to predict the result of a football match, most of them just refer to their own experience or some specialists’ opinions. However, since artificial intelligence is very good at analyzing big data, it is more and more used to predict the result instead of one’s experience in order to approach the accuracy. There are three typical algorithms—convolutional neural network (ANN), random forest (RF) and support vector machine (SVM). In this paper, these three algorithms are all applied to predict the re-sult of a football match, and the accuracy of them is also compared.
Keywords
Convolutional Neural Network, Football Match Prediction, FIFA
1. Introduction
Since football is becoming more and more popular worldwide, football gambling also develops very fast. Since casinos always want to make the largest benefit in this area, a high performance of football result prediction is required. However, if the prediction is just based on one’s experience, it cannot be very accurate since the workload of analyzing all the data of players in two teams and matches between two teams is too heavy for people and the result is somehow subjective. Under this situation, using artificial intelligence to predict the results becomes a good solution. Artificial intelligence is absolutely objective, and it has a great ability in calculating and analyzing huge amounts of data to generate the best prediction. Havard Rue and Oyvind Salvesen collect the data of all the matches in Premier League during 1997-1998 season, and then they use the Bias dynamic generalized linear model to predict the final rank, which gives very good results. How to cite this paper: Chen, H. Z.
(2019). Neural Network Algorithm in Pre-dicting Football Match Outcome Based on Player Ability Index. Advances in Physical Education, 9, 215-222.
https://doi.org/10.4236/ape.2019.94015
Received: August 29, 2019 Accepted: September 7, 2019 Published: September 10, 2019
Copyright © 2019 by author(s) and Scientific Research Publishing Inc. This work is licensed under the Creative Commons Attribution International License (CC BY 4.0).
H. Z. Chen
DOI: 10.4236/ape.2019.94015 216 Advances in Physical Education
Patrick Lucey studies the relationship between the goals and the shooting posi-tion as well as the strength of defense. Artificial Intelligence has been widely ap-plied to predict match outcomes. Shi et al.investigated the usefulness of machine learning for the prediction of college basketball outcomes and found that feature selection is very important when building up machine learning models (Shi et
al., 2013). Loeffelholz et al. applied neural network to predict NBA games and
their trained models beat basketball experts on game prediction (Loeffelholz et al., 2009). Jain et al. integrated fuzzy approach and SVM to develop a hybrid fuzzy-SVM algorithm and applied it to forecast basketball match outcomes (Jain & Kaur,2017). Bayesian nets were applied to predict football results in Joseph et al.’s work (Joseph et al., 2006). Lucey et al.used logistic regression on engineered features and achieved improved expected goal value Lucey et al., 2014). Naïve Bayes, compared to multivariate linear regression, was proved to have better performance in predicting basketball matches outcomes (Miljković et al., 2010). Random forest was studied and applied to estimate the win probability for NFL games (Lock & Nettleton, 2014). Domain knowledge was incorporated in ex-treme gradient boosted trees and the investigation showed that domain know-ledge is important to improve the prediction accuracies (Berrar et al.,2019).
Furthermore, Cho et al. proposed a framework combining social network analysis and gradient boosting to predict soccer game outcomes and obtained improved results (Cho et al., 2018). So far, random forest and support vector machine have not been fully investigated and tested on soccer match outcome prediction. In this paper, the neural network algorithm, the random forest algo-rithm and the support vector machine algoalgo-rithm are all used to predict the re-sults of the matches in Spain La Liga. All the data are collected from the FIFA website.
2. Theoretical Background
Football is a complex exercise, and many factors are related to the final result. Hence, there always exist some amazing results, which is because of some un-predictable reasons. For example, some players may get injured and have to leave the match, which cannot be predicted before. Hence, we need to focus on the data which is objective and controllable, such as the data of the starters’ abil-ity.
2.1. Data Analysis
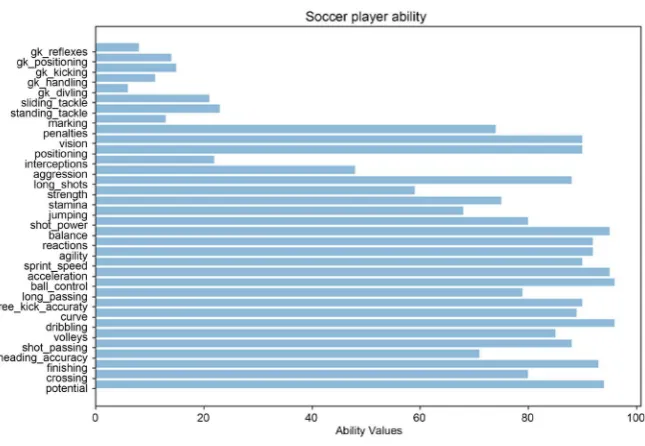
The data (From FIFA Official Website) of the starters’ ability are given on FIFA website, which is calculated according to their historical performance, including success rate of passing, the success rate of shooting, the success of controlling and so on (Figure 1).
DOI: 10.4236/ape.2019.94015 217 Advances in Physical Education
Figure 1. Soccer player ability.
them, and then use this data to predict the result of the match by artificial intel-ligence.
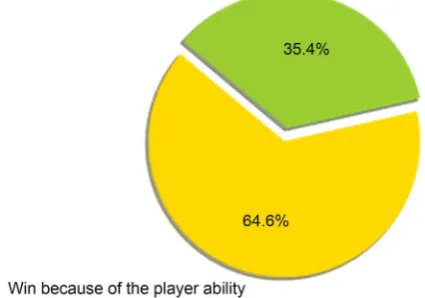
The ability of players’ is just a part of the factors which influence the result of the match. As Figure 2 shows, considering the matches in La Liga during 2008/2009 season to 2015/2016 season, we can see that 35.4% matches are not determined by players’ ability. Therefore, we must consider other important factors such as the coach, which is related to the morale of the team very much. A good coach can make the team unite and powerful, while a bad coach will make the team messy and depressed. However, the ability of a coach and the morale of a team are very difficult to quantify, and the coach of a team may be changed very frequently due to many complex reasons such as the bad fitness between the coach and the team manager. So, FIFA doesn’t give the data of a coach’s ability or a team’s morale. In this paper, this reason will not be consi-dered, either.
The lack of such data will not affect the prediction a lot. In fact, if a result is mainly due to the coach or the team’s morale, it will be an outlier, and such out-liers will be considered in the program.
2.2. Other Factors
H. Z. Chen
[image:4.595.225.438.85.234.2]DOI: 10.4236/ape.2019.94015 218 Advances in Physical Education
Figure 2. Ratio of wining by player ability and not by player ability.
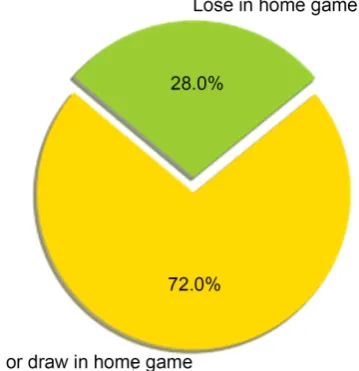
will not be considered in this paper. What’s more, whether the match is a home game is also a important factor. There are 19 teams in La Liga, and each team will fight with others twice in one season—one home game and one away game. If a team play at home, the environment is familiar and most audience will cheer and applause for them, which will excite the players and boost their morale; if a team play as guest, the situation will be opposite—their stress will increase a lot and their morale will decrease. Hence, in this paper, the data of the players’ abil-ity already include this factor—we will both consider a player’s abilabil-ity when he plays at home and as guest. The program will also distinguish if a team is playing at home or as guest. The rate of win and draw in home games during 2008/2009 season to 2015/2016 season in La Liga is shown in Figure 3.
There is still a lack of data of some players in La Liga. However, the number of players is less than 15, so it will not affect the prediction a lot. We will use the average ability point 72.6 for them.
3. Model and Experiment
For each model, we input the data of 22 players in two teams in one match. The output is “win”, “draw” and “lose”.
3.1. Support Vector Machine
First, we set the kernel as polynomial. However, the correct rate is only 0.503, which is below our expectation.
(
γ x x, ′ +r)
d (1)Then we set the kernel as linear, the correct rate increases to 0.542, which is acceptable.
,
x x′ (2)
3.2. Random Forest
DOI: 10.4236/ape.2019.94015 219 Advances in Physical Education
Figure 3. Ratio of wining or drawing and losing in home game.
factors and vote for the result, which will decrease the bias. We try different numbers of trees, and then we find that when the number is between 400 and 800, the result is the best, and the correct rate will reach 0.520.
Then we set the largest depth of each tree as 3, and the correct rate increases to 0.545.
3.3. Neural Network
For the neural network algorithm, we choose the convolution neural network to predict the result.
Firstly, traditional convolution neural network has six layers to process the data, but we only use four layers in this paper—two convolution layers, one pooling layer and one full connection layer. The purpose is to avoid overfitness. Since convolution neural network is better at processing one-hot problem than pure classification problem, we will write “win” as (0, 0, 1), “draw” as (0, 1, 0) and “lose” as (0, 0, 1). However, we should notice that this method is not suita-ble for random forest algorithm. The reason is that each tree will determine whether the result is 0 or 1 for all three points, and the output may be (0, 0, 0) or (1, 1, 1), which is meaningless. In convolution neural network algorithm, we set batch size as 80, learning rate base as 0.30, learning rate decay as 0.999 and regulization rate as 0.0020, training steps as 400, and moving average decay as 0.85. This will give the best result, and the correct rate is floating between 0.533 and 0.574, which means the prediction is not very stable. However, in this paper, we do not discuss the stability of the correct rate, so we just take 0.574 as the final result.
4. Conclusion and Discussion
H. Z. Chen
[image:6.595.211.536.78.256.2]DOI: 10.4236/ape.2019.94015 220 Advances in Physical Education
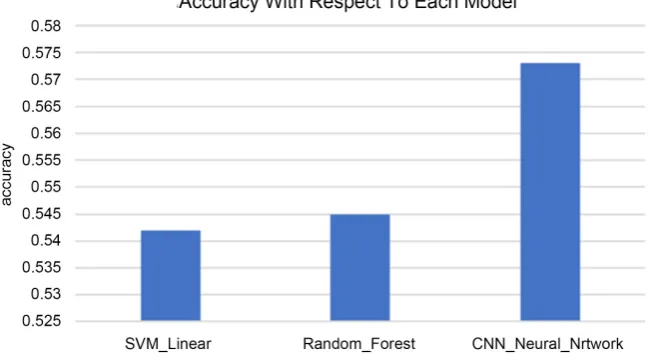
Figure 4. Accuracy with respect to each model.
The accuracy of these three methods is all between 54% and 58%. They are all acceptable since they are all higher than the prediction accuracy of the famous football analyst of BBC, Mark Lawrenson, which is only 52%. In addition, the accuracy of the convolution neural network is higher than the prediction accu-racy of the authoritative football gambling organization Pinnacle Sports, which is only 55%. In these three algorithms, convolution neural network performs the best.
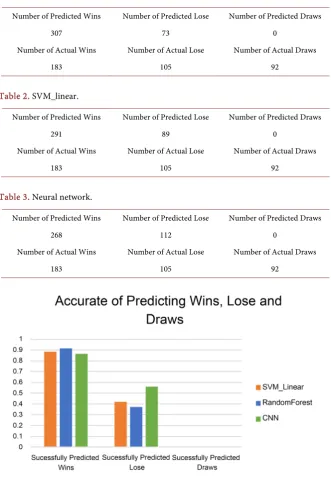
However, in all three algorithms, they seldom predict “draw”. This is because the number of “draw” games is much less than that of “win” games or “lose” games. The match between a stronger team and a weaker team seldom results in “draw”, so we may attribute a draw game mostly to strategy and morale factors, which will not be considered in this paper. This is also mentioned in Ben Ul-mer’s paper. We can also see that the “lose” prediction is less than the “win” prediction, and this is because the “lose” games are less than the “win” games in the training model (Tables 1-3).
In addition, we can also see that these three algorithms have different predic-tion ability for “win”, “draw” and “lose”. Random forest has the best ability to predict “win” and convolution neural network has the best ability to predict “lose”. All three algorithms are not able to predict “draw” correctly (Figure 5).
Although the accuracy of these three methods is acceptable, it can be more approved since we only consider the data of players’ ability. In the future, the data of teams (the coaches’’ ability and the teams’ morale) can be also consi-dered. For example, if a team has consecutive wins recently, its morale may be increased a lot. To quantify a team’s morale, considering its recent match results is a good idea. More inputs will deepen the analysis of the data and thus improve accuracy.
DOI: 10.4236/ape.2019.94015 221 Advances in Physical Education
Table 1. Random forest.
Number of Predicted Wins Number of Predicted Lose Number of Predicted Draws
307 73 0
Number of Actual Wins Number of Actual Lose Number of Actual Draws
183 105 92
Table 2. SVM_linear.
Number of Predicted Wins Number of Predicted Lose Number of Predicted Draws
291 89 0
Number of Actual Wins Number of Actual Lose Number of Actual Draws
183 105 92
Table 3. Neural network.
Number of Predicted Wins Number of Predicted Lose Number of Predicted Draws
268 112 0
Number of Actual Wins Number of Actual Lose Number of Actual Draws
[image:7.595.214.528.322.562.2]183 105 92
Figure 5. Accurate of predicting wins, lose and draws.
also achieves good prediction accuracy. Studying and comparing more algo-rithms will let us find the best algorithm to predict the results of football matches.
Conflicts of Interest
The authors declare no conflicts of interest regarding the publication of this pa-per.
References
Ma-H. Z. Chen
DOI: 10.4236/ape.2019.94015 222 Advances in Physical Education
chine Learning for Soccer Outcome Prediction. Machine Learning, 108, 97-126.
https://doi.org/10.1007/s10994-018-5747-8
Cho, Y., Yoon, J., & Lee, S. (2018). Using Social Network Analysis and Gradient Boosting to Develop a Soccer Win-Lose Prediction Model. Engineering Applications of Artificial Intelligence, 72, 228-240. https://doi.org/10.1016/j.engappai.2018.04.010
Jain, S., & Kaur, H. (2017). Machine Learning Approaches to Predict Basketball Game Outcome. In 2017 3rd International Conference on Advances in Computing, Commu-nication & Automation (ICACCA) (pp. 1-7). Dehradun, India.
https://doi.org/10.1109/ICACCAF.2017.8344688
Joseph, A., Fenton, N. E., & Neil, M. (2006). Predicting Football Results Using Bayesian Nets and Other Machine Learning Techniques. Knowledge-Based Systems, 19,
544-553. https://doi.org/10.1016/j.knosys.2006.04.011
Lock, D., & Nettleton, D. (2014). Using Random Forests to Estimate win Probability be-fore Each Play of an NFL Game. Journal of Quantitative Analysis in Sports, 10,
197-205. https://doi.org/10.1515/jqas-2013-0100
Loeffelholz, B., Bednar, E., Bauer, K. W. (2009). Predicting NBA Games Using Neural Networks. Journal of Quantitative Analysis in Sports, 5, 7.
https://doi.org/10.2202/1559-0410.1156
Lucey, P., Bialkowski, A., Monfort, M., Carr, P., & Matthews, I. (2014). Quality vs Quan-tity: Improved Shot Prediction in Soccer Using Strategic Features from Spatiotemporal Data. In Proceedings of 8th Annual MIT Sloan Sports Analytics Conference (pp. 1-9). Miljković, D., Gajić, L., Kovačević, A., & Konjović, Z. (2010). The Use of Data Mining for
Basketball Matches Outcomes Prediction. In IEEE 8th International Symposium on Intelligent Systems and Informatics (pp. 309-312). Subotica, Serbia.
https://doi.org/10.1109/SISY.2010.5647440