Munich Personal RePEc Archive
Geographical Distributions and
Equilibrium in Social Norm-Related
Behavior in the United States
Coleman, Stephen
Metropoilitan State University
December 2018
Online at
https://mpra.ub.uni-muenchen.de/96207/
Geographical Distributions and Equilibrium in Social Norm-Related
Behavior in the United States
Dr. Stephen Coleman
Research Director and Professor, retired Center for Applied Research and Policy Analysis Metropolitan State University, St. Paul, Minnesota.
Minneapolis, MN 55410 USA
E-mail: Dr.StephenColeman@gmail.com
Geographical Distributions and Equilibrium in Social Norm-Related
Behavior in the United States
Abstract
This research examines the geographical distribution of behavior in line with social norms that are spread and maintained primarily by the effect of social conformity. These include widely held norms that good citizens vote, don’t commit crimes, get flu
vaccinations, abstain from binge drinking, and comply with census reporting. A partial differential equation model is used to determine whether such behavior may have attained a geospatial equilibrium in the United States. An equilibrium, as the end state of a
diffusion process, has definitive mathematical properties that can be used to test for equilibrium. This is done using recent data for the 48 contiguous states. Results confirm that behavior for several important social norms fits the equilibrium model
geographically. Policy implications are briefly discussed.
Geographical Distributions and Equilibrium in Social Norm-Related
Behavior in the United States
The focus of this analysis is the contemporary geographic distribution in the United States of a variety of behaviors that follow widely held social norms. These social norms, in turn, are maintained and spread by the influence of social conformity. When people see
or learn about others’ behavior, they often begin to act like others because of their
propensity for social conformity. The prevalent behavior then becomes the normative standard. Many people also conform their behavior to widely held public values, such as the norm that good citizens should vote in elections (Cialdini, 1993; Coleman, 2007a). In both cases, as Cialdini reports, people are increasingly likely to conform with others as the proportion of other people doing something increases. Even the thought that relatively more people are doing something is enough to prompt conformist behavior in many individuals. This is a self-limiting process, however, as not everyone can be brought into conformity. Conformity is not the only mechanism for the spread of social behaviors; people get information and ideas through personal contact and by learning from others. But only conformity directly involves large social groups and populations.
Recent studies on conformity show important spatial effects. The willingness of people to comply with a norm, such as voting, recycling, obeying laws, or giving to charity, can vary significantly from place to place (Coleman, 2007a). And the degree of conformity with a norm can change when people in one area are influenced by the behavior of people in other locations. In a natural social context the influence of conformity on an individual is related to the distance from other people as well as to the relative number of people who may express a position or behavior. The joint influence of a group increases with a power function of the number (usually an exponent of about 0.5), but decreases
approximately with the square of the distance to the individual (Nowak and Vallacher, 1998: 225).
Here the analysis examines geospatial models for several behaviors that may be strongly affected by social conformity: voter turnout in a U.S. presidential election; binge
drinking; timely census reporting; weekly churchgoing; influenza vaccination, the rate of aggravated assaults, and income tax compliance. The units of analyses are the 48
contiguous American states. Specifically, voter turnout is the percentage of those voting among the age-eligible population in 2008.1 Binge drinking, as measured in 2004 in a survey by the Centers for Disease Control, is the percentage of adults who had five or more drinks on one occasion.2 Timely census reporting refers to the percentage of households who voluntarily responded to the 2000 Census before census workers had to
contact them.3 Vaccination rate in 2009 is the percentage of adults vaccinated against H1N1 influenza by the end of January 2010, as estimated in a survey of the Department of Health and Human Services.4 Weekly or almost weekly churchgoing percentage from 2004 to 2006 was determined by the Gallup Poll.5 Aggravated assaults are the most common violent crime, usually involving serious bodily harm; the rate is per 100,000 population in 2008, as reported by local jurisdictions to the FBI.6 Tax compliance is the average percentage income from 1982 to1991 fully reported on federal income tax filings, as reported by the Internal Revenue Service.7
Research backs up the connection between these social behaviors and social conformity. People vote mainly because of the widely held norm that good citizens should vote (Blais, 2000; Coleman, 2004), and social pressure or information about others’ voting behavior can increase voting participation (Knack, 1992; Gerber, Green, and Larimer, 2008; Gerber and Rogers, 2009). Moreover, people collectively tend to behave with a consistent degree of conformity in different situations, such as voting, abstaining from committing crimes, giving to charity, and answering the census. Knack and Kropf (1998) show this at the county level and Coleman (2002, 2007a) at the state and county levels. Similarly, churchgoing is commonly associated with adherence to prevalent social norms. The influence of conformity on binge drinking has been documented on college
campuses; students are more likely to drink when others do it, or when they overestimate the drinking behavior of others (Perkins, 2003). Although little is known about the effect of conformity on adult flu vaccination, public health authorities are frequently in the news urging the public to get vaccinated, which may create a norm that good citizens get vaccinated to protect themselves and others. Conversely, childhood vaccination rates have been decreasing owing to the misleading spread of public views that childhood vaccinations cause autism. Public opinion also affects tax compliance. Experiments on income tax compliance show that people often overestimate the rate of tax cheating by others but will increase their compliance when given evidence that others do pay their taxes (Coleman 1996 and 2007b; Wenzel, 2001).
Conformity operates at individual, group, and societal levels (Cialdini, 1993), so one would expect to see a spatial effect on behavior at higher levels of aggregation, such as neighborhoods, counties, states, or regions. Indeed, a growing number of studies demonstrate spatial effects on social and political behavior over larger areas. Tam Cho and Rudolph (2008) analyze political activities of individuals in and around large
American cities. They conclude that a part of the spatial pattern of behavior around cities is consistent with a diffusion model and cannot be reduced to socio-demographic
differences in the population. Other spatial analyses showing broad regional or
community effects, all with aggregate data, concern voter turnout in Italy (Shin, 2001;
3U.S. Census Bureau, “Census 2000 Initial Response Rates,” updated April 19, 2000.
4Centers for Disease Control and Prevention, “MMWR Morbidity and Mortality Weekly Report;” April,, 2, 2010, Vol. 59, No. 12, pp 366-367.
5Frank Newport, “Church Attendance Lowest in New England, Highest in South,” Gallup New Service, April 27, 2006. www. gallup.com/poll/22579/church-attendance-lowest-new-england-highest-south.aspx. 6 U.S. Census Bureau, Statistical Abstract of the United States, 2011, Table 304.
Shin and Agnew, 2007), the Nazi vote in Germany in 1930 (O’Loughlin, Flint, and
Anselin, 1994), and voting in Buenos Aires, Argentina (Calvo and Escolar, 2003). One also sees spatial effects at larger geographic scales in the diffusion or contagion of homicide rates (Cohen and Tita, 1999; Messner, et al., 1999); in collective violence such as riots (Myers, 2000); and in the negative association of lynching rates across Southern counties of the United States (Tolnay, Deane, and Beck, 1996).
Models
The direct study of the diffusion of social behaviors is very difficult, and one can more easily investigate whether the end state of a diffusion process has been attained, namely, if the spatial distribution is at an equilibrium state. This also alleviates the need for extensive time-series data. To investigate this possibility one starts with the mathematical model for spatial diffusion in two dimensions. In its most simple form this is
ut = D (uxx + uyy) (1)
That is, the time derivative is equal to a diffusion constant D multiplied by the sum of the second partial derivatives of variable u along the spatial coordinates x and y; the function
u(x,y,t) must be twice differentiable. The right side of the equation is known as the Laplacian operator. (The subscripted variables indicate differentiation.) Another interpretation is that the rate of change of u at point (x,y) at time t is proportional to the difference between u(x,y) and the average value of u around that point. Equation (1) is also known as the heat equation because it describes the flow of heat across a
two-dimensional surface. As the diffusion process evolves over time, eventually a steady state is reached, when ut = 0. The constant can be ignored in this case, so the equation, known as the Laplace equation, becomes
uxx + uyy = 0 (2)
To understand more about this equation and its solution, consider that one knows the value of u(x,y) on a two-dimensional lattice of points at a small equidistance h from one to the next with the lattice representing a geographical area. Initially any distribution of values is possible. One can approximate equation (2) on the lattice at point (m,n) by a Taylor expansion, which after dropping negligible terms leads to
(1/h2) (u
m+1,n– 2 um,n + um-1,n) + (1/h2) (um,n+1 – 2 um,n + um,n-1) = 0 (3)
and thus
um,n = ¼ (um+1,n + um,n+1 +um-1,n + um,n-1) (4)
Conformity models. The numerical solution of the Laplace equation can be seen in a simple example. It uses a method of iteration known as a relaxation process. Assume, for example, that voter turnout u is known for the geographical center of each unit, that is, at each point on the lattice. Consider next how individuals in the center unit are influenced by turnout in the neighboring units. By the Nowak and Vallacher (1998) model and
Cialdini’s (1993) research, influence is proportional to the relative frequency of people in
neighboring units who are expected to vote. The neighboring units are equidistant from the center, so distance is not a factor. What might be the net result on voter turnout in the center unit? Suppose that two of the neighboring units have turnout 50% and two have 70%. One would expect people in the center unit who are closer to the 50% neighbors to shift their voting behavior in that direction, while voters closer to the 70% areas would tend that way. So a commonsense prediction would be that turnout in the center would tend toward the average, 60%. For the moment consider as a working hypothesis that turnout in the center unit will be approximately the average of turnout in the neighboring units.
More formally, let us express the idea that because of the influence of social conformity each unit becomes more like its neighbors, with the turnout at (xi, yj) tending toward the average turnout in the four neighbors. The units might have any turnout values initially. One can extrapolate what will happen in this arrangement by a mental or computer simulation. At each iteration one successively replaces the turnout value at each point by the average turnout of its four neighbors. That is, at each turn for every point let
u(xi,yj) = ¼ u(xi,yj+1) + ¼ u(xi+1,yj) + ¼ u(xi,yj-1) + ¼ u(xi-1,yj) (5)
If one does this simulation the result is that after some large number of iterations all units end up with the same turnout value. But this would be an unrealistic outcome. With one additional hypothesis, however, this becomes an interesting and realistic model, namely, that turnout values in the units on the geographic boundary of the country (or lattice) do not change, or at least change very little in relation to change in the interior. This seems reasonable because each boundary unit interacts with two neighbors that are also
boundary units but with only one interior unit; change in the interior propagates slowly to the boundary.
The solution of the Laplace equation for fixed boundary values is a famous problem of mathematics and physics. Finding the values across the interior is known as the Dirichlet problem.8 This was a very difficult for mathematicians of the 1800s to solve analytically, but more recently it was discovered that one can also solve the problem numerically by a computer simulation of the type just described (Garabedian, 1964: 485ff).9 This problem arises in physics when one tries to explain the effect of gravitation, electrostatic charge, or the diffusion of heat, across a distance on a surface or sphere. The analogy of heat diffusion fits best here as seen, for example, in the daily weather map that shows contours of temperature across the country. So as a standard of comparison, and to offer additional evidence that this method actually works, the analysis here includes the distribution of average state temperatures across the 48 states from 1971 to 2000.10 The averaging gives an approximation of the long-term climate equilibrium underlying seasonal temperature changes and other spatiotemporal temperature fluctuations (neglecting any mention of global warming).
A harmonic function has unique properties (Kellogg, 1953): (1) The product of a harmonic function multiplied by a constant is harmonic (scale invariance), as is the sum or difference of two such functions. (2) It is invariant—still harmonic—under translation or rotation of the axes. (3) The function over an area is completely determined by the values on the boundary; the solution is unique. (4) A harmonic function over a closed, bounded area takes on its maximum and minimum values only on the boundary of the area (if it is not a constant). (5) If a function is harmonic over an area, the value at the center of any circle within the area equals the arithmetic average value of the function around the circle. This implies that averages around concentric circles are equal. The converse is also true. If the averages around all circles equal the values at their centers, the function is harmonic. Note also that the property of scale invariance implies that the size of the units of analysis should not matter much. Harmonic functions have many other, more complex properties as well.
Examples of harmonic functions in two dimensions are:
(1) A plane surface Ax + By + Cz +D = 0for constants A, B, C, D
(2) In polar coordinates, f(r) = c/r or c/r2
(3) f(x,y) = ln(x2 +y2) (4) f(x,y) = ex sin(y)
(5) constant functions
Because a harmonic function is the unique solution to the diffusion problem represented by the lattice model of social conformity, one can use properties of harmonic functions as approximate tests for the validity of the model. Here three properties of harmonic
8Dirichlet’s interest in proving the stability of the solar system led to the study of harmonic functions. 9The boundary must be fairly smooth. For Monte Carlo solutions to the Laplace equation see Haji-Sheikh and Sparrow (1966). In 1944 Kakutani had showed that a numerical solution is also possible with random walks.
functions are tested: (1) that the geographical distribution of the function is a harmonic function; (2) that averages around concentric circles are equal; and (3) that the maximum and minimum of the distribution are in border areas. These hypotheses would be satisfied trivially if the distribution were constant; from a conservative approach to interpreting the results, this situation must be ruled out as well. And one must verify that the distribution in not random. A broad class of alternatives to the harmonic function can be tested with quadratic equations, such as u(x,y) = a x2 + b x +c or u(x,y) = a x2 + b x y + c y2 + d
when a + b + c≠ 0. If the geographic distribution fits these models, it is not harmonic.
The analysis is limited, however, to testing these hypotheses with areal data, which has high granularity as to location. So the hypotheses must be adapted to fit this type of data.
Spatial Analysis
This analysis uses the geographical software GeoDa 0.9.5 developed primarily by Luc Anselin, who pioneered many of the methods used in spatial analysis. It uses the ArcView standard developed by ESRI, Inc. The software has good capabilities for comprehensive geographical analysis, including map drawing, spatial autocorrelation, regression, and special statistical tests. But it must be supplemented with a statistical program for more complex data manipulation and other statistical analysis. GeoDa is available at no charge via the Internet from Arizona State University.11 The working hypotheses of this spatial analysis are that distance matters and that being closer means a having a stronger effect, which is in accord with research on social conformity.
The first task is to check that the spatial distribution of each variable is not random. The spatial autocorrelation is the correlation between the value in each state and the average of values in neighboring states. For this analysis the neighbors around each state are the set of states that have a boundary in common with it; this is called rook contiguity by analogy with chess. This is a gross approximation of the lattice model discussed earlier but is sufficient to begin testing the model. In the U.S. this identification of contiguous neighbors leads to different numbers for the states.12 The most common number of neighbors is four, and forty states have between three and six states sharing a border.
Spatial autocorrelation for the entire country is assessed with Moran’s I. This is a measure of spatial autocorrelation with range [-1,1]. As with Pearson’s correlation,
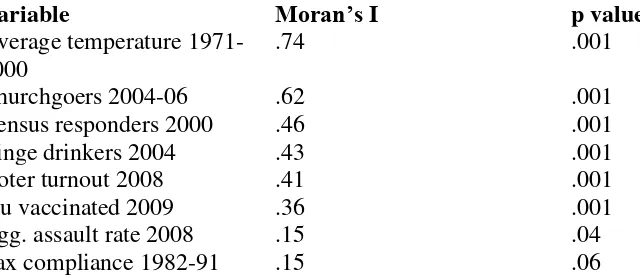
Moran’s I can be positive or negative, and a value near zero implies no autocorrelation. It is based on the aggregate of autocorrelations in the neighborhoods of all states. For example, when states with above average turnout are neighbors of states that also have above average turnout, the I value increases; the same holds when below average turnout states border other low turnout states. A seen in Table 1, all variables but tax compliance are statistically significant on this measure at p <.05; the distributions are not spatially random.
11http://geodacenter.asu.edu
Harmonic function test. If a variable’s geographic distribution is a solution to the Laplace equation, it should be a harmonic function of its location. Inspection of maps reveals that state distributions usually have a north-south gradient and sometimes an east-west tilt, suggesting that one can try to model the distribution as a function of latitude and,
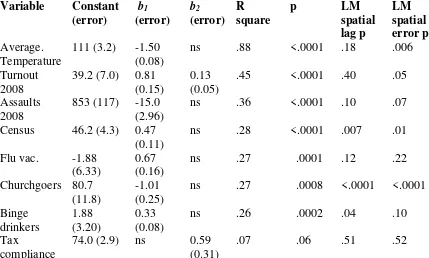
possibly, longitude. The map shapefile contains information on the longitude and latitude of the polygon used to map each state. For each state GeoDa can compute a centroid, which is the latitude-longitude location of the geometric center of gravity of the state. This location is used in the analysis. Table 2 shows the results of linear regression of turnout against latitude and, if significant, longitude at the state centroid.
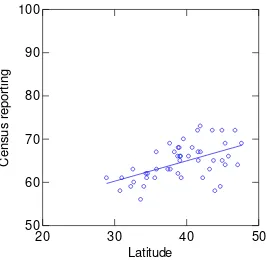
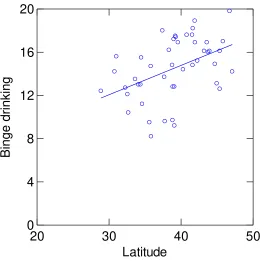
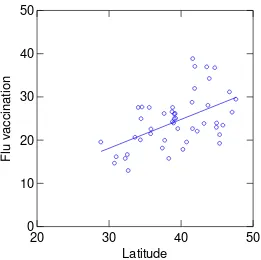
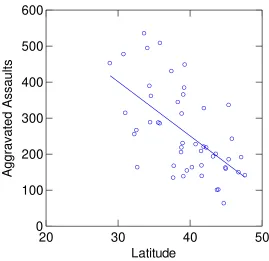
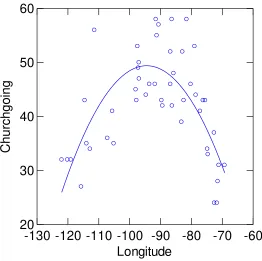
All the social norms except tax compliance and churchgoing are a linear function of their location at the centroid (Figures 1-6). These are harmonic functions of latitude and, for turnout, also longitude; namely, they are plane surfaces. The strongest fit is for voter turnout; the weakest is tax compliance, just missing statistical significance at p = .07. Churchgoing, however, is a function of latitude, longitude, and longitude squared and therefore not harmonic. Its distribution is approximately a convex quadratic surface with a north-south ridge at 95 degrees W longitude—about the longitude of Kansas City, Kansas and Houston, Texas; and it is also tilted so that church going is lower in the north than the south. One can infer that all the variables with plane distributions are close to a steady state but churchgoing is not.
The analysis also checked to see whether the models captured the spatial lag effects. As seen in Table 2, Lagrange Multiplier (LM) tests indicate models where there is significant remaining spatial lag and whether there is error correlation between units. When spatial lag remains significant, it may indicate the effect of a missing variable or a biased
coefficient estimate. This is particularly evident for churchgoing because the linear model in latitude does not adequately represent the curved surface of the distribution; the
significance of the spatial lag term vanishes when all location terms are included (Table 2, note). Census reporting also shows remaining spatial lag or error, but if the spatial lag is included in its regression model, the explained variance increases to 0.42 and the
coefficient of latitude has a smaller value (Table 2, note), which should be a better estimate.
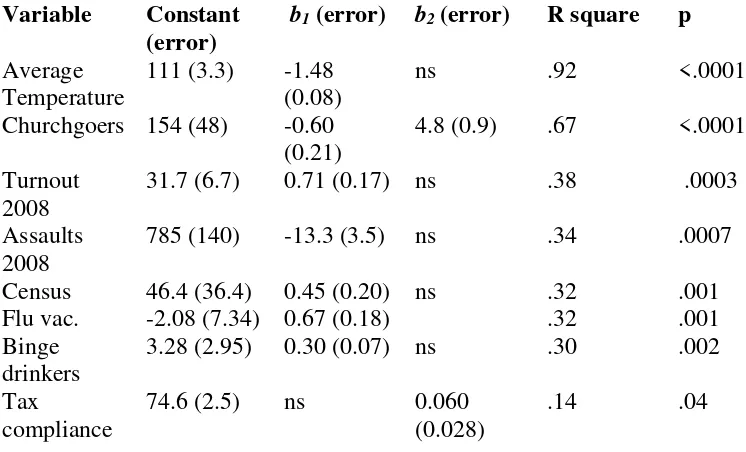
Because a harmonic distribution is completely determined by its boundary values, the analysis was redone for the 30 boundary states to verify that stipulation.13 Results are in Table 3. A comparison of models in Table 2 and 3 shows that the coefficients for latitude are statistically the same for assaults, flu vaccination, and binge drinking. Longitude is not significant for turnout in the boundary model, but the latitude coefficient is about the same, within a statistical margin, as the all state model. The tax compliance model is marginally more significant for boundary values (p = .04) but the coefficients are
different. One can infer that assaults, vaccination and binge drinking show the strongest evidence of an equilibrium by this test, with turnout close behind.
Mean-value test for concentric circles. This hypothesis can be tested approximately by comparing the averages in the interior states with the average over the boundary states. A t-test shows that there is no statistically significant difference in means between boundary and interior states for all the variables except tax compliance. A comparison of means is in Table 4. The analysis was redone with a nonparametric Wilcoxon-Mann-Whitney test, which compares rankings of the each variable between boundary and interior states. This result shows that none of the variables had a statistically significant shift in the ranked distributions of boundary versus interior states.
Discussion
The analysis shows that several important behaviors are influenced by social norms— voting, aggravated assaults, flu vaccination, binge drinking, and census reporting. They have a definitive geographical pattern in the United States. Their distribution fits a harmonic function model, representative of a solution to the Laplace equation and an equilibrium at the end of a diffusion process. The spatial distributions have a north-south gradient, and for turnout also a east-to-west slant; the churchgoing distribution is not harmonic but fits a quadratic surface.
The spatial distributions closest to a harmonic function are approximately in a steady state at this time, so one should not expect substantial changes in their distribution in the foreseeable future. This prospect also suggests that public policies designed, for instance, to reduce binge drinking or increase vaccination rates would be difficult to accomplish. The exception to this is weekly churchgoing. One might anticipate future change in this behavior, which would imply a decrease in churchgoing in central and south-central regions. The boundary state model for churchgoing suggests the likely eventual
equilibrium. Tax compliance barely fits the model, if at all. This likely represents the fact that people generally do not know the prevailing behavioral norm for tax compliance.
Because an individual’s tax paying is private and kept secret by the government, there is
no public knowledge about this. Experiments show, however, that people who tend to overestimate the degree of tax cheating are less likely to cheat when given correct information about its prevalence (Coleman, 1996, 2007b).
The finding that adult influenza vaccination also fits the model is intriguing and calls for further research because of its implications for public health campaigns. A high
References
Blais, A. (2000). To vote or not to vote: The merits and limits of rational choice theory. Pittsburgh, PA: University of Pittsburgh Press.
Calvo, E. and Escolar, M. (2003). The local voter: A geographically weighted approach to ecological inference. American Journal of Political Science, 47, 189-204.
Cialdini, R.B. (1993). Influence: Science and practice. 3rd ed. N.Y.: Harper Collins.
Cohen, J. and Tita, G. (1999). Diffusion in homicide: Exploring a general method for detecting spatial diffusion processes. Journal of quantitative criminology, 15, 451-493.
Coleman, S. (1996). The Minnesota income tax compliance experiment: State tax results. Minnesota Department of Revenue, St. Paul, MN.
Coleman, S. (2002). A test for the effect of social conformity on crime rates using voter turnout. Sociological quarterly, 43, 257-276.
Coleman, S. (2004). The effect of social conformity on collective voting behavior.
Political analysis, 12, 76-96.
Coleman, S. (2007a). Popular delusions: How social conformity molds society and politics. Youngstown, NY: Cambria Press.
Coleman, S. (2007b). The Minnesota income tax compliance experiment: Replication of the social norms experiment. SSRN paper, http://ssrn.com/abstract=1393292.
Garabedian, P.R. (1964). Partial differential equations. New York: Wiley.
Gerber, A., Green, D.P, and Larimer, C. (2008). Social pressure and voter turnout: Evidence from a large-scale field experiment. American political science review, 102, 33-48.
Gerber, A. and Rogers, T. (2009). Descriptive social norms and motivation to vote:
Everybody’s voting and so should you . Journal of politics, 71, 178-191.
Haji-Sheikh, A. and Sparrow, E.M. (1966). The floating random walk and its application to Monte Carlo solutions of heat equations. SIAM Journal of applied
mathematics,14, 370-389.
Kellogg, O.D. (1953). Foundations of potential theory. New York: Dover.
Knack, S., and Kropf, M.E. (1998). For shame! The effect of community cooperative context and the probability of voting. Political psychology, 19, 585-599.
Messner, S.F., Anselin, L., Baller, R.D., Hawkins, D.F., Deane, G., and Tolnay, S.E. (1999). The spatial patterning of county homicide rates: An application of exploratory data analysis. Journal of quantitative criminology, 15, 423-450.
Myers, D.J., (2000). The diffusion of collective violence: Infectiousness, susceptibility, and mass media networks. The American journal of sociology, 106, 173-208.
Nowak, A. and Vallacher, R.R, (1998). Dynamical social psychology. New York: Guilford Press.
O’Loughlin, J., Flint, C., and Anselin, L. (1994). The geography of the Nazi vote: Context, confession, and class in the Reichstag election of 1930. Annals of the association of American geographers, 84, 351-380.
Perkins, H.W. (2003). The social norms approach to preventing school and college age substance abuse: A handbook for educators, counselors, and clinicians. New York: Jossey-Bass.
Shin, M.E. (2001). The politicization of place in Italy. Political geography, 20, 331-352.
Shin, M.E., and Agnew, J. (2007). The geographical dynamics of Italian electoral change.
Electoral studies, 26, 287-302.
Tam Cho, W. and Rudolph, T.J. (2008). Emanating political participation: Untangling the spatial structure behind participation. British journal of political science, 38. 273-289.
Tolnay, S.E., Deane, G., Beck, E.M. (1996). Vicarious violence: Spatial effects of Southern lynchings. The American journal of sociology, 102, 788-815.
Wenger, J.B. and Naumova, E.N. (2010). Seasonal synchronization of influenza in the United States older adult population. PLoS ONE 5(4):
10187.doi:10.371/jounal.pone.0010187.
Table 1. Moran’s test for spatial autocorrelation.
Variable Moran’s I p value
Average temperature 1971-2000
.74 .001
Churchgoers 2004-06 .62 .001 Census responders 2000 .46 .001 Binge drinkers 2004 .43 .001 Voter turnout 2008 .41 .001 Flu vaccinated 2009 .36 .001 Agg. assault rate 2008 .15 .04 Tax compliance 1982-91 .15 .06
Table 2. Harmonic function test model: Y = constant + b1* Latitude + b2 * Longitude
Variable Constant
(error) b1 (error) b2 (error) R square
p LM
spatial lag p LM spatial error p Average. Temperature
111 (3.2) -1.50 (0.08)
ns .88 <.0001 .18 .006
Turnout 2008
39.2 (7.0) 0.81 (0.15)
0.13 (0.05)
.45 <.0001 .40 .05
Assaults 2008
853 (117) -15.0 (2.96)
ns .36 <.0001 .10 .07
Census 46.2 (4.3) 0.47 (0.11)
ns .28 <.0001 .007 .01
Flu vac. -1.88 (6.33)
0.67 (0.16)
ns .27 .0001 .12 .22
Churchgoers 80.7 (11.8)
-1.01 (0.25)
ns .27 .0008 <.0001 <.0001
Binge drinkers 1.88 (3.20) 0.33 (0.08)
ns .26 .0002 .04 .10
Tax
compliance
74.0 (2.9) ns 0.59 (0.31)
.07 .06 .51 .52
Table 3. Harmonic function test model for boundary states (N = 30):
Y = constant + b1* Latitude + b2 * Longitude.
Variable Constant
(error)
b1(error) b2(error) R square p
Average Temperature
111 (3.3) -1.48 (0.08)
ns .92 <.0001
Churchgoers 154 (48) -0.60 (0.21)
4.8 (0.9) .67 <.0001
Turnout 2008
31.7 (6.7) 0.71 (0.17) ns .38 .0003
Assaults 2008
785 (140) -13.3 (3.5) ns .34 .0007
Census 46.4 (36.4) 0.45 (0.20) ns .32 .001 Flu vac. -2.08 (7.34) 0.67 (0.18) .32 .001 Binge
drinkers
3.28 (2.95) 0.30 (0.07) ns .30 .002
Tax
compliance
74.6 (2.5) ns 0.060 (0.028)
Table 4. Mean values for boundary and interior states.
Variable Boundary Mean Interior Mean
Average temperature 53.0 50.5
Census reporting 63.9 65.9
Binge drinking 15.2 14.2
Flu vaccination 24.5 24.3
Churchgoers 41.1 44.3
Assaults 262 258
Voter turnout 59.7 58.4
Table 5. Location of state maxima and minima.
Variable Maximum Minimum
Avg. temperature Florida North Dakota Churchgoers Louisiana New Hampshire Turnout 2008 Minnesota Texas
Binge drinking Wisconsin Tennessee Flu vaccination Rhode Island Mississippi Census reporting Iowa South Carolina Assaults 2008 South Carolina Maine
|Fig.1. Voter turnout in 2008 in relation to latitude with a linear fit.
20 30 40 50
Latitude 0
20 40 60 80 100
T
u
rn
o
u
Fig. 2. Census reporting in relation to latitude with a linear fit.
20 30 40 50
Latitude 50
60 70 80 90 100
C
e
n
su
s
re
p
o
rtin
Fig 3. Binge drinking in relation to latitude with a linear fit.
20 30 40 50
Latitude 0
4 8 12 16 20
B
in
g
e
d
rin
kin
Fig. 4. Flu vaccination in relation to latitude with a linear fit.
20 30 40 50
Latitude 0
10 20 30 40 50
F
lu
v
a
cci
n
a
tio
Fig. 5. Aggravated assault rate in relation to latitude with linear fit.
20 30 40 50
Latitude 0
100 200 300 400 500 600
A
g
g
ra
va
te
d
Assa
u
Figure 6. Churchgoing in relation to longitude with quadratic fit.
-130 -120 -110 -100 -90 -80 -70 -60 Longitude
20 30 40 50 60
C
h
u
rch
g
o
in