Correlation between Mortality of Prehospital Trauma
Patients and Their Heart Rate Complexity
Gholamhussian Erjaee1*, Ali Foroutan2, Sara Keshtkar1, Pegah ShojaMozafar1, Alham Benabas1
1
Mathematics Department, Shiraz University, Shiraz, Iran; 2Shiraz University, Medical School, Shiraz, Iran. Email: *[email protected]
Received September 9th, 2012; revised October 15th, 2012; accepted November 21st, 2012
ABSTRACT
Heart rate complexity (HRC) is a measure of the beat-to-beat variations in heart rate which can be used in patients to identify their physiologic deterioration caused by critical injury. This measurement is the results of nonlinear analysis to the R-to-R interval (RRI) of the electrocardiogram (ECG) of pre-hospital trauma patients. Power spectra, entropy, frac-tal dimension, auto-correlation function and auto-correlation time are some tools for this nonlinear analysis of ECG signal. However, the measurements of these tools for some RRI data in the heart rates for healthy subjects and those with congestive heart failure are so close and hard to distinguish and use for further emergency care. In this case, surro-gating raw data by some manipulated data will provide more informative vital signs. In this article, we will compare the nonlinear analysis of raw data by manipulated data using dominant frequency extraction. Here, we will use real data of 270-beat sections of ECG from 45 emergency patients brought to Shiraz Rejaee Hospetal prior to any medication.
Keywords: Nonlinear Analysis of Complex Data; Electrocardiography; Trauma Patients
1. Introduction
Recently, nonlinear analysis of R-to-R interval (RRI) in heart rate has brought research attention in medicine to improve predictive accuracy of medication in severely injured patients. It seems conventional vital signs infor-mation such as heart rate and blood pressure to identify critically injured patients eventually replaced by heart- rate complexity (HRC) analysis to the electrocardiogram (ECG) of patients in trauma centers. In this respect, dif-ferent nonlinear analysis tools such as; power spectra, entropy, fractal dimension, auto-correlation function and auto-correlation have been adapted for this complexity analysis of ECG signal. Reidbord and Redington [1] were one of the early reports on applications of nonlinear analysis of the heart physiology. Moody and his col-leagues could confidently predicted survival in heart failure cases by use of fully automated methods for de-riving nonlinear and conventional indices of heart rate dynamics [2]. Further studies were reported in cases of arrhythmia or general anesthesia by Pomfrett [3], Fortrat [4], Lass [5] and references therein. Recently, notewor-thy works of Batchinsky and coworkers have shown that prehospital loss of RRI complexity is associated with mortality in trauma patients [6-8]. They have also shown that prediction of trauma survival by analysis of heart
rate complexity is even possible by reducing data set size from 800-beat to 200 or lower beat data sets. In this arti-cle, we will use different data nonlinear analysis tools such as; power spectrum, entropy, Lyapunov exponent, capacity dimension and correlation function to analyze HRC as a sensitive indictor of physiologic deterioration. In these analyses, we will use real data of 270-beat sec-tions of ECG from 45 emergency patients brought to Shiraz Rejaee Hospetal trauma center prior to any medi-cation. As we can see, using some manipulation on raw data will provide more informative vital signs in our nonlinear analyses.
2. Nonlinear Analysis Tools
Here, we have used the following data analysis tools for both, raw and manipulated data.
1) Power spectrum of HRC is a sensitive indicator of physiologic deterioration that demonstrates a fast Fourier transform of our data and displays the mean square am-plitude as a function of frequency. The frequency is in units of the reciprocal of twice the interval between the data points (Nyquist frequency). Here, we illustrate lin-ear-log representation of frequently versus square of the amplitude.
2) Entropy is a quantity that is interpreted as a measure of the amount of disorder in the system to specify the state of the system. So, if we suppose a unite interval
1 iloge i
S
p .3) Lyapunov exponent may be used to obtain a meas-ure of the sensitive dependence upon initial conditions that is characteristic of chaotic behavior. In this case, orbit of the system has at least one positive Lyapunov exponent. Indeed, Lyapunov exponent gives the stretch-ing rate per iteration in a map, averaged over the trajec- tory and hence is defined by lim1 n01logf xi
e i
n n
.Here, we calculated this exponent in units of bits per data sample. Thus a value of +1 means that the separation of nearby orbits doubles on the average in the time interval between data samples.
4) Capacity dimension of d-dimensional square of side
L covered by
2
21
N L boxes is defined by
loglog log1
N d
L
, and in the limit of small , the term
involving L becomes negligible. In the case of data sets, the average slope of the line for the two middle segments is taken as the capacity dimension.
5) Correlation function is the correlation between ran-dom variables at two different points in space or time, usually as a function of the spatial or temporal distance between the points. To calculate we multiply each data
x t by x t
45 patients were selected for our study. These sets of data presence of ECG recordings free of electromechanical noise with at least 270 heart beats. These 270 discrete datasets are used to analyze by the tools described in above section. Some of these nonlinear analysis per-formed by Chaos Data Analyzer (CDA) [9] and some others are calculated manually.
Prior to calculating and illustrating the results of our data nonlinear analysis, we analyze and present a sample set of data in both raw and manipulated data find by re-placing each data with the average of itself and its two nearest neighbors.
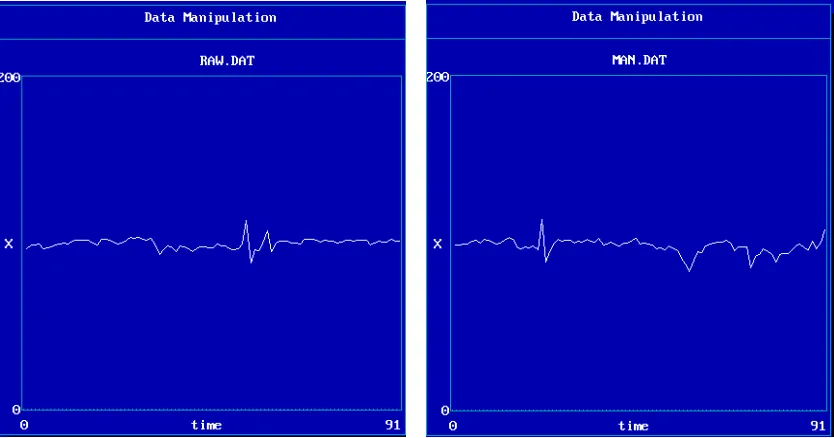
First, we illustrated the raw and manipulated of sample data as time series in Figure 1. As we can see, manipu-lated data in the right shows more complex and chaotic situation than the raw data on the left side of Figure 1.
Second, power spectrum in logarithmic-linear repre-sentation for both raw and manipulated data are shown in
Figure 2. In this figure, for high frequencies indicating noise or fluctuating behavior the small peaks from the original signal appears amplified in the manipulated data. Similarly, for the low dominant frequency in left Figure 2, a monotone decrease of the amplitude replaces by the increase of the frequency in right Figure 2 for low and medium values.
and summing the result over all the data points. The sum is then plotted as a function of . Thus, this function gives a measure of how dependent data points are on their neighbors. The value of at which the correlation function remains small is the correlation time.
Finally, in Figure 3 we illustrated the correlation func-tion and correlafunc-tion time for both raw and manipulated data. As we can see in this figure, correlation function of raw data (on the left) converging to zero more frequently than the one related to manipulated data (on the right).
[image:2.595.90.507.499.718.2]
Figure 2. Power spectrum corresponding to ECG signal (left) and manipulated data (right).
Figure 3. Correlation function and correlation time for both raw (left) and manipulated (right) data.
This indicates the stronger chaotic characteristic of the manipulated data.
Therefore, in this study instead of raw data we use manipulated data to find the chaotic measurements de-scribed in Section 2. Here we use power spectrum, en-tropy and Lyapunov exponent to show these chaotic measurements.
Recently, these measurements as a nonlinear analysis tools play an important role in biology. Indeed, biologic processes, as a highly complex system, cannot be de-scribed by analysis of the simple calculation. In the car-diovascular system, one consequence of this complexity is the irregularity and chaotic behavior in RRI. The
[image:3.595.89.508.330.551.2]1 2.8647 1.092 0.247 1.522 1.117 2.059 0.261
2 1.2362 0.975 0.294 1 0.734 2.081 0.701
3 2.8304 0.689 0.213 0.5 0.367 2.06 0.142
4 1.1959 1.011 0.237 1.429 1.049 1.829 0.297
5 2.1142 0.713 0.337 1 0.734 2.085 0.285
6 0.9122 0.701 0.24 0.792 0.582 1.861 0.44
7 1.34 0.973 0.302 1.161 0.857 2.23 0.291
8 1.219 0.477 0.186 1.044 0.766 1.794 0.31
9 1.2621 0.674 0.212 1.044 0.77 2.07 0.127
10 0.5907 0.453 0.37 0.661 0.488 1.802 0.26
11 2.3376 1.112 0.268 1.292 0.948 2.145 0.32
12 0.6429 0.741 0.313 1.404 1.03 1.643 0.339
13 1.1155 0.851 0.282 1.085 0.796 2.16 0.376
14 1.3285 0.643 0.367 0.85 0.624 1.805 0.372
15 1.2804 1.04 0.22 1.292 0.948 1.951 0.56
16 1.2843 0.588 0.223 1.161 0.857 1.967 0.44
17 0.6814 0.952 0.266 1.624 1.198 2.163 0.292
18 0.3924 0.835 0.236 1.35 0.991 2.125 0.681
19 1.7064 0.964 0.319 0.953 0.704 2.053 0.311
20 0.1173 1.352 0.317 1.044 0.77 1.581 0.5
21 1.1959 1.011 0.237 1.429 1.049 1.829 0.297
22 0.6958 0.652 0.253 0.953 0.7 2.135 0.892
23 1.3242 1.02 0.255 1.477 1.09 2.116 0.221
24 0.9937 0.988 0.263 0.73 0.535 1.94 0.321
25 0.9228 0.66 0.196 1.044 0.77 2.455 0.878
26 0.9432 0.83 0.246 1.196 0.883 2.063 0.219
27 2.2675 0.794 0.266 0.743 0.548 2.055 0.758
28 1.9974 1.241 0.291 1.429 1.049 2.067 0.343
29 0.8531 0.898 0.272 1.161 0.857 1.703 0.462
30 1.2228 1.119 0.212 1.292 0.948 2.176 0.255
31 1.7226 0.904 0.233 1.404 1.03 1.909 1.148
32 2.8479 0.871 0.199 1.377 1.016 1.997 0.403
33 0.4409 0.709 0.394 1.531 0.864 2.005 0.936
34 0.2617 0.921 0.339 0.792 0.585 1.893 0.035
35 1.588 0.983 0.306 1.429 1.049 2.091 0.39
36 1.6394 1.085 0.226 1.477 1.09 2.134 0.172
37 0.8167 0.865 0.247 1.044 0.766 2.133 0.334
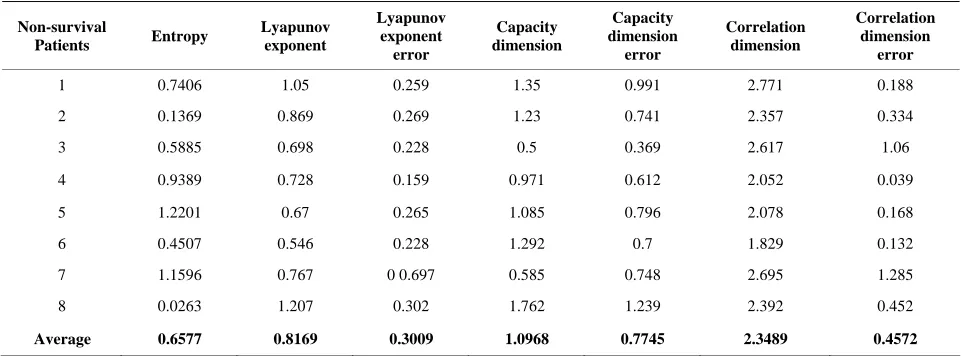
Table 2. Various RRI complexity (chaos) measurements for 8 non-survival patients.
Non-survival
Patients Entropy
Lyapunov exponent Lyapunov exponent error Capacity dimension Capacity dimension error Correlation dimension Correlation dimension error
1 0.7406 1.05 0.259 1.35 0.991 2.771 0.188
2 0.1369 0.869 0.269 1.23 0.741 2.357 0.334
3 0.5885 0.698 0.228 0.5 0.369 2.617 1.06
4 0.9389 0.728 0.159 0.971 0.612 2.052 0.039
5 1.2201 0.67 0.265 1.085 0.796 2.078 0.168
6 0.4507 0.546 0.228 1.292 0.7 1.829 0.132
7 1.1596 0.767 0 0.697 0.585 0.748 2.695 1.285
8 0.0263 1.207 0.302 1.762 1.239 2.392 0.452
Average 0.6577 0.8169 0.3009 1.0968 0.7745 2.3489 0.4572
between survivors and non-survivors of trauma in the prehospital setting. As noted in these studies, we also hypothesized that loss of RRI complexity is associated with mortality after trauma.
In order to do our data analyze, among the 65 available data recorded by ECG from trauma patients brought to Shiraz Rejaee Hospetal prior to any medication, we were screened for presence of ECG recordings free of elec-tromechanical noise, free of ectopic beats, and at least 270 heart beats in length of 45 patients were selected. Before using these raw data, as we explained above, we have manipulated data by replacing each data with the average of itself and its two nearest neighbors. Then these manipulated data have imported into Chaos Data Analyzer (CDA) [9] to evaluate Lyapunov exponents, capacity dimension and correlation dimension. We have also evaluated entropy manually, i.e. using our prepared code to evaluate these quantities. In order to be consis-tence, we have used dimension 2 for our embedding di-mension in all these evaluation quantities and the results are showed in Tables 1 and 2. Table 1 shows the results for 37 survivals and Table 2 for 8 non-survival patients. As we expected, by comparing the average values in last row of both tables, all values correspond to survival pa-tients are more than the values corresponds to non-sur- vivals unless the last value, correlation dimension, on which the value corresponding to non-survivals is bigger than the one corresponding to the survivals. This shows that the data corresponding to non-survival are more correlated than the corresponding survival data. There-fore, in average the chaos measurements, entropy, Lyapunov exponents and capacity dimension in survival patients are higher than non-survival, which proof our assertion.
4. Conclusion
In this article, we have hypothesized the loss of RRI
complexity is associated with mortality after trauma. To prove our assertion, we have used the real data of 270- beat sections of ECG from 45 emergency patients. Using these data, we have calculated entropy, Lyapunov expo-nent, capacity dimension and correlation function and illustrated in Tables 1 and 2. By comparing the average values in last row of these two tables, all values corre-spond to survival patients are more than the values cor-respond to non-survivals unless the last value, correlation dimension, on which the value corresponding to non- survivals is bigger than the one corresponding to the sur-vivals. This shows that the data corresponding to non- survival are more correlated than the corresponding sur-vival data. Therefore, in average the chaos measurements, entropy, Lyapunov exponents and capacity dimension in survival patients are higher than non-survival, which proof our assertion.
5. Acknowledgements
This work was supported by Health Policy Research Center, Shiraz University of Medical Sciences.
REFERENCES
[1] S. P. Reidbord and D. J. Redington, “Psychophysiological Processes during Insight-Oriented Therapy: Further In- vestigations into Non-Linear Dynamics,” Journal of Ner- vous and Mental Disease, Vol. 180, No. 10, 1992, pp. 649-657. doi:10.1097/00005053-199210000-00007 [2] K. K. Ho, G. B. Moody, C. K. Peng, J. E. Mietus, M. G.
Larson, D. Levy and A. L. Goldberger, “Predicting Sur-vival in Heart Failure Cases and Control Subjects by Use of Fully Automated Methods for Deriving Nonlinear and Conventional Indices of Heart Rate Dynamics,” Circula-tion, Vol. 96, 1997, pp. 842-848.
doi:10.1161/01.CIR.96.3.842
No. 1, 1997, pp. 1-10.doi:10.1007/s004220050361 [5] J. Lass, “Biosignal Interpretation: Study of Cardiac
Ar-rhythmias and Electromagnetic Field Effects on Human Nervous System,” Ph.D. Theses, TTU Press, 2002, pp. 13-106.
[6] A. I. Batchinsky, L. C. Cancio, J. Salinas, T. Kuusela, W. H. Cooke, J. J. Wang, M. Boehme, V. A. Convertino and J. B. Holcomb, “Prehospital Loss of R-to-R Interval Complexity Is Associated with Mortality in Trauma Pa-tients,” Journal of Trauma, Vol. 63, No. 3, 2007, pp. 512- 518.doi:10.1097/TA.0b013e318142d2f0
[7] L. C. Cancio, A. I. Batchinsky, J. Salinas, T. Kuusela, V. A. Convertino, C. E. Wade and J. B. Holcomb, “Heart- Rate Complexity for Prediction of Prehospital Lifesaving
soiu, J. Jones and L. C. Cancio, “Rapid Prediction of Trauma Patient Survival by Analysis of Heart Rate Com-plexity,” Impact of Reducing Data Size: SHOCK,Vol. 32, No. 6, 2009, Article ID: 565Y571.
[9] A. I. Batchinsky, W. H. Cooke, T. Kuusela, et al., “Loss of Complexity Characterizes the Heart-Rate Response to Experimental Hemorrhagic Shock in Swine,” Critical Care Medicine, Vol. 35, No. 2, 2007, pp. 519-525.
doi:10.1097/01.CCM.0000254065.44990.77