DOI: 10.4236/ojfd.2017.73022 Sep. 18, 2017 340 Open Journal of Fluid Dynamics Mechanical Engineering Program, University of the Ryukyus, Okinawa, Japan
Abstract
Okinawa in the subtropical islands enclosed in the ocean has a problem that corrosion of structures progresses quickly because of high temperature, high humidity and adhesion of sea-water mists flying from sea. Author is interested in corrosion of bridge made of weatherability steel. Therefore, it needs to in-vestigate the flow structure around bridge beams and behavior of sea-water mist (droplet). In this paper, flow visualization and PIV are attempted to un-derstand the flow structures around bridge beams and, furthermore, numeri-cal approach of motion of droplets is attempted to understand the collision of sea-water mists on the bridge wall.
Keywords
Flow Visualization, PIV, Behavior of Sea-Water Mist
1. Introduction
Okinawa is located in the southern area in Japan and is subtropical islands en-closed in the ocean. There, therefore, is a problem that corrosion of the struc-tures progresses quickly because of high temperature, high humidity and adhe-sion of sea-water mist flying from sea. For instance, since the Benoki Bridge lo-cated in Kunigami village, Okinawa, was built by weatherability steel in 1981, it collapsed by remarkable corrosions in July, 2009 [1][2].
Author is interested in the relationship between flow structure around bridge beams and corrosion of sea-water mist. Therefore, two approaches are attempted. One is flow visualization and PIV to understand the flow structures inside bridge beams and another is numerical approach to understand the collision of sea-water mists on beams walls.
2. Experiment Setup
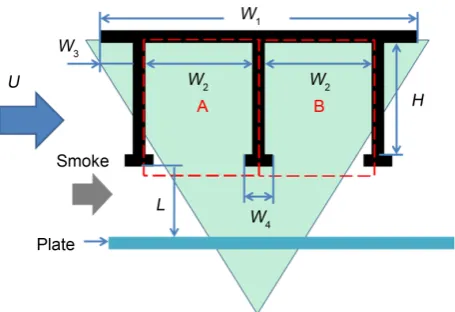
Figure 1 shows a 1/15 scale bridge model to investigate the flow around the
How to cite this paper: Ishikawa, M. (2017) A Study on Flow Structure around a Bridge Beam and Behavior of Sea Water Mist. Open Journal of Fluid Dynamics, 7, 340-347.
https://doi.org/10.4236/ojfd.2017.73022
Received: July 25, 2017 Accepted: September 15, 2017 Published: September 18, 2017
Copyright © 2017 by author and Scientific Research Publishing Inc. This work is licensed under the Creative Commons Attribution International License (CC BY 4.0).
DOI: 10.4236/ojfd.2017.73022 341 Open Journal of Fluid Dynamics Figure 1. Schematic view of a bridge beam model.
bridge beams. Table 1 shows the configuration of the bridge model. The bridge beams consist of two cavity structures. Flat plate is set below the bridge beam like as the water surface. The model and plate are made of the transparency acrylic resin to visualize the inside cavity flow. The beam model has 0.1 m in height (H), 0.4 m in width (W1) and 0.125 m in each cavity width (W2). The
distance L from bridge beams to water surface is varied at that L/H = 0.5, 1, 2. Velocity U is set at 5 m/s, and then the Reynolds number Re is about 5.0 × 10⁴.
The inside flow images are captured by high-speed camera (Phantom V710, Frame rate: 3000 fps, image size: 1280 × 800 pixels). The flow is illuminated by CW Nd: YAG (Output power: 8 W, wave length: 532 nm) as laser sheet light with about 1 mm width. For seeding, smoke generated by heating the glycol so-lution is derived from three locations. One is at upstream of bridge beam, the others are on wall in behind of two cavities.
Whole area including the two cavities is captured to investigate the relation-ship between their upstream and downstream cavities. Calculated areas are cropped to two areas of A (upstream cavity) and B (downstream cavity) areas as shown in Figure 1. For PIV analysis, time-series velocity vectors for each area are obtained by recursive direct cross-correlation method [3].
3. Numerical Approach of Motion of Sea-Water Mists
Above mentioned flow visualization was executed in the wind tunnel, but it is difficult to use the sea-water mist as tracer particle. Because wind tunnel was corroded by salt, author, therefore, attempts numerical approach to understand the collision of sea-water mists. Also, velocity data obtained by PIV are used in a whole flow field.
These behaviors of sea-water mists are given by equation of translate motion of particle (or droplet) [4] as following Equation (1):
(
)
(
)
(
)
( )
(
)
2 2 d d d d 1 π . 2l l l G l l l l l l G
G l D l G l G L
V V V V p V
t t
r C
ρ βρ ρ µ
ρ
+ + + ∇ − ∇
+ − − + =
u u g u
u u u u F 0
DOI: 10.4236/ojfd.2017.73022 342 Open Journal of Fluid Dynamics where, 1st term to 7th terms mean inertia force, added inertia force, gravity force, pressure gradient force, viscos force, drag force and lift force. u is velocity vector, r and d are a radius and a diameter of particle, p is the pressure,
g is gravity acceleration vector,
ρ
is density,µ
is viscosity, V is volume of a particle, andβ
is virtual mass coefficient. Drag force coefficient CD used equation known as Newtonian resistance and equation proposed by Shiller and Naumann [5]. Subscript l and G mean sea-water mist particle and air, re-spectively. Approximate equation of Suffman’s lift force defined by Mei [6] is given as Lift force FL.In real case, the diameter of the sea-water mist has the range of a few mi-cro-meters to several ten mimi-cro-meters. In this simulation, a diameter of droplet
d sets to 10 μm and the standard deviation of droplet σd sets to 5 μm. Initial
positions of droplets are located randomly in whole cavities. Time marching method set to 1st order Euler method. Droplet position in the next step is calcu-lated by velocity ul given by Equation (1) and the time interval dt = 5 ms. In-teraction between droplets don’t consider. When droplets impinge to wall, it is judged that droplets bonded to the wall. At the time of impinging, bonded wall position (left, center and right wall) and impinging wall height are recorded to investigate a degree for each height of wall.
4. Results and Discussions
4.1. Flow Visualization and PIV Results
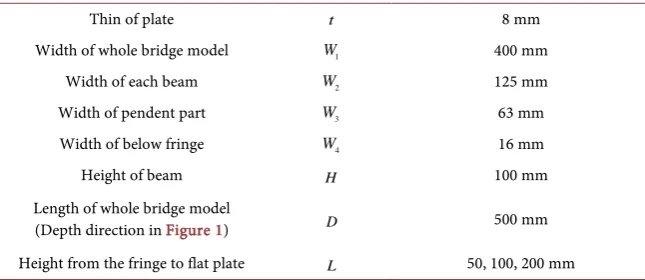
Figure 2 and Figure 3 show smoke trajectory images at L/H = 0.5 and 2, respec-tively. These images are made by an average of 100 frame sequence images and image enhancement. For these figure, authors added to some arrow to recognize the stream direction.
From Figure 2 at L/H = 0.5, smoke stream moves to almost parallel to plate below the bridge beam and rotate to counter-clockwise in each cavity. From Figure 3 at L/H = 2, smoke stream moves separately from the left wall, rotate to counter-clockwise in the right cavity. The smoke streams from the downstream cavity moves to upstream cavity and rotate to clockwise in the upstream cavity.
[image:3.595.212.535.88.228.2]DOI: 10.4236/ojfd.2017.73022 343 Open Journal of Fluid Dynamics Figure 2. Smoke trajectory image at L/H = 0.5.
Figure 3. Smoke trajectory image at L/H = 2.
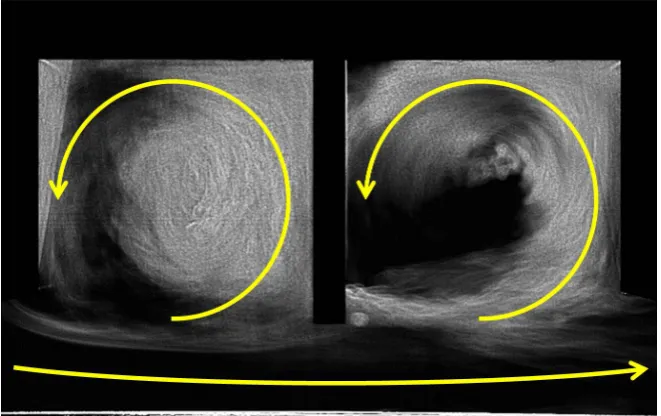
respectively. These results are obtained as time average of 3000 frame velocity vectors (1 second). Color bar means u/U which is defined the rate of the magni-tude of each velocity vector to the inlet velocity U. That is, blue means 0m/s and red mean 5 m/s.
From Figure 4, velocities have about 5 m/s between bridge beam and plate and flow direction was parallel to the bridge beam and plate. In two cavities, ve-locities rotate to counter-clockwise and the magnitude of veve-locities is a half times less than main flow velocity U. Since velocities in both cavities is faster than out of plane velocity, there is no influence of three-dimensional flow.
DOI: 10.4236/ojfd.2017.73022 344 Open Journal of Fluid Dynamics Figure 4. Averaged velocity vector maps at L/H = 0.5 in area A of the upstream cavity (left) and in area B of the downstream cavity (right).
Figure 5. Averaged velocity vector maps at L/H = 2 in area A of the upstream cavity (left) and in area B of the downstream cavity (right).
The separated flow goes over the downstream cavity and the right wall. There-fore, flow in the downstream cavity rotates to counter-clockwise, countercurrent flow under the center wall are obtained from the downstream cavity to the up-stream cavity, and flow in the upup-stream cavity rotates to clockwise. The magni-tudes of velocities in two cavities are slower than ones in Figure 4. Especially, since flow in upper area of downstream cavity is slower, influence of three-dimensional flow is included slightly.
[image:5.595.207.540.331.542.2]DOI: 10.4236/ojfd.2017.73022 345 Open Journal of Fluid Dynamics Table 2. Direction of rotation inside cavity.
L/H Area A Area B
0.5 ○ ○
1 ○ ○
2 ○ ×
○ means counter clockwise flow; × means clockwise flow.
structure as shown in Figure 4 change to one as shown in Figure 5, when 1 < L/H < 2.
4.2. Numerical Simulation on Collision of Sea-Water Mist Particles
Numerical approach of sea-water mist particles is executed. Figures 6(a)-(d) and Figures 7(a)-(d) show the probability density function (PDF) distribution of the collision of sea-water mist particles at the all side wall at the L/H = 0.5 and 2. Fig-ure 6(a) and Figure 6(b), Figure 7(a) and Figure 7(b) show on left and right wall in area A of the upstream cavity and Figure 6(c) and Figure 6(d), Figure 7(c) and Figure 7(d) show on left and right wall in area B of the downstream cavity. h means the height on the wall. A vertical axis means the rate h/H of the position of wall to bridge height.
Flow both of their upstream and downstream cavities rotates to counter clockwise, mist particles which flow into these cavities from main flow impinge to right wall in these cavities. As shown in Figure 6(b) and Figure 6(d), there are many collisions of particles at h/H < 0.1, and as h/H becomes higher, PDF of collision decreases. In the Figure 6(a) of the opposite side of the upstream cavity, many mist particles move to downward and to almost parallel along the left wall. Therefore, there are many collisions of particles at h/H < 0.1, and as h/H be-comes lower, PDF of collision increases. In the Figure 6(d) of the opposite side of the downstream cavity, many mist particles move to downward and impinge to the left wall. Therefore, there are many collisions of particles near h/H = 0.6, and as h/H becomes lower, PDF of collision decreases.
DOI: 10.4236/ojfd.2017.73022 346 Open Journal of Fluid Dynamics Figure 6. PDF distribution of collision of sea-water mist particles at L/H = 0.5.
Figure 7. PDF distribution of collision of sea-water mist particles at L/H = 2.
particles move to downward slowly and to almost parallel along the left wall. PDF distribution is almost equivalent in whole height.
5. Conclusions
The author was interested in the relationship between corrosion of sea-water mist and flow structure. Two approaches were attempted. One was flow visuali-zation and PIV to understand the flow structures around bridge beams, and another was numerical approach of collision of sea-water mists.
From the visualization and PIV, authors revealed that flow at L/H = 0.5 ro-tates to counter-clockwise in two cavities and also flow at L/H = 2 rotates to counter-clockwise in the downstream cavity and to clockwise in the upstream cavity and countercurrent flow from the downstream cavity to the upstream cavity.
cavi-DOI: 10.4236/ojfd.2017.73022 347 Open Journal of Fluid Dynamics ties and it was easy for corrosion to progress in the position.
References
[1] Shimozato, T., Murakoshi, J., Tamaki, Y. and Takahashi, M. (2009) Collapse Process and an Outline of the Deformation Monitoring of Steel Bridge that Led to the Collapse Due to Corrosion. Bridge and Foundation Engineering, Kenset-su-Tosho, Vol. 43, No. 11, 55. (In Japanese)
[2] Honda, H., Shimozato, T., Fuchiwaki, H. and Arizumi, Y. (2010) Corrosion and Environment Assessment at the Part of the Structure for Weatherability Steel Bridge Passed for Around 30 Years in Okinawa. Proceedings ofJapan Society of Civil En-gineers 2010 Annual Meeting, Sapporo, September 2010, 321. (In Japanese) [3] Raffel, M., Willert, C., Wereley, S. and Kompenhans, J. (2007) Particle Image
Velo-cimetry—A Practical Guide. 2nd Edition, Springer, Berlin Heidelberg New York. [4] Clayton, C., Martin, S. and Yutaka, T. (1998) Multiphase Flows with Droplets and
Particles. CRC Press, Boca Raton, FL.
[5] Shiller, L. and Naumann, A. (1935) A Drag Coefficient Correlation. Zeitschrift des Vereins Deutscher Ingenieure, 77, 318-320.
[6] Mei, R. (1992) An Approximate Expression for the Shear Lift on a Spherical Particle at Finite Reynolds Number. International Journal of Multiphase Flow, 18, 145-147.
Submit or recommend next manuscript to SCIRP and we will provide best service for you:
Accepting pre-submission inquiries through Email, Facebook, LinkedIn, Twitter, etc. A wide selection of journals (inclusive of 9 subjects, more than 200 journals)
Providing 24-hour high-quality service User-friendly online submission system Fair and swift peer-review system
Efficient typesetting and proofreading procedure
Display of the result of downloads and visits, as well as the number of cited articles Maximum dissemination of your research work