Nanoparticle Transportation and Brownian Diffusion in
Planar Jet Flow via Large Eddy Simulation
Peifeng Lin1*, Dichong Wu2, Zefei Zhu3
1Faculty of Mechanical Engineering and Automation, Zhejiang Sci-Tech University, Hangzhou, China 2Business Administration College, Zhejiang University of Finance and Economic, Hangzhou, China
3School of Mechanical Engineering, Hangzhou Dianzi University, Hangzhou, China
Email: *[email protected]
Received October 1,2012; revised November 13, 2012; accepted November 22, 2012
ABSTRACT
The nanoparticle transportation and Brownian diffusion in planar jet flow is simulated via large eddy simulation in this work. To thorough compare the Brownian diffusion with different particle size, we computed three particle diameter dp = 1 nm, 10 nm and 50 nm in one simulation process simultaneously. The numerical results showed that at the flow de- veloping stage, the particle mass concentration pattern develops as the flow vorticity develops. The distribution is nearly uniform at the lower reaches of the nozzle exit. When the jet flow is developing on, vortexes always carry the particle from upstream to downstream, from the central axis region to the outer mixing layer of jet. At the front of the jet flow, particles distribute more homogeneous for they have more residence time to diffuse from higher concentration region to the lower concentration region. The time averaged particle concentration distribution patterns are similar to Gaussian distribution form. The maximum concentration contributed by diffusion is present at the mixing layer near the nozzle exit. The farther away from the nozzle exit in the cross-stream direction, the smaller the concentration is. The maximum concentration contributed by diffusion is several orders smaller than that contributed by flow convection.
Keywords: Large Eddy Simulation; Planar Jet Flow; Nanoparticle Evolution; Diffusion
1. Introduction
Our surroundings are filled with thousand kinds of ultrafine particles. Mechanism of the motion of these nano-sized particles is of interest for decades [1-6], and ultrafine particles suspended in fluid have lots of applica- tion.
When the particle diameter is in the order of nanome- ter, the Brownian diffusion instead of the inertial force is the dominant factor of the particle deposition [7]. How- ever, the transport and deposition of nanoparticles in turbulent planar jet flow has not been examined in detail.
2. Model and Equation
The flow we concerned here is an incompressible planar jet flow containing relative high concentration nano-scale particles (dp = 1 nm, 10 nm and 50 nm, assuming to be solid, spherical, and non-interacting in this work). The width of nozzle, D, is 5 mm. The inlet velocity at the
nozzle, 0, is 6 m/s. The computational domain is x × y = 20D × 20D (as shown in Figure 1). The turbulence
fluctuation intensity of the main inlet flow is given to be 5%. Time step size is set to be 2 × 10⁻⁵ s. The fluid
is isothermal at temperature of T = 288 K.
U
t
The planar jet flow, as a turbulent flow, can be char- acterized by a wide range of eddies, so the control equa- tions here are solved by the LES (Large Eddy Simula- tion). After filtering by the length and time scales, the mass and momentum equations are as follows,
2
0,
1 j
j
i i i
j
ij
j i j j
u x
u u p u
u
t x x x x xj
(1)
where ui and p are the filtered velocity and pressure. Methods which can be used in representing nanoparti- cle fields in fluid-particle systems include Lagrangian methods [8,9], moment methods [10,11], and sectional methods [12]. The equation employed here to describe the nanoparticle mass transfer is,
2p j j
Q j j
u Q Q
D
t x x x
Q
S
(2)
where Q is the species mass fraction, Q is the source term,
S
p
20D D U0 x y
Figure 1. Illustrate of the planar jet flow domain.
slip
3π
p
p
kTC D
d
(3)
where k = 13.8 × 10⁻²³ J/K is the Boltzmann constant, T
is the temperature, dp is the particle diameter, and is the Cunningham slip correction factor. slip
C
slip 1 2.514 0.8exp 0.55
p
p
d C
d
(4)
Here, is the mean free path of air, which can be calculated based on the following formula [14]:
1 2 π 2
m kT
(5)
where is the kinematic viscosity, m is the molecule
mass of air.
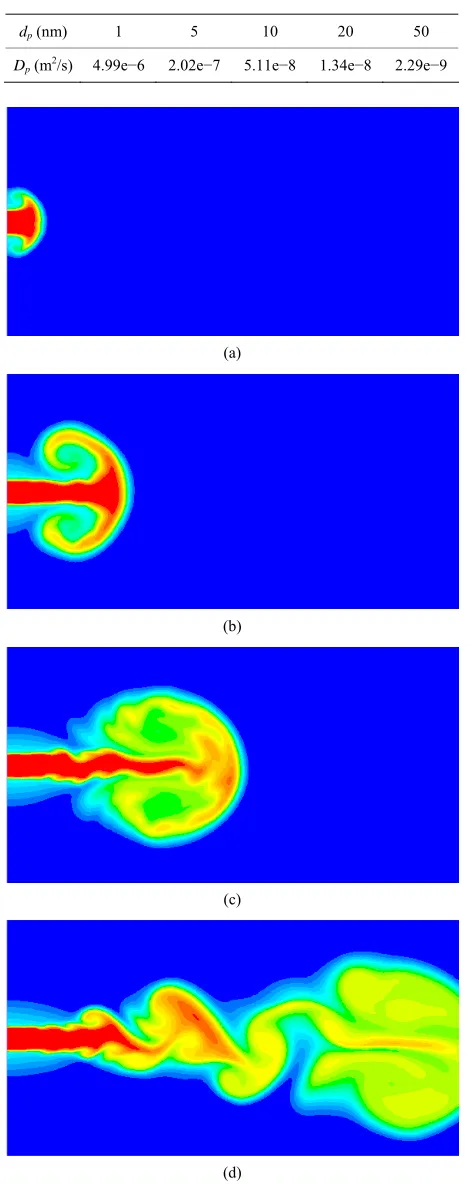
In the computation, some diffusivities of nanoparticles are given in Table 1.
3. Result and Discussion
3.1. Particle Mass ConcentrationIn this work, nanoparticles redistribute not only due to the air current, which will carry particles from the up- stream to downstream, but also the Brownian motion, which is the presumably random moving of particles suspended in a fluid, and as a result, particles will be driven from the regions of higher concentration to lower, namely, Brownian diffusion acts to homogenize parti- cles.
Figure 2 shows the instantaneous contours of nanopar- ticle mass fraction (Q) over the flow field at different
time steps, from Figures 2(a) to (d)t = 100, 500, 1000
and 2000. As we can see, at the developing stage of flow in Figures 2(a) and (c), the particle mass concentration pattern develops as the flow vorticity develops. The dis- tribution is nearly uniform at the lower reaches of the nozzle exit, where the value of Q is also highest, i.e. 0.1,
[image:2.595.307.542.105.698.2]and the region is finally stretched to nearly a quarter of the entire domain length (i.e. about 25 mm), seen in Fig- ure 2(d). In the front of the jet flow, the primary vortex
Table 1. Diffusivities of nanoparticle with different diame- ters.
dp(nm) 1 5 10 20 50
Dp(m
2/s) 4.99e−6 2.02e−7 5.11e−8 1.34e−8 2.29e−9
(a)
(b)
(c)
(d)
keeps rolling-up, transporting and mixing the particle to the fluid where did not carry particles. The concentration is lower at the core region of the swirl for the particles carried are less and less in the process of vortex rolling. In one word, when the jet flow is developing on, the pairing vortexes always tend to carry the particle from upstream to downstream, from the central axis region to the outer mixing layer of jet.
When the flow is fully developed at the time step t =
2000, particles can be found in the whole jet central axis line with some particles have already carried out of the computational domain. It can also be found that at the front of the jet flow, particles distribute more homoge- neous for they have more residence time to diffuse from higher concentration region, i.e. core region of the vortex,
to the lower concentration region, i.e. outer region of the
[image:3.595.58.285.515.703.2]vortex.
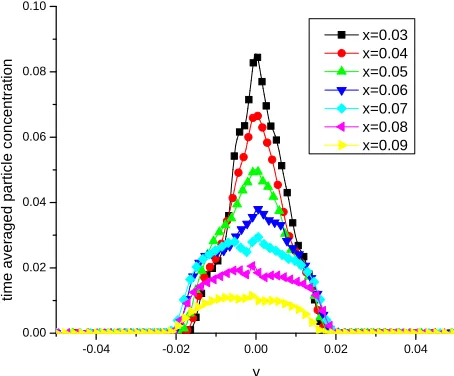
Figure 3 shows the time averaged particle concentra- tion distribution in the cross-stream direction at different flow positions (after the flow is fully developed, from time step 2000 to 3000). We can see that all the distribute patterns in the figure are similar to Gaussian distribution form. While the flow length x is increasing, the maxi-
mum of the concentration is reducing and the high value region is extending from the central axis line to the outer of the jet. Furthermore, the curves are steeper at the posi- tions closing to the nozzle exit but flatter far away from the exit.
3.2. Diffusion Contribution
To thorough compare the Brownian diffusion with dif- ferent particle size, we computed three particle diameter
dp = 1 nm, 10 nm and 50 nm in one simulation process simultaneously. It is shown previously in the particle
-0.04 -0.02 0.00 0.02 0.04
0.00 0.02 0.04 0.06 0.08 0.10 ti m e aver aged part icle conc ent rat ion y x=0.03 x=0.04 x=0.05 x=0.06 x=0.07 x=0.08 x=0.09
Figure 3. The time averaged particle concentration distri- bution in the cross-stream direction.
concentration control equation, i.e.
2p j j Q j j u Q Q D
t x x x
Q
S
(2)
The diffusion effect is relative to the second derivative of particle mass fraction and the particle diffusivity. It’s to say that the particle distribution and the particle size both contribute to particle diffusion. In a given case, the local particle distribution is the major influence factor. While for cases with different particle size, the particle diameter is also the major factor. For the three selective particle diameters, p for 50 nm is smallest, for 1 nm is far larger than 10 nm.
D
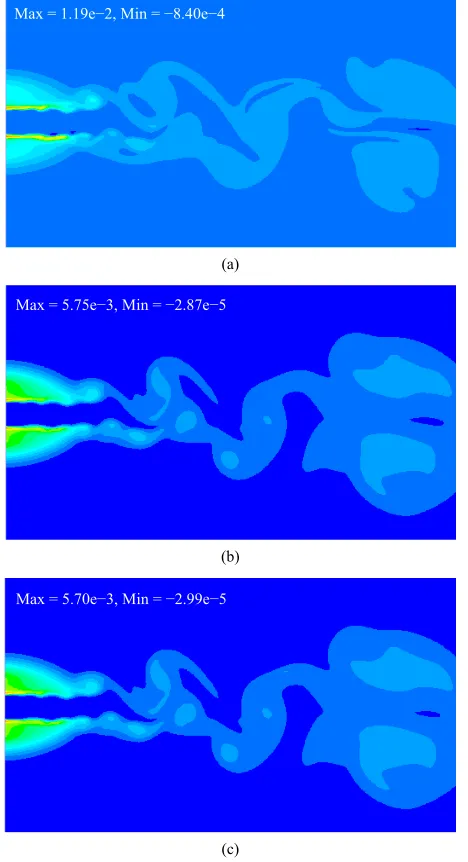
To show the tiny differences between the three cases, we also simulated a situation with Dp , meaning there is no diffusion in the flow developing, as a refer- ence 0. So the result of 0 is meaning the con- centration contributed only by the diffusion term. The
contours of 0
0
Q Q Q
Q Q for different diameters are given in Figure 4 at time step t = 2000.
In Figure 4, it can be find that the maximum concen- tration contributed by diffusion is present at the mixing layer near the nozzle exit, between the static and inject- ing fluid. The farther away from the nozzle exit in the cross-stream direction, the smaller the concentration is. The concentration near the nozzle exit is much higher than that at the downstream of the jet flow too. It can also be seen that the maximum concentration contributed by diffusion is several order smaller than that contributed by flow convection. While diameter increasing, the particle diffusion ability reducing. As a result, the maximum concentration contributed by diffusion is decreasing too. Comparing Figures 4(a)-(c), the difference is much lar-ger between (a) and (b) than that between (b) and (c). It can be explained from the Dp value difference for dp = 1 nm, 10 nm and 50 nm.
4. Conclusions
The nanoparticle transportation and Brownian diffusion in planar jet flow is simulated via large eddy simulation in this work. To thorough compare the Brownian diffu- sion with different particle size, we computed three par- ticle diameter dp= 1 nm, 10 nm and 50 nm in one simu- lation process simultaneously. The main features are as follows.
1) At the flow developing stage, the particle mass con- centration pattern develops as the flow vorticity develops. The distribution is nearly uniform, with the value of 0.1, at the lower reaches of the nozzle exit and the region is finally stretched to nearly a quarter of the entire domain length.
Max = 1.19e−2, Min = −8.40e−4
(a)
Max = 5.75e−3, Min = −2.87e−5
(b)
Max = 5.70e−3, Min = −2.99e−5
[image:4.595.57.291.89.520.2](c)
Figure 4. The results of Q −Q0 for different particle diame- ters at t = 2000. (a) dp = 1 nm; (b) dp = 10 nm; (c) dp = 50 nm. central axis region to the outer mixing layer of jet.
3) When the flow is fully developed, at the front of the jet flow, particles distribute more homogeneous for they have more residence time to diffuse from higher concen- tration region, i.e. core region of the vortex, to the lower
concentration region, i.e. outer region of the vortex.
4) The time averaged particle concentration distribu- tion patterns are similar to Gaussian distribution form. Furthermore, the curves are steeper at the positions clos- ing to the nozzle exit but flatter far away from the exit.
5) The maximum concentration contributed by diffu- sion is present at the mixing layer near the nozzle exit. The farther away from the nozzle exit in the cross-stream direction, the smaller the concentration is. The maximum concentration contributed by diffusion is several order
smaller than that contributed by flow convection.
5. Acknowledgements
This work is supported by National Natural Science Foundation of China (Grant No. 50976107, 51206149 and 51006090), National Key Technology R&D Program of China (Grant No. 2009BAF39B01), Zhejiang Provin- cial Natural Science Foundation of China (Grant No. LQ12A02002 and D1080780), Zhejiang Science Tech- nology Project (Grant No. 2011C11073) and the Science Foundation of Zhejiang Sci-Tech University of China (Grant No. 1003808-Y).
REFERENCES
[1] M. Yu and J. Lin, “Nanoparticle-Laden Flows via Mo-ment Method: A Review,” International Journal of Mul-tiphase Flow, Vol. 36, No. 2, 2010, pp. 144-151.
doi:10.1016/j.ijmultiphaseflow.2009.08.006
[2] W. Daungthongsuk and S. Wongwises, “A Critical Re-view of Convective Heat Transfer of Nanofluids,” Re-newable and Sustainable Energy Reviews, Vol. 11, No. 5,
2007, pp. 797-817. doi:10.1016/j.rser.2005.06.005 [3] S. Wang and M. V. Johnston, “Airborne Nanoparticle
Characterization with a Digital Ion Trap-Reflectron Time of Flight Mass Spectrometer,” International Journal of Mass Spectrometry, Vol. 258, No. 1-3, 2006, pp. 50-57. doi:10.1016/j.ijms.2006.07.001
[4] N. Settumba and S. C. Garrick, “Direct Numerical Simu-lation of Nanoparticle CoaguSimu-lation in a Temporal Mixing Layer via a Moment Method,” Journal of Aerosol Science,
Vol. 34, No. 2, 2003, pp. 149-167. doi:10.1016/S0021-8502(02)00147-7
[5] J. Lin, P. Lin and H. Chen, “Nanoparticle Distribution in a Rotating Curved Pipe Considering Coagulation and Dis-persion,” Science China-Physics Mechanics & Astronomy,
Vol. 54, No. 8, 2011, pp. 1502-1513. doi:10.1007/s11433-011-4386-x
[6] J. Lin, P. Lin, M. Yu and H. Chen, “Nanoparticle Trans-port and Coagulation in Bends of Circular Cross Section via a New Moment Method,” Chinese Journal of Chemi-cal Engineering, Vol. 18, No. 1, 2010, pp. 1-9.
doi:10.1016/S1004-9541(08)60315-8
[7] Z. Zhang, C. Kleinstreuer, J. F. Donohue and C. S. Kim, “Comparison of Micro- and Nano-Size Particle Deposi-tions in a Human Upper Airway Model,” Journal of Aero-sol Science, Vol. 36, No. 1, 2005, pp. 211-233.
doi:10.1016/j.jaerosci.2004.08.006
[8] W. C. Reade and L. R. Collins, “Effects of Preferential Concentration on Turbulent Collision Rates,” Physics of Fluids, Vol. 12, No. 10, 2000, pp. 2530-2540.
doi:10.1063/1.1288515
[9] L. Sun, J. Lin and F. Bao, “Numerical Simulation on the Deposition of Nanoparticles under Laminar Conditions,”
Journal of Hydrodynamics, Vol. 18, No. 6, 2006, pp. 676-
680. doi:10.1016/S1001-6058(07)60006-7
Simu-lation of a Planar Jet Flow with Nanoparticle Coagula-tion,” Acta Mechanica Sinica, Vol. 22, No. 4, 2006, pp. 293-300. doi:10.1007/s10409-006-0011-z
[11] M. Yu, J. Lin and L. Chen, “Nanoparticle Coagulation in a Planar Jet via Moment Method,” Applied Mathematics and Mechanics, Vol. 28, No. 11, 2007, pp. 1445-1453.
doi:10.1007/s10483-007-1104-8
[12] F. Gelbard, Y. Tambour and J. H. Seinfeld, “Sectional Representations for Simulating Aerosol Dynamics,” Jour-nal of Colloid and Interface Science, Vol. 72, No. 5, 1980,
pp. 541-556. doi:10.1016/0021-9797(80)90394-X [13] H. Shi, C. Kleinstreuer, Z. Zhang and C. S. Kim,
“Nanopar-ticle Transport and Deposition in Bifurcating Tubes with Different Inlet Conditions,” Physics of Fluids, Vol. 16,
No. 7, 2004, pp. 2199-2213. doi:10.1063/1.1724830 [14] A. Md and R. Og, “Slip Correction Measurements of Sphe-
rical Solid Aerosol-Particles in a Improved Millikan Ap-paratus,” Aerosol Science and Technology, Vol. 4, No. 3,