J. Range Manage.
55:171-181 March 2002
Vegetation responses following wildfire on grazed and ungrazed sagebrush semi-desert
NEIL E. WEST AND TERENCE P. YORKS
Authors are Professor and Research Associate, respectively, Department of Rangeland Resources, Utah State University, Logan, Utah 84322-5230.
Abstract
A 20-year set of cover data on sagebrush semi-desert plant communities responding to wildfire and livestock grazing near Mills in central Utah provided an opportunity to compare the assumptions and adaptability of classical and state-and-transi- tion models for describing secondary succession. Cover data were organized and analyzed by plant species, growth forms, and other ground cover classes. Graphical analysis, ordination (employing semi-strong hybrid multi-dimensional scaling), regression, and analysis-of-variance were used to determine whether the patterns observed were best described as community change (tightly linked species) or individualistic change (each species acting independently). Distinct differences in total plant cover, growth form, and species composition were found between burned (both grazed and ungrazed) and the unburned and grazed treatments. Conventional graphical and statistical analy- ses of burned and ungrazed plots showed greater and earlier expansion of perennial grasses and then relatively less cover- weighted compositional change in recent years compared to the other treatments. Vegetation on none of the treatments appears to have stabilized toward either the pre-burn sagebrush semi- desert, a new state or the potential natural community for the site involved. Pathways of change reflected in the ordinations have been complex in all treatments. The only obvious trends in responses of individual species were to fire and the inverse rela- tionship of cheatgrass to total perennial vegetational cover. All this evidence points to few tight linkages between species or growth form groups and thus favors viewing these patterns indi- vidualistically. While the state-and-transition model allows greater flexibility than the classical model in the depiction of plant community/individual species changes consequent to any management action, it doesn't apply readily everywhere, as exemplified by this case study.
Key Words: community dynamics, Clementsian model, state- and-transition model, ordination, trend, condition
Research was funded by the Utah Agricultural Experiment Station of which this journal is Paper No. 7289. This research would have not been possible without permission from previous landowners as well as the current land owner, Ben Gambino. Also, a long list of students and the West family helped in annually col- lecting the data. All data and ancillary records are deposited in the Archive Section of the Merrill Library at Utah State University. Special thanks go to Susan Durham and Jim Haefner for advice on analysis methods.
Manuscript accepted 13 Apr. 01.
Resumen
Un juego de datos de 20 anos sobre cambios de la cobertura vegetal de comunidades semideserticas de "Sagebrush" en respuesta a fuegos naturales y apacentamiento de ganado de areas cerca de Mills, en la parte central de Utah, dieron una oportunidad para comparar los supuestos y la adaptabilidad de los modelos clasicos y los de estado y transicion para describir la sucesion secundaria. Los datos de cobertura fueron organizados y analizados por especies de plantas, formas de crecimiento y otras clases de cobertura de suelo. El analisis grafico, la orde- nacion (empleando un hibrido semi-fuerte de escalamiento mul- tidimensional), el analisis de varianza y regresion se utilizaron para determinar si los patrones observados fueron los mejores para describir como cambia la comunidad (especies fuertemente ligadas) y los cambios individualisticos (cada especie actuando individualmente). Se encontraron distintas diferencias entre los tratamientos de quema (ambos, apacentados y sin apacentar) y los sin quema y apacentados, diferencias respecto a la cobertura vegetal total, la forma de crecimiento y la composicion de especies. Los analisis graficos y estadisticos convencionales de las parcelas quemadas y sin apacentar mostraron una expansion mayor y mas temprana de los zacates perennes y por to tanto un cambio relativamente menor de composicion ponderada por cobertura en los anos recientes comparado con otros tratamien- tos. En ninguno de los tratamientos la vegetacion parece haberse estabilizado hacia las condiciones previas a la quema del
"Sagebrush" semidesertico, un nuevo estado o la comunidad nat- ural potencial del sito involucrado. Las rutas de cambio refle- jadas en los ordenamientos han sido complejas en todos los tratamientos. Las unicas tendencias obvias en las respuestas de las especies individuales fueron al fuego y la relacion inversa del
"Cheatgrass" con la cobertura vegetal total perenne. Toda esta evidencia apunta a unos pocos vinculos fuertes entre grupos de especies o formas de crecimiento y de este modo favorece el ver estos patrones enforma individual. Mientras el modelo de estado y transicion permite una mayor flexibilidad que el modelo clasi- co en la representacion de los cambios de especies individuales o comunidades en consecuencia de cualquier accion de manejo, este no aplica facilmente en todas partes, como se ejemplifica en este caso.
Basic ecologists, beginning about 1958, have rejected the lin- ear, gradual, deterministic and reversible model of succession to climax (called the "classic" model here) associated with F.E.
Clements (Burrows 1990). Rangeland ecologists slowly accepted this situation and have been searching for a replacement theory (Lauenroth and Laycock 1989) and a more modern means to
JOURNAL OF RANGE MANAGEMENT 55(2) March 171
monitor rangeland trend and judge condi- tion (West and Smith 1997). Some (e.g.
Laycock 1991, 1995) think that the state-
and-transition model (Westoby et
al. 1989a) will be that replacement. Joyce (1993), however, cautions the profession not to abandon older ways of applying successional theory to the monitoring of trend and assessment of condition until we have adequate means of operating within a new theoretical framework. Scarnecchia (1995) persuasively argues that theory and methods should not be intimately linked if the profession is to mature. Both theory and methods will continue to evolve inde- pendently anyway.
The classic successional model is based on a mechanical metaphor (Botkin 1990), the static concept of stability (lack of change unless disturbed), and an ability to return to the previously defined single state of constancy (climax) after distur- bance (Joyce 1993). The classic model assumes tight linkages between species and positive feedback of plants in chang- ing microclimate and soils (facilitation) and advocates steady, unidirectional
change toward climax. The state-and-tran-
sition model (Westoby et al. 1989a, 1989b) implies that plant community com- position makes dramatic changes only dur- ing times of unusual environmental influ- ences. Furthermore, the species composi- tion of differing plant communities in par- ticular states, on a particular ecological site, fluctuate within defined limits (Treshow and Allan 1985), which can also be expressed as several domains of attrac- tion, or boundedness (Lewontin 1969, Friedel 1991, Crowley 1992), depending on the degree of responses to disturbance.
Most modern observers consider the longer-term, directional differences
between species presence and abundances within stands of vegetation occupying the same ecological sites and enduring similar treatments to indicate individualistic change (uncoordinated temporal changes by individual plant species in a particular community). While the state-and-transi- tion model is capable of depicting either individualistic or co-ordinated composi- tional change, an examination of data in light of the manager's needs should indi- cate the favored perspective in particular circumstances.
How is a rangeland technician/manager to go about monitoring with this swirl of scientific and technological change about him or her? Rather than just considering these needs abstractly, we find it useful to work with case studies and analyze data in alternative ways. The following reviews
how a 20-year interannual set of data on plant community and soil surface exposure in a sagebrush semi-desert area changed after wildfire. Some of the plots were sub- sequently grazed, but other plots were pro- tected from livestock grazing. We will compare the responses in these differing treatments with competing theoretical and analytical frameworks.
Our objective was to opportunistically examine changes in vegetation cover and bare soil in a Utah instance and compare the assumptions and adaptability of classi- cal and newer models of secondary suc- cession. In particular, we wished to com- pare data organized by plant species, growth forms and other ground cover classes, analyzed by statistical, graphical and ordinational techniques. The literature led us to expect that alternate stable states would be created by wildfire, particularly when followed by livestock grazing.
Detection of the several putative stable states was expected to be most easily dis- cerned by ordination. We also expected that there would be evidence of tight rather than loose or no connections between species and growth forms as they replaced each other over time.
Materials and Methods
The study site is located on privately- owned land 7.9 km west of the village of Mills, Juab Co. in central Utah (39° 29' N, 112° 7' W) on a dissected fan remnant or
ballena (Peterson 1981) on the northeast- ern flank of the Canyon Mountains. Slopes are 1 to 2% east-facing, with elevations ranging between 1,617 and 1,622 meters (5,305 to 5,320 ft). Mean annual precipita- tion is about 300 mm and is, on average, concentrated from October to April. The mean annual air temperature is about 8° C (Trickler and Hall 1984).
Soils in the study area were mapped as
Borvant cobbly loam, 2-8% slopes (Trickier and Hall 1984). Profiles are mostly shallow, with less than 50 cm of calcareous, gravelly to very gravelly loam above a petrocalic horizon, which overlies stratified layers of gravelly loam and cal- cium carbonate-cemented material (Boettinger et al. 1997). These soils are classified as loamy-skeletal, carbonatic, mesic shallow Petrocalcic Paleoxerolls.
The designated ecological site is Upland Shallow Loam (Juniper-Pinyon) with a potential natural community composed of 40% perennial grasses, 10% perennial forbs and 50% shrubs (by relative contri- bution to peak new growth phytomass)
(Trickler and Hall 1984).
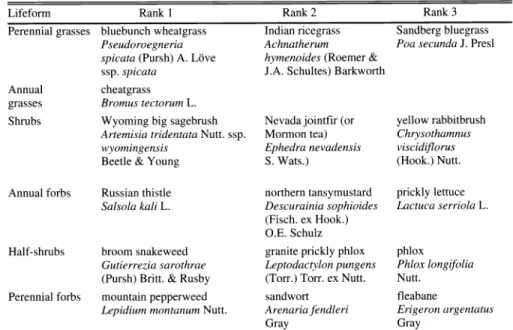
Vegetation at the study site immediately pre-burn and during the first 3 years of recovery following the wildfire of 26 July 1981 have been previously reported (West and Hassan 1985). This earlier paper also has further details about the fire. Since these responses to the pulse treatment of the fire were likely transitory (Tilman 1988), subsequent vegetational change was of continuing interest. Table 1 lists
Table 1. The 3 plant species contributing the greatest average cover in each of 5 lifeform classes at our study site.
Lifeform Rank 1 Rank 2 3
Perennial grasses bluebunch wheatgrass Indian ricegrass bluegrass Pseudoroegneria Achnatherum Poa secunda J. Presl spicata (Pursh) A. Love hymenoides (Roemer &
ssp. spicata J.A. Schultes) Barkworth
Annual cheatgrass
grasses Bromus tectorum L.
Shrubs Wyoming big sagebrush Nevada jointfir (or rabbitbrush Artemisia tridentata Nutt. ssp. Mormon tea) Chrysothamnus
wyomingensis Ephedra nevadensis viscid(florus
Beetle & Young S. Wats.) (Hook.) Nutt.
Annual forbs Russian thistle northern tansymustard lettuce
Salsola kali L. Descurainia sophioides Lactuca serriola L.
(Fisch. ex Hook.) O.E. Schulz Half-shrubs broom snakeweed granite prickly phlox
Gutierrezia sarothrae Leptodactylon pungens Phlox longifolia (Pursh) Britt. & Rusby (Ton) Torr. ex Nutt. Nutt.
Perennial forbs mountain pepperweed sandwort
Lepidium montanum Nutt. Arenaria fendleri Erigeron argentatus
Gray Gray
Plant name source: USDA, MRCS 1999. The PLANTS database (http://plants.usda.gov/plants).
172 JOURNAL OF RANGE MANAGEMENT 55(2) March 2002
Plots
1982-2000 ...981 ...
...1982.2000 UG
BG1
BG2
I
BG3
.,
Treatments
Burned and Ungrazed
use. Neither the owner or leasee were will- ing to provide specifics of the grazing arrangement. We, therefore, can provide only qualitative impressions that there were usually "moderate" levels of grazing on the areas outside the fenced exclosures.
Livestock grazing prior to collection of data would have a negative impact on the amount of plant cover remaining in the unfenced plots. Also there were some years late in the time series when cattle had not used the areas around the exclo- sures at all. These less frequent circum- stances will be pointed out in the discus- sion of results. The pre-burn rangeland at this site was considered to be in "high good" (late seral) condition in 1981 by conventional methods (West and Hassan 1985).
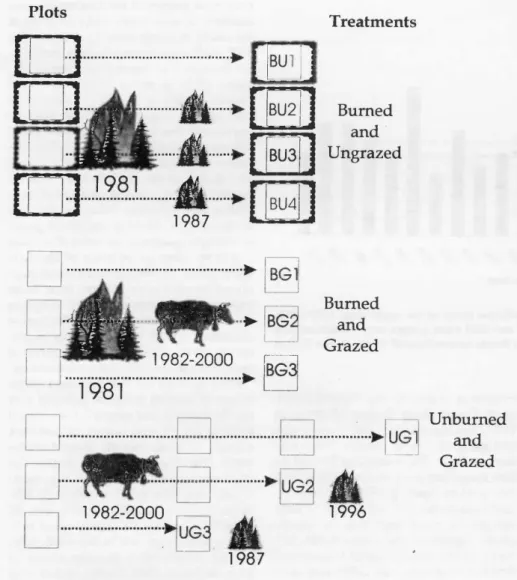
The 4 exclosures (burned and ungrazed) and the unfenced, burned and grazed plots measured 20 m by 50 m. Four exclosures (each 20 m by 50 m in size) were fenced during the fall of 1981 on comparable seg- ments of the largely burned ballena. These constituted the 4 replicates of the burned and ungrazed treatment. Four other areas of 20 m by 50 m size in adjacent locations on similar terrain were also marked out at that time. These involved the burned and grazed treatment. Both of these treatments constituted subsamples of the larger avail- able burned areas. The rarer unburned and grazed patches had to be sampled by three, 20 m by 20 m macro-plots and occupy most of the "islands" left within the most- ly burned ballena. Five years following initiation of the study, some of the area outside the fenced exclosures was chained by the owner to topple scattered, fire- killed juniper snags. This activity serious- ly altered 1 of the unburned and grazed replicates and further sampling was not done there.
A second wildfire occurred on a subset of the original plots before the 1987 data collection. However, because of a drought (Fig. 2) and consequent lack of continuous fine fuel, the effects of that fire were very patchy. From yearly photographs taken at permanent points and field journal notes, it appeared that Exclosures #2 and #3 were partially impacted, Exclosure #1 escaped entirely, and Exclosure #4 was completely reburned. Effects of the second fire on the vegetation were no longer either visually or statistically discernable the year follow- ing its occurrence in early July 1987.
None of the grazed plots were impacted by the 1987 fire. In 1996, shortly after data collection, 1 of the unburned and grazed plots was burned, and so lost for further comparisons.
Burned and Grazed
...)0- UG1
Unburned and Grazed
1987
1996
Fig. 1. Summarization of disturbance history for the various treatments.
the 3 most important plant species (in terms of average cover) in each of the life- form categories used.
The history of the treatments is summa- rized in Figure 1. Pre-fire vegetational and ground surface data were collected in 1981 within 4 original macro-plots used for another study (Hassan and West 1986).
Establishment of a new well following the fire made a previously unwatered and lightly grazed portion of the 4,700 ha pas- ture, of which the study site is in the northwestern corner, accessible to cattle grazing. In order to opportunistically observe the changes in vegetation after fire, with and without the concomitant press-type (Tilman 1988) effect of live- stock grazing, the 4 original macro-plots were separately fenced and 2 storage gauges for crop-year (1 September to 30 June) precipitation were established within 2 of the 4 exclosures within the burned and ungrazed treatment (Fig. 1).
Additional macro-plots were established outside of the exclosures on the same eco- logical site to conduct an ad hoc "experi- ment" on vegetation dynamics in burned and unburned patches under grazed condi- tions (Fig. 1). Large enough unburned patches on the same ecological site were, unfortunately, unavailable to also fence and thus balance the design. Monitoring to support adaptive resource management will, however, require compromises between the scientists' need for experi- mental rigor with managers' needs for timely decision making (Szaro 1999, Thomas and Birchfield 2000).
All available treatments were replicated (Fig. 1), although numbers of replicates varied with the opportunities available.
The study area had probably been lightly grazed in winter by sheep several decades before the wildfire event. The owners dur- ing the early part of our study period, however, leased the land only for cattle
JOURNAL OF RANGE MANAGEMENT 55(2) March 173
600
Crop Year
Fig. 2. Total crop-year (Sept. 1-June 30) precipitation (mm) at the study area, 1981-2000.
Average of two storage gauges, except 1981-3 and 1988 when gauges were vandalized and an estimate was made by correlation with the Scipio station located 26 km to the SSE at 1,615 m elevation, r2 = 0.67.
Both cover and end-of-growing season aboveground plant standing crop data were collected in 1982 (West and Hassan 1985). The latter was time-consuming, and if repeated annually, would have severely altered the vegetation on these relatively small macro-plots. Thus, only the cover in the topmost layer in the sward was estimated after 1982 in all plots.
Canopy cover data are also more easily related to remotely-sensed imagery than phytomass. Canopy cover data were rapid- ly and non-destructively collected, using a gimbaled point technique (Winkworth and Goodall 1962), near the end of each grow- ing season (third week of July). One hun- dred stations, from random starting points for 4 stepped off transects, were visited per macro-plot, and readings interpreted as
percentage canopy cover of the current year's plant growth. Bare soil, gravel, rock, microphytes (moss + lichen), stand- ing dead and litter were also enumerated where no live plants occurred directly above a point (sampling station). These sample numbers were considered adequate to detect changes in total community cover and cover classes greater than 3%, through duplicate sampling 1 day apart in 1993 (Hosten 1995). Treshow and Allan (1985) employed similar numbers of sub- samples for comparable vegetation.
In addition to graphing cover over time for total live and dead cover, growth form groups and species composition in each plot, ordination diagrams were used to dis- cern temporal trends in total canopy cover-weighted plant community species composition within each replicate of each
treatment. Semi-Strong Hybrid (SSH) Multi-Dimensional Scaling (Faith et al.
1987) was the chosen indirect ordination tool using the PATN (Belbin 1992) soft- ware package. The continuous form of the Kulczynski Similarity Index (Belbin 1992) was used as input. Judging the similari- ties/dissimilarities of ordinations is diffi- cult just by visual inspection. In order to judge "tightness" and similarity/dissimi- larity of the successional trajectories between treatments, we calculated mean distances between sequential points in
100 ,
90 7
80
Lifeforms
time, total lengths of the time trajectories, numbers of crossovers, and directions of the yearly segments from the centroid. The SSH multi-dimensional scaling was cho- sen because it produces a measure of ade- quacy of fit to the scattergram termed
"stress" (Faith et al. 1987). "Stress" is analogous to distances of points from the regression line in a least squares sense (Dillon and Goldstein 1984, p. 129). The values of "stress" potentially range from 0 to 1.0, but points with "stress" values above 0.2 are considered unreliable
(Dillon and Goldstein 1984) and thus not discussed here. Discrete clusters of points in different quadrants of ordination space would be taken as evidence of alternate stable states. Closely clustered points [sep- arated by distances shorter than those expected by a combination of sampling error and those due to climatic fluctuation (Rabotnov 1974)] would be taken as evi- dence of no ecologically significant change in species or lifeform composition.
Data bearing on the classical static
notion of stability could be gathered only on the burned and ungrazed treatment because the chronic impact of livestock grazing occurred outside these 4 exclo- sures. The degree of return to pre-fire plant community composition was ascer- tained from both graphs of cover by life- forms and from ordination diagrams by visually comparing the placement of ordi- nation points against a background repre- senting ordination of all plots during all years including 1981. Comparison of veg- etation change between all of the treat-
E3 Shrubs
0 Half Shrubs DAnnual Forbs
0 Perennial Forbs
Annual Grasses IN Perennial Grasses
c0, C b CP °` (§h CP A owl 0 CP CP g0CP 01q CP OP 4b (P 4b °Pa°1 Year
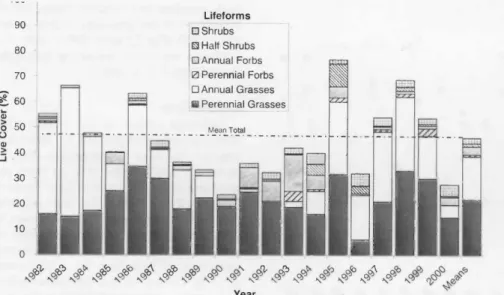
Fig. 3. Total and growth form canopy cover due to live plants within the burned and ungrazed exclosures, 1981-2000.
174 JOURNAL OF RANGE MANAGEMENT 55(2) March 2002
90
80
30
20
10
0
Lifeforms Shrubs Half Shrubs
o Annual Forbs
® Perennial Forbs Annual Grasses Perennial Grasses
q' 91 P P -,A 2,I 9q q° 51 C` C q q qp qIA q> qq O°
Nq Nq _Iq 116 NO) ,q Nq ,0q Nq Nq Nq Nq Nq Nq Nq N`6 Nq Nq p Year
Fig. 4. Total and growth form canopy cover due to live plants within the burned and grazed macro-plots, 1982-2000
ments could be legitimately done with 1982 and older data because ordination space is flexible and relational, changing as data are added or subtracted (Dillon and Goldstein 1984). The placement of data points representing plots outside the exclosures, where cattle usually grazed, were compared to those inside the exclo- sures to determine possible additive effects of grazing and the interactions between burning and grazing.
While the graphical and ordination approaches helped us to visualize the important changes in vegetation within these plots over time, we also needed a means of deciding whether the differences observed had statistical significance.
Accordingly, commercial statistical soft- ware packages were used; JMP @ was the basis for regression, and SYSTAT® for testing ANOVA models.To address the
of available data (Fig. 3). Live plant cover appeared to increase during wet periods and decline during droughts (Figs. 2 and 3). The correlation of total live cover to total precipitation received during the pre- ceding crop year was, however, only 0.42 (p = 0.07), indicating lagged soil moisture effects and other influences on plant cover were also probably operative.
Mean total live plant cover within the 3
burned and grazed plots (Fig. 4) followed the same trends as the burned and ungrazed macro-plots, except that the average cover was 46%, and minima (22%) and maxima (73%), each of which were less than on the burned and ungrazed treatment even though no cattle grazing took place on these unfenced macro-plots
100
possibility of lack of independence 90
between years (serial correlation), we used a general linear mixed model for longitu- dinal data incorporating each macroplot as a block (accommodating variability
among them) and explicitly accounting for the covariance among repeated measures within a macroplot (Verbeke 1997). A 5% probability for false separation among least square means was the chosen level of statistical significance.
Results and Discussion Mean Total Cover
Mean total cover due to living plants within the four burned and ungrazed exclosures averaged 57%, but varied between 37% and 79% over the 20 years
80 - 70
60
ao
o 50
0
a>
> 40
J
30 20
10
0
Lifeforms
23 Shr ubs
® Half Shrubs
in 1997, 1999, and 2000.
Mean total live cover in the unburned and grazed plots (Fig. 5) followed similar trends with the average cover (47%) and maxima similar (68%, in 2 different
years), whereas the minimum was greater (37%) than the other grazed treatment.
Shrub Cover
Prior to the fire of 1981, shrubs, which were mostly Wyoming big sagebrush (West and Hassan 1985), constituted 32%
of live plant cover on the 4 burned and
ungrazed macro-plots (Fig. 3). The unburned and grazed remnants had 22 to 26% relative shrub cover for the first 3
years following the 1981 fire (Fig. 5). That proportion increased only slightly over the next 17 years (Fig. 5). The shrub cover increase on the burned areas was mainly due to Mormon tea. This shrub has shown several periods of growth (sometimes exceeding its pre-burn cover about two- fold) and diminishment that were not always synchronous in the 3 treatments (Fig. 6). Artemisia has been slow to reestablish at our burned locations. The return of sagebrush at this sagebrush semi- desert (West 1983) site is much slower following fires than in sagebrush steppe (Bunting 1984, Britton and Clark 1984, West 2000). As Treshow and Allen (1985) found for another sagebrush semi-desert site in Utah, shrub cover varied little dur- ing the period of study on the unburned but grazed plots (Fig. 5). The dominant Wyoming big sagebrush is a deep rooted evergreen known not to vary as much as herbaceous species in response to drought (Passey et al. 1982).
Annual Forbs
0 Perennial Forbs DAnnual Grasses Perennial Grasses
Year
Fig. 5. Total and growth form canopy cover due to live plants within the unburned and grazed macro-plots, 1982-2000.
JOURNAL OF RANGE MANAGEMENT 55(2) March 175
Treatment
o-- Burned and Ungrazed
--o- Burned and Grazed
a Unburned and Grazed
\°P O 03 O' 0' RCN q C °J q q q '\ O fig q C
Year
absolute and relative contributions to live cover decreased nearly to 0 from 1989 to 1993 (Hosten and West 1994) on all treat- ments during the greatest drought occur- ring during the study period (Fig. 2).
Annual grasses, however, increased in
Fig. 6. Mean total canopy cover due to Mormon tea observed in the three treatments from 1982-2000.
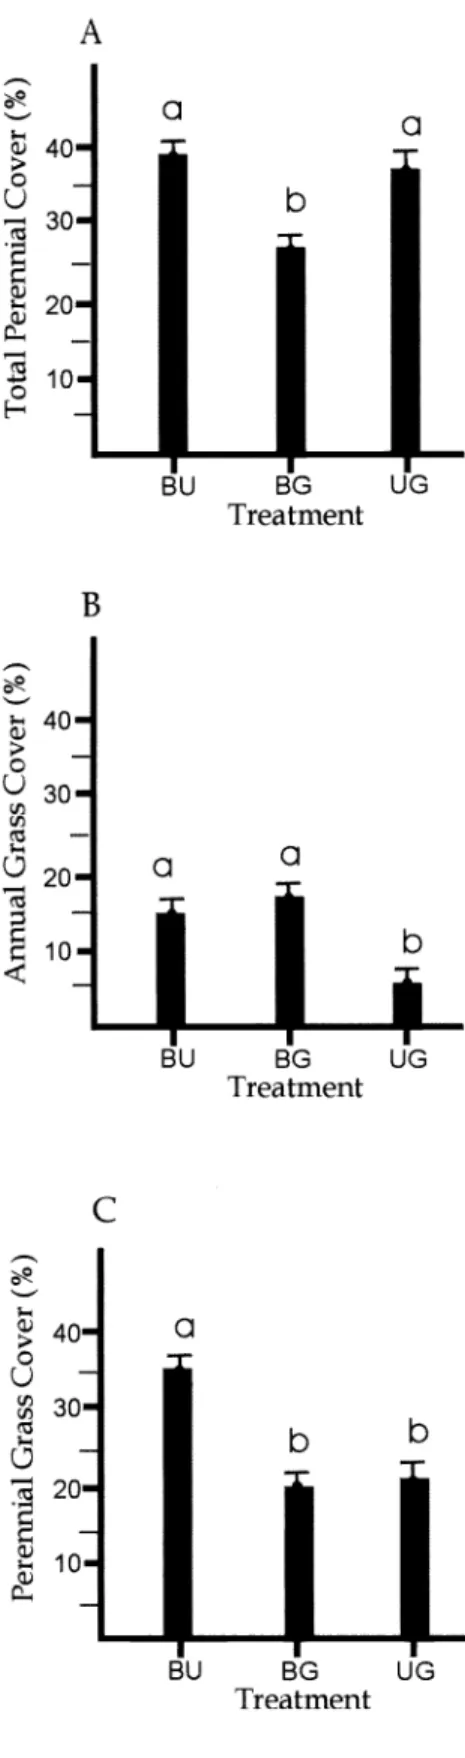
Perennial Grass Cover
Perennial grasses constituted about 32%
cover (55% of the relative live cover) in
1981 before the first fire (Fig. 3). After an initial large reduction due to the fire, rela- tive cover of the perennial grasses in the burned and ungrazed treatment increased steadily until 1994 when the second drought during the study period began (Fig.
2). Absolute cover of perennial grasses also increased until 1994 in this treatment (Fig.
3). Since 1994 perennial grass cover has fluctuated and other perennial life forms (half-shrubs, forbs) have increased, both in relative and absolute senses.
Perennial grass cover on the burned and grazed plots increased during the first 5
years following the 1981 fire and then fluc- tuated greatly (Fig. 4), apparently mainly due to variations in both precipitation (Fig.
2) and grazing. No apparent cattle grazing occurred here in 1997, 1999, and 2000.
Moderate levels of utilization were qualita- tively observed until 1996 when the heavi- est degree of cattle grazing was noted.
Perennial grass cover in the unburned and grazed macro-plots has varied the least of any growth form over time (Fig.
5), never exceeding 30% absolute cover or 50% of relative live cover. This is appar- ently a result of the continuing control of the micro-environment in these patches by
sagebrush (Pierson and Wight 1991, Treshow and Allan 1985).
Annual Grass Cover
Annual grasses were the major cover component on all burned macro-plots from 1982 to 1984 (Figs. 3 and 4). Their
2 -1
1-
X 0
-1
-2
-2 -1 0 1 2
Axis 1
a. o
a
b
both absolute and relative senses on all treatments in the generally wetter period since 1993 (Fig. 2), until 2000, when pre- cipitation was again below the long term mean (Figs. 2, 3, 4, and 5).
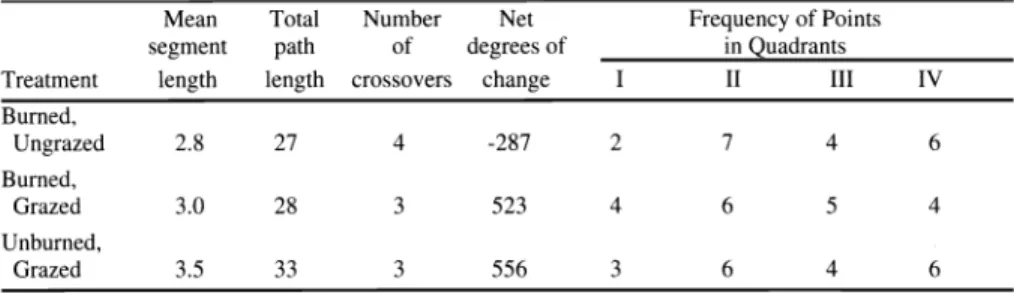
Ordinations
Although copies of full tabular data showing cover composition by individual species (besides Mormon tea, Fig. 6) under the 3 treatments over 20 years are available from the authors, their demand for printed space precludes their publica- tion here. Accordingly, we have chosen to graphically show the overall changes in plant community composition through ordination of data from the 3 treatments (Fig. 7). Ordination is a dimension-reduc- ing, pattern-seeking, relational technique.
That is, the dimensions of covers of all individual species or growth form cate- gories are reduced to 2 dimensions (axes) so the results of the multivariate analyses can be viewed on paper.
To test the sensitivity of ordination to differences in data input, we compared the SSH ordinations of the burned, ungrazed treatment with and without the 1981 pre- burn data. This created trajectories which started and stopped in differing quadrants
2-
X 0
-2
-2 -1 0 1 2
Axis 1
2-I
N x 0
-1
-2 -2
T
-1
UG
C
d BG
0 1 2
Axis 1
Fig. 7. Ordination of mean cover-weighted plant species composition in the three treatments from 1982-2000. The gray area represents the overall area within which points were found through ordinations of individual macro-plots.
BU (excluding 1981)
176 JOURNAL OF RANGE MANAGEMENT 55(2) March 2002