Munich Personal RePEc Archive
Association between inflation rates and
inflation uncertainty in quantile
regression
Alimi, R. Santos
Economics Department, Adekunle Ajasin University,
Akungba-Akoko, Nigeria
12 June 2017
Online at
https://mpra.ub.uni-muenchen.de/79683/
1
Association between inflation rates and inflation uncertainty in quantile regression
R. Santos Alimi Economics Department
Adekunle Ajasin University, Akungba-Akoko Ondo State, Nigeria.
rasaq.alimi@aaua.edu.ng, santos4rd@gmail.com
Abstract
Inflation and its associated uncertainty impose costs on real economic output in every economy. In developing economies, this welfare cost is higher than those obtainable in developed countries because inflation rate is still higher than desired, mostly double-digit in Africa. In contrast to conventional conditional mean approaches, this study employed quantile regressions and cross-sectional data from 44 African countries for the period 1986 to 2015 to examine the relationship between the level of inflation and inflation uncertainty.
This study considers two measures of inflation – Inflation rate and mean inflation, and three different measures of inflation uncertainty – standard deviation, relative variation and median deviation of the inflation rate. The study found evidence of positive and significant association between inflation and its uncertainty across quantiles. It also found that higher inflation brings about more inflation variability, thereby supporting the Friedman-Ball hypothesis and on the other hand high inflation uncertainty prompts rises in inflation, confirming the Cukierman-Meltzer hypothesis. The study therefore recommend that policy makers should target low average inflation rates in order to reduce the negative consequences of inflation uncertainty, which in turn can improve economic performance in Africa.
Keywords: inflation, inflation uncertainty, inflation targeting, quantile regression
1. Introduction
Inflation is considered to be a major economic problem all over the world; therefore, the
central banks devote a significant amount of resources at their disposal to fight it. Hence, the
primary objective of monetary policy is to ensure price stability. The focus by most central
banks on price stability derived from the overwhelming empirical evidence that it is only in
the midst of price stability that sustainable growth can be achieved. Price stability however
2
general price level is such that economic agents do not worry about it. Thus inflationary
conditions imply that general price level keeps increasing over time.
The policy makers are so obsessed about inflation because of its implication on the
economy. Low and stable inflation rates allow the private sector to plan for the future which
leads to a lower need for costly price adjustments, prevent tax distortion and thus create a
stable business environment. On the other side, high and unstable inflation, discourages long
term planning, reduces savings and capital accumulation, reduces investment, brings about
shift in the distribution of real income and consequent misallocation of resources and creates
uncertainty and distortions in the economy (Friedman, 1977; Dotsey and Ireland, 1996;
Lucas, 2003). Therefore, inflation rate serves as the nominal anchor on which the central
banks rely to maintain price stability. However, in managing the inflation rate in an economy,
information on the link between inflation and its uncertainty play an important role (Elder,
2004;Fountas et al., 2006; Chowdhury, 2014).
Accordng to Tsyplakov (2010), a paramount question of the monetary theory is
whether the inflation rates are positively correlated with uncertainty about the future price
level and whether a causal link exists between inflation and inflation uncertainty. Hence, the
direction of the relationship between inflation rates and its uncertainty has become the focus
of theoretical and empirical investigations. Based on the hypothesis that higher inflation is
related to greater inflation uncertainty put forward by Arthur M. Okun, Friedman (1977) and
Ball (1992) provided intuitive and formal arguments that show a positive influence of higher
inflation on the uncertainty about inflation. The main thrust of their argument hinges on the
uncertainty on the part of agents in an economy trying to gauge the preferences of monetary
policy makers toward inflation and the policy responses to rising rate of inflation
(Sintim-Aboagye and Byekwaso, 2005). Cukierman and Meltzer (1986) on the other hand present a
3
that an increase in uncertainty about money growth and inflation will increase the optimal
average inflation rate because it provides an incentive to the policymaker to create an inflation
surprise in order to stimulate output growth.
Other theoretical explanation of the inflation and inflation uncertainty link is provided
by Pourgerami-Maskus and Holland Hypotheses, which reject the harmful effect high
inflation has on predictability of prices such that negative relation between inflation and
inflation uncertainty thus exist, by these hypotheses. In contrast to Friedman (1977) and Ball
(1992), Pourgerami and Maskus (1987) predicts that an increase in inflation may be
associated with lower average uncertainty, since agents invest more resources in forecasting
inflation. Similarly, Holland (1995) asserts that an increase in inflation uncertainty can bring a
reduction in inflation rate as an outcome of the stabilization policy pursued in times of greater
inflation uncertainty. In the so-called “stabilizing Fed hypothesis”, Holland assumes that
stabilization tendencies of central bank increase in high inflation periods in order to reduce
the welfare costs of disinflationary policies when inflation uncertainty is high (Javed, Khan,
Haider and Shaheen, 2012; Barimah and Amuakwa-Mensah, n.d).
Inflation and its associated uncertainty impose costs on real economic output in every
economy. In developing economies, this welfare cost is higher than those obtainable in
developed countries because inflation rate is still higher than desired, especially in Africa
where inflation rates is often double-digit. Thus, there is need for policy makers in African
region to understand the major channels through which inflation affects the real economy so
as to reduce the detrimental economic consequences and welfare costs of rise in the inflation
rate. According Chowdhury (2011), one of such channel comes from the effects that higher
inflation has on inflation uncertainty. Hence, this study exist to investigate inflation –
4
A significant amount of research has been conducted in developed countries and
emerging economies to establish these hypotheses and mixed results are reported: among the
most recent papers are those by Yeh, Wang and Suen (2009), Tsyplakov (2010), Javed, Khan,
Haider and Shaheen (2012), Hegerty (2012), Nasr, Ajmi, Gupta and Eyden (2014), Falahi and
Hajamini (2015), Bamanga, Musa, Salihu, Udoette, Adejo, Edem, Bukar and
Udechukwu-peterclaver (2016). These studies found the evidence supporting Friedman and Ball
hypothesis using variant of Generalized Autoregressive Conditional Heteroskedasticity
(GARCH), except Tsyplakov (2010) and Nasr, Ajmi, Gupta and Eyden (2014) who employs
Vector Autoregression with timevarying parameters and Gaussian Markov switching vector
autoregressive framework respectively.
Using quantile regression, Fang, Miller and Yeh (2007) finds support for both
Friedman - Ball and Cukierman - Meltzer hypotheses and some other studies confirm the
result employing GARCH framework (Fountas, Karanasos and Karanassou, 2000;
Sintim-Aboagye and Byekwaso, 2005; Barimah and Amuakwa (n.d.); Chowdhury, 2011;
Otenga-Abayie and Doe, 2013; Sharaf, 2015). Testing Cukierman – Meltzer hypothesis, Hachicha and
Lean (2013) confirms the hypothesis for Tunisia while Grier et al. (2004) using GARCH
model on US data and Thornton (2007) study on Israel, Mexico, Colombia and Turkey data,
fail to support Cukierman – Meltzer hypothesis but report that inflation uncertainty affects
inflation rate negatively thus provide evidence for Holland hypothesis.
In contrast to time-series tests in individual countries, this study applies quantile
regressions to the unconditional inflation and inflation uncertainty relationships for a
cross-section of 44 African countries over 1986 to 2015. This study is different from the previous
studies in two regards. First, almost all studies (except Fang, Miller and Yeh, 2007 and Yeh,
Wang and Suen, 2009) on the relationship between inflation and its uncertainty use GARCH
5
least squares (OLS) regression analysis, to determine the mean effects of inflation variables
via the conditional mean regression. These methods only provide summary statistics for
measuring the impact of covariates without characterizing the full distributional impact of
inflation. In contrast, this paper applies the quantile regression introduced by Koenker and
Bassett (1978), to examine the validity of the Friedman-Ball and Cukierman – Meltzer
hypotheses across different quantiles of the unconditional inflation uncertainty distribution.
Contrary to Fang et al. (2007) that applies quantile regression method to examine
two-way causality between inflation and measures inflation uncertainty for 152 countries of both
developed and developing economies from 1993 to 2003, this study focuses on sample of 44
African countries over 1986 to 2015, since, a larger sample size can minimize the chances of
spurious results from relatively few observations. The empirical study that focuses on African
economies is important following the debate on whether implementation of inflation targeting
would help in improving its macroeconomic performance. Hence, the hypotheses which
stipulate that rapid price increases lead to rise in inflation uncertainty and/or its reversal effect
need to be investigated. Since quantile regression has become an ever more important
instrument in estimating quantile-specific effects that describe the impact of variables not
only on the center but also on the tails of the outcome distribution, the study provide new
empirical insight to inflation- inflation uncertainty nexus in Africa.
Second, the study considered a measure of inflation – the mean inflation and three
different measures of inflation uncertainty – the standard deviation, relative variation, median
deviation to examine the robustness of the relationship between inflation and its volatility.
The paper is structured as follows: the next section describes quantile regression
framework and section 3 presents data and method employs in this study. Section 4 provides
estimation and analysis of the results; while section 5 concludes the study and offer policy
6
2. QUANTILE REGRESSION
Quantile regression as introduced in Koenker and Bassett (1978) is an extension of classical
least squares estimation of conditional mean models to the estimation of the whole
conditional distribution of response variable (see Koenker, 2005, for a more recent treatment).
Given the data ( , x ′ for t = 1, . . . , T, where xt is k × 1, consider the following
linear specification for the conditional quantiles of y:
= x + et (1)
where is the dependent variable and xt is a vector of explanatory variables. Our primary
objective is to estimate β for different conditional quantile functions. Assuming that the
specification above is correct, we will be able to depict the conditional distribution in detail
when more quantile regressions are estimated. Moreover, the conditional distribution would
be skewed to the left if the upper quantile lines are close to each other, relative to the lower
quantile lines. It has been found in many applications that the estimated quantile regressions
are quite different across quantiles. This suggests that regressors may have distinct impacts
on the dependent variable at different locations of the conditional distribution (Kuan, 2007).
While the formulation of the quantile regression model is analogous to the
conventional mean regression model, important differences arise in model estimation. The
essential feature of a regression analysis is to examine the manner in which a set of
explanatory variables affects the conditional distribution of a dependent variable. In the
classical econometric techniques (Ordinary Least Squares, Instrumental Variable and
Generalized Least Squares), the component around which the dependent variable randomly
7
amounts to estimating the conditional mean of the conditional distribution of y, the quantile
estimator is employed on different quantiles of the conditional distribution.
As described by Koenker and Bassett (1978), the estimation of β is done by
minimizing equation (2);
̂τ = k [τ∑ + (1- τ) ∑ (2)
The quantile function is a weighted sum of the absolute values of the residuals. Where the
weights are symmetric for the median regression case in τ = ½, the minimization problem
above reduces to k ∑ ( and asymmetric otherwise. It thus can be
observed that varying the parameter τ on the [0,1] interval will generate the entire conditional
distribution of inflation rates and/or inflation uncertainty series. The coefficient βi(τ) can then
be interpreted as the marginal impact on the τth conditional quantile due to a marginal change
in the ith policy variable.
The quantile regression approach makes it possible to identify the effects of the
covariates at different points on the conditional distribution of the dependent variable. For
example, if the dependent variable is the inflation rate and suppose τ =0.05, i.e countries that
are in the left tail of the conditional distribution of inflation rate (low-inflation countries) and
τ =.95, that is, countries that are in the upper tail of the conditional distribution of inflation
rate (high-inflation countries). Under traditional mean regression methods the slope
coefficient is constrained to be the same for all quantiles, as such there is insufficient
information on how policy variables affect countries differently. Mello and Novo (2002)
construed that the ability to distinguish the effects of policy variables among different
8
3. DATA AND METHOD (WITH MODEL SPECIFICATION)
Following Fang, Miller and Yeh (2007), the study estimate the following linear quantile
regression models specified as;
infunci = ατ+ βτinfi + ετi (Friedman-Ball Regression Model) (3)
infi = μτ + δτinfunci + ϵτi (Cukierman-Meltzer Regression Model) (4)
where infunci equals the measure of the inflation uncertainty of country i and infi equals the
measure of the inflation rate of country i; ατ, βτ, μτ and δτ equal parameters to be estimated
for different values of τ, and, ετi and ϵτi are the random error terms. By varying from 0 to 1,
the study can trace the entire distribution of inflation uncertainty (or inflation), conditional on
inflation (or inflation uncertainty). Friedman and Ball predict that βτ > 0 and Cukierman and
Meltzer, that δτ> 0.
Using quantile regressions and cross-sectional data from 44 African countries over the
period 1986 to 2015, the study examines the relationship between inflation and its
uncertainty. For reason discuss in section two, the quantile regression is employed because it
has the appealing feature that allows for estimation of family of unconditional quantile
function which provides a more complete picture of covariate effects. This study considers
two measures of inflation – Inflation rate (equals the annual rate calculated as the percentage
change in the logarithm of consumer price index) and mean inflation (average inflation for
sample countries) and three different measures of inflation uncertainty – standard deviation
(uncertainty1), relative variation (uncertainty2) and median deviation (uncertainty3) of the
inflation rate. The relative variation is defined as standard deviation of inflation divided by
9
4. EMPIRICAL RESULTS
Table 1 shows the summary statistics as well as statistics for the seven countries with the
highest and lowest means and standard deviations of the inflation rates. It reveals that both the
mean and the median exhibit highly right-skewed distributions with outliers, as evidenced by
a larger mean than the median. Therefore, the data features provide justification for the use of
quantile regression since the departures from normality with skewed tails is evident.
Table 1: S ummary of S tatistics Panel A: Descriptive S tatistics
Variable Mean Median S tandard Deviation
Minimum Maximum S kewness Ex. kurtosis
M ean Inflation
11.8540 8.5726 10.3679 1.9252 38.0161 1.4315 0.7447
uncertainty1 13.8761 8.4917 11.8336 3.0548 51.4331 1.5239 1.3867 uncertainty2 0.8493 0.7529 0.4154 0.1182 2.0270 0.7221 -0.0040 uncertainty3 8.9876 5.4168 7.4866 2.1306 31.0264 1.5166 1.1733
Panel B: S even Countries with Lowest Mean Inflation
Zimbabwe M orocco Burkina Faso Niger Cabo Verde Senegal Comoros
Mean Inflation
1.9252 3.1766 3.2342 3.7017 3.7437 3.9009 4.2650
uncertainty1 15.2802 3.2007 4.3647 6.7245 11.2786 6.3903 4.3010 uncertainty2 0.1182 0.7562 0.6028 0.4792 0.3049 0.5278 0.8045 uncertainty3 7.8487 2.6456 3.3173 4.1196 6.3969 3.7486 3.0020
Panel C: S even Countries with Highest Mean Inflation
M ozambique Guinea-Bissau
Ghana Sierra Leone
Uganda Zambia Sudan
M ean Inflation
24.8574 29.6434 30.5316 34.4258 35.6427 37.4695 38.0161
uncertainty1 34.2901 33.9557 22.6779 38.1626 51.4331 40.5662 36.5373 uncertainty2 0.7043 0.8480 1.2894 0.8790 0.6797 0.9014 1.0127 uncertainty3 18.5754 26.3537 13.7001 25.0003 31.0263 25.2893 24.0121
Panel D: S even Countries with Lowest S tandard Deviation Inflation (uncertainty1) M auritius M orocco Tunisia South
Africa
Comoros Burkina Faso Cameroon
M ean Inflation
6.6640 3.1766 5.6308 10.4028 4.0650 3.2342 4.4218
uncertainty1 3.0548 3.2007 3.3503 4.1319 4.3010 4.3647 5.1242 uncertainty2 1.6435 0.7562 1.2943 2.0270 0.8045 0.6028 0.7220 uncertainty3 2.4190 2.6456 2.1306 3.4721 3.0020 3.3173 3.2344
Panel E: S even Countries with Highest S tandard Deviation Inflation (uncertainty1) Nigeria Guinea
Bissau
M ozambique Sudan Sierra Leone
Zambia Uganda
M ean Inflation
23.0215 29.6434 24.8574 38.0161 34.4258 37.4695 35.6427
[image:10.596.62.532.288.777.2]10
Panel F: S even Countries with Lowest Relative Variation of Inflation (uncertainty2) Zimbabwe Cabo Verde Congo
Republic
Gabon Chad Equatorial Guinea
Cote
d’Ivoire
M ean Inflation
1.9252 3.7437 6.4406 5.5432 5.0423 10.6279 4.5894
uncertainty1 15.2802 11.2786 16.2972 13.2096 11.3589 23.1481 8.6662 uncertainty2 0.1182 0.3049 0.3723 0.3901 0.4079 0.4401 0.4747 uncertainty3 7.8487 6.3969 12.4908 9.7489 7.8894 17.6289 4.6133
Panel G: S even Countries with Highest Relative Variation of Inflation (uncertainty2)
M adagascar Lesotho Botswana Egypt Namibia M auritius South Africa M ean
Inflation
14.2862 9.1943 9.3729 10.4731 9.8426 6.6640 10.4028
uncertainty1 9.6014 5.7108 5.8168 6.0250 5.2947 3.0548 4.1319 uncertainty2 1.3475 1.3700 1.3749 1.4908 1.5636 1.6435 2.0270 uncertainty3 6.3262 4.3426 4.6131 4.2582 3.9855 2.4190 3.4721
Panel H: S even Countries with Lowest Median Deviation Inflation (uncertainty3)
Tunisia M auritius M orocco Comoros Cameroon Burkina Faso South Africa M ean
Inflation
5.6308 6.6640 3.1766 4.2650 4.4218 3.2342 10.4028
uncertainty1 3.3503 3.0548 3.2007 4.3010 5.1242 4.3647 4.1319 uncertainty2 1.2943 1.6435 0.7562 0.8045 0.7220 0.6028 2.0270 uncertainty3 2.1306 2.4190 2.6456 3.0020 3.2344 3.3173 3.4721
Panel I: S even Countries with Highest Median Deviation Inflation (uncertainty3) Nigeria M ozambique Sudan Sierra
Leone
Zambia Guinea Bissau Uganda
M ean Inflation
23.0215 24.8574 38.0161 34.4258 37.4695 29.6434 35.6427
uncertainty1 27.9286 34.2901 36.5373 38.1626 40.5662 33.9557 51.4331 uncertainty2 0.7958 0.7043 1.0127 0.8790 0.9014 0.8480 0.6797 uncertainty3 17.6585 18.5754 24.0121 25.0003 25.2893 26.3537 31.0263
From Table 1, the seven countries with the highest inflation rates (standard deviations) face
higher standard deviations (inflation rates), while countries with the lowest inflation rates
(standard deviations) face lower standard deviations (inflation rates). The descriptive statistics
suggests that there is a positive correlation between inflation rate and inflation uncertainty.
Countries such as Burkina Faso, Comoros, Cabo Verde, Morocco and Zimbabwe demonstrate
that low inflation rate correlate with low inflation uncertainty. On the other hand, high
inflation rate goes with high inflation volatility as evident with data from Guinea-Bissau,
Mozambique, Sudan, Sierra Leone, Uganda and Zambia. Nevertheless, some countries such
11
volatility. Therefore, low-inflation countries may exhibit different patterns between inflation
[image:12.596.88.511.175.427.2]rate and its uncertainty from high- inflation countries.
Table 2: Mean and Standard Deviation of the Inflation Rate
Panel A Friedman-Ball Regression Model, infunc = α + β infi+ εi
Variable OLS 0.05 Quantile 0.25 Quantile 0.50 Quantile 0.75 Quantile 0.95 Quantile
α 1.8882 [0.1475] -2.6699a (-9.5163) 0.8803 (0.5812) 1.8755a (2.0296) 3.0149a (4.8526) 11.1308a (3.9975)
β 1.0112a [0.0000] 0.8302a (46.3717) 0.7139a (7.3862) 1.0325a (17.5115) 1.0821a (27.2950) 1.1307a (6.3637)
Panel B Cukierman-Meltzer Regression Model, inf = α + β infunci + ϵi
Variable OLS 0.05 Quantile 0.25 Quantile 0.50 Quantile 0.75 Quantile 0.95 Quantile
α 1.0822 [0.3469] -2.3170a (-4.2297) -0.8864 (-0.9807) 0.2423 (0.1766) 4.1554a (3.8521) 6.6071a (5.6175)
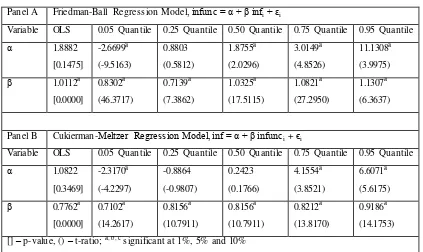
β 0.7762a [0.0000] 0.7102a (14.2617) 0.8156a (10.7911) 0.8156a (10.7911) 0.8212a (13.8170) 0.9186a (14.1753) [] – p-value, () – t-ratio; a, b, c significant at 1%, 5% and 10%
Panel A in Table 2 reports the results of estimating the Friedman-Ball hypothesis. The OLS
regression generates positive and significant coefficient of inflation at the 1% level. The
five-quantile regression (τ = 0.05, 0.25, 0.50, 0.75 and 0.95,) estimates of inflation, conditional on
inflation uncertainty, all prove positive and significant at the 1% level. These results support
the Friedman-Ball hypothesis that inflation creates inflation uncertainty. Moreover, the
quantile regression results illustrate that the marginal effect of inflation on inflation
uncertainty increases as one moves from lower to higher inflation variability quantiles, except
in 0.25 quantile where the marginal effect falls by 14 percent. That is, at higher inflation
uncertainty quantiles, inflation exerts a larger effect on inflation uncertainty such countries as
12
associate with the estimation of the entire conditional distribution of inflation volatility, as
opposed to the conditional mean only.
Panel B of Table 2 reports the results of estimating the Cukierman-Meltzer hypothesis.
All estimates of inflation uncertainty show positive and significant at the 1% level. The
marginal effects of inflation uncertainty on inflation rise significantly across quantiles for
countries such as Sudan, Zambia and Uganda. Therefore, the findings surmise that higher
quantiles in both cases lead to larger marginal effects of inflation (inflation uncertainty) on
inflation uncertainty (inflation). Hence, using Mean and Standard Deviation of the Inflation
rate, both Friedman-Ball hypothesis and Cukierman-Meltzer hypothesis are supported for
[image:13.596.89.512.402.650.2]African countries.
Table 3: Mean and Relative Variation of the Inflation Rate
Panel A Friedman-Ball Regression Model, infunc = α + β infi+ εi
Variable OLS 0.05 Quantile 0.25 Quantile 0.50 Quantile 0.75 Quantile 0.95 Quantile
α 0.7350a [0.0000] 0.2609a (5.8683) 0.4329a (11.6192) 0.5713a (11.3946) 1.0260a (3.7442) 1.7423a (25.7072) β 0.0096 [0.1155] 0.0117a (4.1422) 0.0125a (5.2587) 0.0097a (3.0470) 0.0086 (0.4932) -0.0148a (-3.4296)
Panel B Cukierman-Meltzer Regression Model, inf = α + β infunci + ϵi
Variable OLS 0.05 Quantile 0.25 Quantile 0.50 Quantile 0.75 Quantile 0.95 Quantile
α 6.7511c [0.0624] 1.2472 (1.3300) 2.2054a (2.9398) 2.9961a (3.2444) 8.8537a (4.9610) 30.7976a (3.8898) β 6.0076 [0.1155] 3.2959a (3.3160) 4.0439a (5.0856) 5.0153a (5.1238) 4.0313a (2.1311) 7.1275 (0.8493) [] – p-value, () – t-ratio; a, b, c significant at 1%, 5% and 10%
Table 3 reports the OLS and quantile estimates for the Friedman-Ball and Cukierman-Meltzer
hypotheses, using the mean and the relative measure of variation of the inflation rate. The
[image:13.596.88.512.402.644.2]13
significant. The results of quantile regression reported in Panel A shows that at the 0.05th,
0.25th, and 0.75th quantiles, inflation has positive and significant effect on inflation
uncertainty, although the coefficients is small in magnitude ranging from 0.0097 to 0.0125.
similarly, Panel B shows that Inflation uncertainty positively affects the inflation rate
significantly except at the 0.95th quantile, when the estimated coefficient is insignificant. It
can also be observed that the inflation uncertainty progressively rises across quantiles up to
the 0.5 quantile while the marginal effect falls by 20% in the 0.75 quartile. Thus, using
relative variation as a measure of uncertainty, the study finds support for the Friedman-Ball
and Cukierman-Meltzer hypotheses in the quantile specifications.
However, at the 0.95 quantile in Panel A, there is an evidence of negative association
between inflation and inflation uncertainty as suggested by Pourgerami and Maskus
(1987),that inflation rate gives a lower level of uncertainty using a model in which economic
agents invest more resources in forecasting inflation as inflation rises, subsequently leading to
lower nominal uncertainty. A formal analysis of this effect is presented Ungar and Ziberfarb
[image:14.596.89.508.538.778.2](1993).
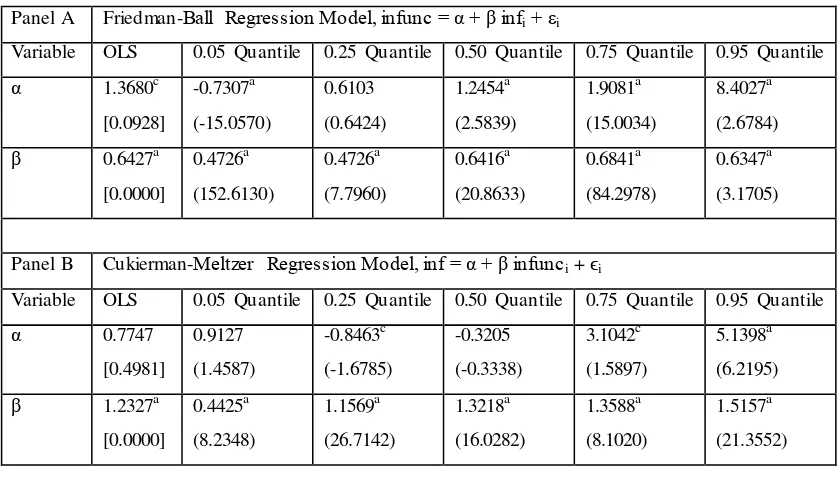
Table 4: Mean and Median Deviation of inflation
Panel A Friedman-Ball Regression Model, infunc = α + β infi+ εi
Variable OLS 0.05 Quantile 0.25 Quantile 0.50 Quantile 0.75 Quantile 0.95 Quantile
α 1.3680c [0.0928] -0.7307a (-15.0570) 0.6103 (0.6424) 1.2454a (2.5839) 1.9081a (15.0034) 8.4027a (2.6784)
β 0.6427a [0.0000] 0.4726a (152.6130) 0.4726a (7.7960) 0.6416a (20.8633) 0.6841a (84.2978) 0.6347a (3.1705)
Panel B Cukierman-Meltzer Regression Model, inf = α + β infunci + ϵi
Variable OLS 0.05 Quantile 0.25 Quantile 0.50 Quantile 0.75 Quantile 0.95 Quantile
α 0.7747 [0.4981] 0.9127 (1.4587) -0.8463c (-1.6785) -0.3205 (-0.3338) 3.1042c (1.5897) 5.1398a (6.2195)
14
[] – p-value, () – t-ratio; a, b, c significant at 1%, 5% and 10%
The OLS regressions results presented in Table 4 find a significant positive
inflation-uncertainty relationship. Table 4 reports the estimates for the Friedman-Ball and
Cukierman-Meltzer hypotheses, using the mean and median deviation of the inflation rate. Inflation rate
significantly and increasingly affects the inflation uncertainty at each of the quantiles except
at 0.95 quantile in Panel A, where the marginal impact of inflation reduces by 7%. Similarly,
inflation uncertainty significantly and increasingly affects inflation rate at each of the
quantiles. Therefore, the use of the mean and the median deviation produces a positive
correlation, supporting the Friedman-Ball and Cukierman-Meltzer hypotheses and confirming
the findings for the mean and standard deviation as well as the mean and the relative
[image:15.596.87.511.447.685.2]variation.
Table 5: Inflation rate and Inflation Uncertainty (Conditional Variance)
Panel A Friedman-Ball Regression Model, infunc = α + β infi+ εi
Variable OLS 0.05 Quantile 0.25 Quantile 0.50 Quantile 0.75 Quantile 0.95 Quantile
α 8.8393a [0.0000] 1.4229a [0.0000] 3.5074a [0.0000] 6.1264a [0.0000] 10.8363a [0.0000] 29.8397a [0.0000]
β 0.5942a [0.0000] 0.1635a [0.0000] 0.2089a [0.0000] 0.3150a [0.0000] 0.4894a [0.0000] 1.0645a [0.0000]
Panel B Cukierman-Meltzer Regression Model, inf = α + β infunci + ϵi
Variable OLS 0.05 Quantile 0.25 Quantile 0.50 Quantile 0.75 Quantile 0.95 Quantile
α 9.1167a [0.0000] -4.1791a [0.0000] 2.3647a [0.0000] 4.6589a [0.0000] 6.3583a [0.0000] 11.1753a [0.0000]
β 0.1730a [0.0000] 0.0106c [0.061] 0.0111c [0.072] 0.2497a [0.0000] 0.7211a [0.0000] 1.7567a [0.0000] [] – p-value, () – t-ratio; a, b, c significant at 1%, 5% and 10%
Unlike estimation results reported in Table 2-4 which was based on average series for both
15
estimates for the Friedman-Ball and Cukierman-Meltzer hypotheses, using 1496 observations
of inflation rates and ARCH generated series for inflation uncertainty for the sample
countries. The OLS regressions results find a significant positive inflation-uncertainty
relationship. Positive correlation was confirmed for both Friedman-Ball and
Cukierman-Meltzer hypotheses.
In Panel A, inflation increasingly affects inflation uncertainty at each of the quantiles
steadily until at 0.95 quantile when the impact becomes more than 200 per cent of what the
impact was at 0.75 quantile. Countries that might have this high positive impact of inflation
rate on uncertainty are Uganda and Sierra Leone. Similarly in Panel B, at quantiles 0.5
through 0.95, the marginal impact of uncertainty on inflation increase successively by more
than 240%. Whereas, the impact of inflation uncertainty on inflation rate is small and
statistically insignificant at 5% level in quantile 0.05 and quantile 0.25, but it is significant at
10% level.
In sum, the finding shows that the effect of inflation on the inflation uncertainty is
stronger for countries in the upper quantiles than for those in the lower quantiles, that is the
inflation uncertainty incurs high costs for countries in the top quantiles. There is a feedback
process between inflation and inflation uncertainty, such that the Friedman‐Ball and
Cukierman‐Meltzer hypotheses hold simultaneously in sample Africa Countries. These
findings is similar to the results reported on nine Africa countries in Hegerty (2012), Sharaf
(2015) on Egypt, Barimah and Amuakwa-Mensah () and Albulescu, Twari, Miller and Gupta
(2015) on U.S. data. Nevertheless,
5. Summary and Concluding Remark
Inflation and its associated uncertainty impose costs on real economic output in every
16
mostly double digit. Hence, there is need for policy makers in African region to understand
the major channels through which inflation affects the real economy so as to reduce the
detrimental economic effects and welfare costs of rise in the inflation rate.
Therefore, the study employed quantile regressions and cross-sectional data from 44
African countries for the period 1986 to 2015 to examine the relationship between the level of
inflation and inflation uncertainty. The main finding of the study is evidence in positive and
significant association between inflation and its uncertainty across quantiles. It also found that
higher inflation brings about more inflation variability, thereby supporting the Friedman-Ball
hypothesis and on the other hand high inflation uncertainty prompts rises in inflation,
supporting the Cukierman-Meltzer hypothesis.
These have important implications for the relationship between inflation and output
given the substantial empirical evidence that higher inflation uncertainty is detrimental to
economic growth as asserted in Sharaf (2015). The study therefore recommend that policy
makers should target low average inflation rates in order to reduce the negative consequences
of inflation uncertainty, which in turn can improve economic performance in Africa.
Reference
Albulescu, C. T., Twari, A. V., Miller, S. M. and Gupta, R. (2015). Time-Frequency
Relationship between Inflation and Inflation Uncertainty for the U.S.: Evidence from
Historical Data. University of Pretoria, Department of Economics Working Paper Series,
WP-91
Ball, L. (1992). Why does high inflation raise inflation uncertainty? Journal of Monetary
Economy, 29(3):371–388.
Bamanga, M. A., Musa, U., Salihu, A., Udoette, U. S.,. Adejo, V. T., Edem, O. N., Bukar, H.
17
Nigeria: A Test of the Friedman’s Hypothesis. CBN Journal of Applied Statistics Vol. 7
No. 1, June
Barimah, A, and Amuakwa-Mensah, F. (n.d.). Does Inflation Uncertainty Decrease with
Inflation? A Garch Model of Inflation and Inflation Uncertainty. Access from
www.wami- imao.org/sites/default/files/journals/v12n2_unit2.pdf
Barro, R. and Gordon, D. (1983). A positive theory of monetary policy in a natural rate
model. Journal of Political Economy, 91(4):589–610.
Bredin, D. and Fountas, S. (2010). US Inflation and inflation uncertainty in a historical
perspective: The impact of recessions. Access from
www.ucd.ie/t4cms/wp%2011-04%20Bredin%20Fountas2.pdf
Chowdhury, A. (2011). Inflation and Inflation-Uncertainty in India: The Policy Implications
of the Relationship. Marquette University, Department of Economics Working Paper ‐
04
Chowdhury, A. (2014). Inflation and inflation-uncertainty in India: The policy implications of
the relationship. J. Econ. Stud., 41, 71–86.
Cukierman, A. and Meltzer, A. (1986). A Theory of Ambiguity, Credibility, and Inflation
under Discretion and Asymmetric Information. Econometrica, 54(5):1099–1128.
Davis, G., and Kanago, B.(1992). Misspecification bias in models of the effect of inflation
uncertainty. Economics Letters 38, 325-329
Dotsey, M.; Ireland, P. (1996). The welfare cost of inflation in general equilibrium. J. Monet.
Econ. 37, 29–47.
Elder, J. (2004). Another perspective on the effects of inflation uncertainty. J. Money Credit
18
Falahi , M. A. and Hajamini , M. (2015). Relationship between Inflation and Inflation
Uncertainty in Iran: An Application of SETAR-GARCH Model. Journal of Money and
Economy, 10(2) Spring
Fang, W.S., Miller, S.M. and C.C. Yeh. (2007). Quantile Inferences for Inflation and Its
Variability: Does a Threshold Inflation Rate Exist? Working paper, 200745
http://digitalcommons.uconn.edu/ econ_wpapers/200745
Fernández-Valdovinos, C. G. and Gerling, K. (2011). Inflation Uncertainty and Relative Price
Variability in WAEMU Countries. IMF Working Paper, WP/11/59.
Ferreira, D. and Palma, A. A. (n.d). Inflation and Inflation Uncertainty in Latin America: A
Time-Varying Stochastic Volatility in Mean Approach. Access from
www.bcu.gub.uy/Comunicaciones/Jornadas%20de%20Economa/C3_Ferreira2016.pd
Fountas, S., Karanasos, M. and Karanassou, M. (2000). A GARCH Model of Inflation and
Inflation Uncertainty with Simultaneous Feedback. Access from
https://papers.ssrn.com/sol3/papers.cfm?abstract_id=235310
Fountas, S.; Karanasos, M.; Kim, J. (2006). Inflation uncertainty, output growth uncertainty
and macroeconomic performance. Oxford Bull. Econ. Stat. 68, 319–343.
Friedman, M. (1977). Nobel lecture: Inflation and unemployment. J. Polit. Econ. 85, 451–
472.
Hachicha, A. and Lean, H. H. (2013).Inflation, Inflation Uncertainty and Output in Tunisia.
Economics Discussion Papers, No 2013-1, Kiel Institute for the World Economy.
http://www.economics-ejournal.org/economics/discussionpapers/2013-1
Hegerty, S. W. (2012). Does High Inflation Lead to Increased Inflation Uncertainty?
Evidence from Nine African Countries. African Economic and Business Review, 10(2)
Holland, S. (1995). Inflation and uncertainty: tests of temporal ordering, Journal of Money,
19
Javed, S. A., Khan, S. A., Haider, A. and Shaheen, F. (2012). Inflation and Inflation
Uncertainty Nexus: Empirical Evidence from Pakistan. International Journal of
Economics and Financial Issues. 2(3), pp.348-356
Koenker, R. (2005). Quantile Regression. Cambridge University Press. Pp116-149
Koenker, R. and Bassett, G. (1978). Quantile regression. Econometrica 46, 33-50.
Kuan, C. M. (2007). An Introduction to Quantile Regression. Access from
avesbiodiv.mncn.csic.es
Lucas Robert, E., Jr. Inflation and welfare. Econometrica 2003, 68, 247–274
Mello, M. and Novo, A. (2002). The New Empirics of Economic Growth: Quantile
Regression Estimation of Growth Equations. University of Illinois at
Urbana-Champaign. www.econ.puc-rio.br
Nasr, A. B., Balcilar$, M., Ajmi, A. N., Aye, G. C., Gupta, R. and Eyden, R. V (2014).
Causality between Inflation and Inflation Uncertainty in South Africa: Evidence from a
Markov-Switching Vector Autoregressive Model. University of Pretoria Working
Paper: 2014-53
Oteng-Abayie, E. F. and Doe, S. K. (2013). Inflation and inflation uncertainty in Ghana. E3
Journal of Business Management and Economics, 4(12). pp. 259-266
Pourgerami, A., and Maskus, K. (1987). The Effects of Inflation on the Predictability of Price
Changes in Latin America: Some Estimates and Policy Implications. World
Development 15, 287-290.
Sharaf, M. F. (2015). Inflation and Inflation Uncertainty Revisited: Evidence from Egypt.
Economies 3, 128-146
Sintim-Aboagye, H. and Byekwaso, S. (2005). Inflation Uncertainty and Inflation:
Implications of Adjustment and Economic Recovery Programs in Sub-Saharan Africa.
20
Tsyplakov A.A. (2010). The Links between Inflation and Inflation Uncertainty at the Longer
Horizon. Kiev: EERC, Working paper No10/09E
Ungar, M. and Zilberfarb, B. Z. (1993). Inflation and its unpredictability- theory and
empirical evidence. Journal of Money, Credit and Banking, 25:709 - 720
Yeh, C. C., Wang, K. M. and Suen, Y. B. (2009). Quantile Analysis the dynamic linkage
between inflation uncertainty and inflation. Problems and Perspectives in Management,
21
Appendix
Country
Average
Annual
Inflation (%)
Standard
Deviation of
Inflation
Relative
Variation of
Inflation
Mean
Deviation of
Inflation
Algeria 12.13 12.22 0.917 8.823
Benin 4.444 6.851 0.566 3.714
Botswana 9.372 5.816 1.374[H] 4.613
Burkina Faso 3.234[L] 4.364[L] 0.602 3.317[L]
Burundi 10.62 9.251 1.036 6.852
Cabo Verde 3.743[L] 11.27 0.304[L] 6.396
Cameroon 4.421 5.124[L] 0.722 3.234[L]
Central African Rep. 4.889 8.306 0.525 5.253
Chad 5.042 11.35 0.407[L] 7.889
Comoros 4.265[L] 4.301[L] 0.804 3.002[L]
Congo Rep. 6.440 16.29 0.372[L] 12.49
Cote d’Ivoire 4.589 8.666 0.474[L] 4.613
Egypt 10.47 6.025 1.490[H] 4.258
Equatorial Guinea 10.62 23.14 0.440[L] 17.62
Ethiopia 8.464 10.61 0.728 8.175
Gabon 5.543 13.20 0.390[L] 9.748
Gambia, The 11.87 23.62 0.482 9.578
Ghana 30.53[H] 22.67 1.289 13.70
Guinea Bissau 29.64[H] 33.95[H] 0.848 26.35[H]
Kenya 10.69 7.799 1.215 4.876
Lesotho 9.194 5.710 1.370[H] 4.342
Liberia 4.342 7.217 0.528 5.104
Madagascar 14.28 9.601 1.347[H] 6.326
Malawi 21.39 16.09 1.251 10.72
Mali 4.746 7.931 0.531 4.834
Mauritania 8.631 8.169 0.941 5.247
Mauritius 6.664 3.054[L] 1.643[H] 2.419[L]
Morocco 3.176[L] 3.200[L] 0.756 2.645[L]
22
Namibia 9.842 5.294 1.563[H] 3.985
Niger 3.701[L] 6.724 0.479 4.119
Nigeria 23.02 27.92[H] 0.795 17.65[H]
Rwanda 8.513 10.35 0.749 6.815
Senegal 3.900[L] 6.390 0.527 3.748
Seychelles 5.749 8.317 0.617 5.373
Sierra Leone 34.42[H] 38.16[H] 0.879 25.00[H]
South Africa 10.40 4.131[L] 2.027[H] 3.472[L]
Sudan 38.01[H] 36.53[H] 1.012 24.01[H]
Swaziland 10.26 8.206 1.114 5.460
Togo 4.721 7.690 0.543 4.774
Tunisia 5.630 3.350[L] 1.294 2.130[L]
Uganda 35.64[H] 51.43[H] 0.679 31.02[H]
Zambia 37.46[H] 40.56[H] 0.901 25.28[H]