Proceedings of the Fourteenth Workshop on Innovative Use of NLP for Building Educational Applications, pages 412–422 412
Measuring text readability with machine comprehension: a pilot study
Marc Benzahra1,2 and Franc¸ois Yvon1
1LIMSI, CNRS, Universit´e Paris-Saclay, F-91405 Orsay, France 2Glose, 53 rue du rocher, F-75008 Paris, France
{marc.benzahra,francois.yvon}@limsi.fr
Abstract
This article studies the relationship between text readability levels and automatic machine understanding systems. Our hypothesis is that the simpler a text is, the better it should be understood by a machine. We thus expect a strong correlation between readability levels on the one hand, and performance of auto-matic reading systems on the other hand. We test this hypothesis with several understanding systems based on language models of varying strengths, measuring this correlation on two corpora of journalistic texts. Our results sug-gest that this correlation is quite small and that existing comprehension systems are far to re-produce the gradual improvement of their per-formance on texts of decreasing complexity.
1 Introduction
The automatic evaluation of the readability of texts is an old subject (see, for example, (DuBay, 2007) for an historical account), which continues to arouse great interest from the Natural Language Processing (NLP) community; a recent analysis of the state-of-the-art is given by Collins-Thompson (2014). Checking that a written document is ex-pressed in a language that is accessible to its tar-get audience is essential in many situations: for instance to ensure that the information conveyed by the text is properly understood or to allow suf-ficient engagement of the reader in the reading ac-tivity (Dietrich, 2004). These issues are relevant both for the dissemination of general purpose in-formation (e.g. news articles) and more targeted information such as drug leaflets, administrative texts or legal documents. They apply to various readerships: children in first or second language learning situations, adults with varying levels of education or with disabilities, etc.
The classical measures of readability are based on crude approximations of the syntactic
complex-ity (using the average sentence length as a proxy) and lexical complexity (average length in charac-ters or syllables of words in a sentence). One of the most well-known measure along these lines is the Flesch-Kincaid readability index (Kincaid et al., 1975), which combines these two measures into a global score. This approach has recently been renewed by the use of supervised statistical learning methods capable of integrating into the prediction of readability a very large number of linguistic characteristics (Schwarm and Ostendorf, 2005; Petersen and Ostendorf, 2009; Vajjala and Meurers, 2012; Franc¸ois and Fairon, 2012; Vajjala and Meurers, 2014; Brunato et al., 2018) aimed at capturing readability indices at the lexical, syntac-tic, semantic and even discursive levels. It can be argued that these enhanced feature sets are able to take into account so-calledcognitivefactors (Feng et al., 2009).
However, these approaches depend on the avail-ability of texts annotated with their difficulty lev-els, which are often defined in relation to a partic-ular task or readership. The elicitation of these an-notations is a complex operation, which requires either the implementation of understanding mea-surement protocols on controlled populations, us-ing for example cloze tests to evaluate understand-ing (Taylor, 1953; Oller Jr., 1973); or the work of highly qualified experts, at the risk of observing disagreements between annotators (Petersen and Ostendorf, 2009). They also require automatically extracting linguistic features from texts, which ex-isting NLP tools only partially achieve, for a lim-ited number of languages.
Dhin-gra et al., 2017; Yu et al., 2018),1it might become possible to use them to assess the readability of texts. The preliminary question of interest here is therefore whetherthe ability of automatic compre-hension systems to respond to gap-filling questions correlates with the difficulty of the text, and can be help to measure readability. To answer this ques-tion, we study several simplistic machine under-standing systems, described in § 2.4 and empir-ically examine the correlation between their per-formance and the actual complexity of texts, mea-sured by humans (see§3). Our main findings are that when comprehension is evaluated using cloze tests, all the systems make very little difference, if any, between texts of varying complexities, sug-gesting that we should reconsider our evaluation scheme, or our set of comprehension systems, or both, to achieve a behavior that would be more similar to human’s performance.
2 Simulating human comprehension
2.1 The design of readability scores
From a bird’s eye view, the construction of measures of text readability involves two steps: (a) having human subjects perform controlled comprehension tests on texts of interest, which determine the empirical readability of the texts for the concerned population of readers (typically characterized by a level of education, or a level of language proficiency for second language learn-ers); (b) measuring a set of indices in texts that effectively predict empirical readability values and learning the parameters of a function relating these surface cues with difficulty.
The approach we explore relies on the assump-tion that automatic comprehension systems having greatly improved, it should become possible to use them to simulate step (a) above, and thus to use the results of machine comprehension tests on a given text to directly evaluate its empirical readability, dispensing with the need to perform step (b).
As a first step in this direction, we need to check whether that performance of machine comprehen-sion systems should exhibit a form of dependency to the actual readability of the text: the simpler the text, the better they should be understood by a
1
See however the work of Jia and Liang (2017) or Kaushik and Lipton (2018), who claim that quantitative pro-gresses, measured on standard question answering tasks, mainly reflect an improvement in the ability of these systems to perform surface matches between questions and answers.
machine. This is the main question that we em-pirically address below, using an automatic un-derstanding architecture based on statistical Lan-guage Models (LMs), and evaluating the task of automatic comprehension using cloze tests.
A second important question will concern our ability to build comprehension systems that accu-rately simulate the understanding ability of a tar-get population (of children, of language learners, of people with disabilities, etc). We delay the sys-tematic study of this question for further work, but contend that our methodology is compatible with this objective, as it can handle, as will be seen, the design of comprehension systems of varying strengths.
To reiterate, our objective is to study the per-formance of comprehension systems as a possible measure of text readability: our final goal is not so much to improve comprehension systems but to see how they could be used as proxies of human comprehension.
2.2 Testing machine comprehension
The measurement of automatic comprehension of texts is an old and difficult issue. By anal-ogy with measures of human understanding, two main methods are commonly used: comprehen-sion questions (Richardson et al., 2013; Rajpurkar et al., 2016) and cloze tests.
The use of cloze tests to assess the performance of comprehension systems has for instance been proposed by Hill et al. (2016), which studies the ability of various neural models to fill in blanks in sentences from children’s stories, introducing the CBT (Children Book Tests) corpus.
This technique has also been used in several previous studies (Bimbot et al., 2001; Zweig and Burges, 2012) to evaluate language models: the former reference establishes a direct link between perplexity and filling-the-gap tests; the latter in-troduces the Sentence Completion Challenge in which gaps and distractors are carefully selected.
Cloze test Prediction Ground truth Herring is a type of fish it swims closer to San Francisco
than before. Herring is a favorite food of sea , so they might have followed those fish to . Sea lions might also like the pier because ...
, ,
otters lions
San shore
They have twin daughters named Barbara and Jenna The family has a dog Barney and a named India.
. .
named named
cat cat
Neil Armstrong was the first man to step onto the moon . put an American flag up on the moon . brought moon rocks back to .
. He
He He
[image:3.595.84.514.62.216.2]Earth Earth
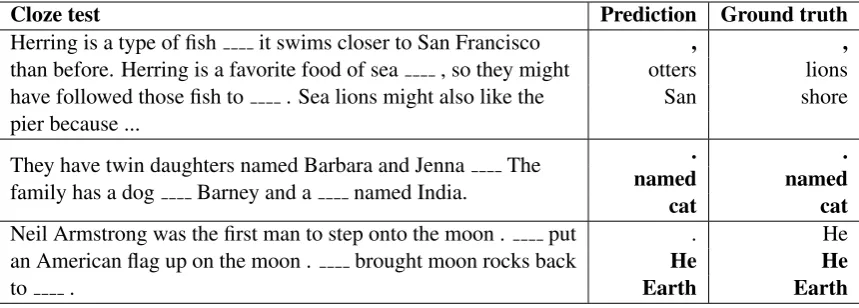
Table 1: Cloze test examples filled with a GPT-2 language model.
2.3 Cloze test generation, completion and evaluation
We stick here to a much simpler form of cloze test-ing, based on a uniform random strategy to select the deleted words. We leave for future work the use of more sophisticated methods specifically de-signed to generate difficult tests.
In practice, each test document is automatically divided intoN passages of the same size; in each passage, M positions are randomly selected uni-formly and correspond to the words that will be blanked out. These words will have to be recov-ered by the comprehension system, which has ac-cess to the complete left context of the gap since the beginning of the passage. In our experiments, we useN = 5andM = 3.
One interesting property of cloze tests is that they provide ways to analyze the complexity of gap fillings with respect to arbitrary linguistic lexi-cal descriptors; they also provide ways to compute difficulty levels separately for each sentence and check for instance its dependency with respect to the length of the context. Table 1 shows examples of Cloze tests given to our language models.
Gap filling performance is measured as the av-erage number of words that are correctly predicted in a text (noted p@1) in the tables below. This metric being very strict, we also report the num-ber of times the correct word appears in the first 5, 25, and 50 candidates. Many other techniques could be entertained to weaken the p@1 metric, for example by considering the similarity (formal or distributional) between the predicted word and the reference. Again, we leave the study of these alternative metrics to future work.
2.4 A comprehension architecture based on language models
Our comprehension systems are neural language models based on recurrent structures (RNN) (El-man, 1990; Mikolov et al., 2010) with LSTM cells (Hochreiter and Schmidhuber, 1997), which con-tinue to deliver (near) state-of-the-art results for statistical language modelling (Melis et al., 2018). Once trained, the prediction of a missing word is performed by only looking at its left context, or-dering the candidate wordswat positiont accord-ing toP(wt=w|w<t).2
Among all the degrees of freedom of the method, we simply varied (a) the quality of mod-els using the same architecture, and (b) the training data. We acknowledge that it would also be possi-ble to use other architectures for language mod-els (e.g. n-grams modmod-els (Chen and Goodman, 1999)); to use character-based models (Sutskever et al., 2011; Kim et al., 2016) or subword-based models that could accommodate open vocabular-ies; or to train more sophisticated RNN models (Yang et al., 2018).
It would likewise be possible to use more com-plex algorithms to predict missing words (e.g. by using left and right contexts), or even by testing text understanding systems that are more represen-tative to the current state of-the-art (Dhingra et al., 2017; Yu et al., 2018).
As a first step in this direction, we also exper-iment with a self-attentional language-model (Al-Rfou et al., 2018; Liu et al., 2018) using the Trans-former architecture (Vaswani et al., 2017), from
2In this respect, our use of LMs for readability continues
WikiText-2 WikiText-103 Wiki-Simple
#params #epochs ppl #params #epochs ppl #params #epochs ppl
RNN 19M 100 90 113M 3 87 44M 50 51
[image:4.595.96.504.62.120.2]AWD 19M 100 78 113M 3 137 44M 50 65
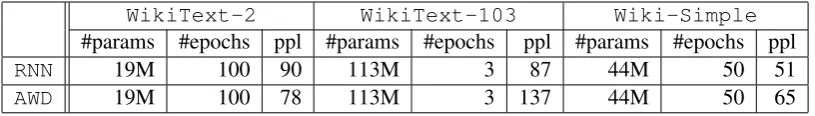
Table 2: Basic statistics regarding language models
the implementation of Radford et al. (2019). Such models are capable to effectively handle very long range dependencies and have been able to achieve good performance on some recent machine com-prehension benchmarks.
3 Experiments
In this section, we compare the automatic compre-hension measures produced by our language mod-els with readability scores produced by humans, as well as with other automatic standard indices of readability. We start with details regarding the implementation of our language models.
3.1 Language Model Training
3.1.1 Corpora
To train our language models, we use two standard corpora of articles from the English Wikipedia:3
WikiText-2 and WikiText-103, that have
already been used as benchmarks in language modeling tasks (Merity et al., 2017). As can be seen from the statistics in Table 3, these corpora mostly differ in their size and vocabulary.
We also use an additional set of articles from the English version of the simplified Wikipedia:4
Wiki-Simple.5 Following Merity et al. (2017),
this ”simple” dataset is pre-processed as follow: tokens with less than 3 occurrences are replaced by the ”<unk>” token as in WikiText-2 and
WikiText-103.
Source Docs Tokens Types
Wiki-2 720 2.5M 33K
Wiki-103 28 591 103M 260K
Wiki-Simple 60K 7.9M 96K
Table 3: Language model training corpora
All language modelling corpora in Table 3 are tokenized by splitting text for each space separator
3https://en.wikipedia.org 4
https://simple.wikipedia.org/
5Version 2.0 http://www.cs.pomona.edu/
˜dkauchak/simplification/
(” ”) encountered. It is expected that training mod-els on the Wiki-Simple corpora should yield poorer gap-filling systems than the other two cor-pora, as these systems will be exposed to simpler sentence structures and a more basic vocabulary.
3.1.2 LM Implementation issues
Our own RNN language models use the follow-ing architecture: 3 hidden layers, each contain-ing 512 recurrent cells. Traincontain-ing starts with ran-domly initialized embeddings, and is performed using SGD (Robbins and Monro, 1951), dividing by 4 the learning rate (initialized to 30) every 5 epochs if the loss does not decrease. We use a drop-out of 0.1 for the embedding layer, 0.3 for the LSTM layers and 0.4 for the output layer ; the batch size is 64, and backpropagation context is 64. We borrow two additional techniques from Merity et al. (2018): the use of variable-length backpropagation sequences and the use of two reg-ularization terms penalizing the parameters of the output layers: activation regularization and tempo-ral activation regularization (see reference for de-tails). The weight matrices at the output of LSTM after the linear projection and the word embedding are shared to avoid overfitting (Inan et al., 2017; Press and Wolf, 2017) and to reduce the number of parameters. This implementation is referred to as RNN below.
We contrast our implementation with that of Merity et al. (2018)6 trained with the same pa-rameter values as our RNN implementation, ran-dom seed value is 1882. This implementation is referred to as AWD below. Basic statistics regard-ing these models (size, test set perplexity) are in Table 2, suggesting that we were able to have a diverse set of models of varying strengths7.
Last, we also report results obtained with a self-attentional architecture, directly using the smaller version (context size is768and number of
param-6https://github.com/salesforce/
awd-lstm-lm
7Note that the perplexity score do not directly
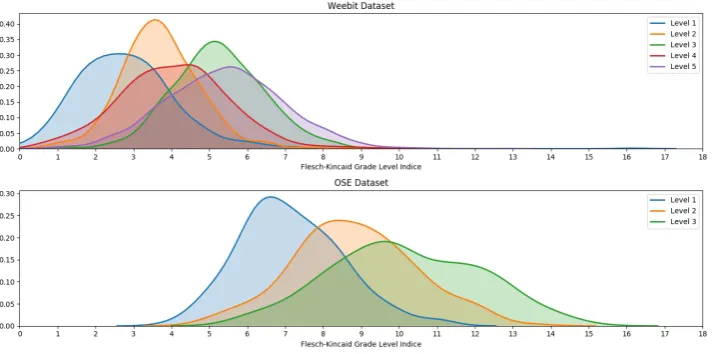
Figure 1: Distribution of the Flesch-Kincaid index by complexity level
eters 117M against a context size of 1600 units and 1.5B parameters for the largest and closed source version) of the trained models of Radford et al. (2019)8, referred to as GPT-2 in the Tables below. This model uses a vocabulary of 50K vari-able length subword units (Sennrich et al., 2016) and is trained on a corpus of 8M documents; ac-cording to its authors, it achieves a perplexity of respectively 29 and 37 on WikiText-2 and
WikiText-103. As this model is based on
sub-word units, it can not directly be used to fill gaps. Our greedy heuristic gap-filling procedure is the following: (a) first generate a list ofK most likely subword units; (b) greedily expend right-wards theseK hypotheses until one word is gen-erated for at mostttime steps. We uset = 10in our experiments.
3.2 Test data and evaluation
The reference annotations used to validate our method mostly come from two sources:
Weebit (Vajjala and Meurers, 2012) and
OneStopEnglish(OSE for short) (Vajjala and
Lucic, 2018). The first identifies 5 levels of com-plexity in educational news articles published on-line (on the WeeklyReader and BBC-Bitesize Web sites), covering learners aged from 7 to 16. As a merger of two sources, the distribution of cate-gories is quite unbalanced, with more texts for the fifth level than for all the other categories taken together.
8Taken with their associated API from
https://github.com/huggingface/ pytorch-pretrained-BERT
The second test set9 also contains extracts of journalistic texts originally from the newspaper The Guardian. Each document has been rewrit-ten twice by experts to correspond to two less ad-vanced reading levels, and thus distinguishes three levels of readability. Statistics on these test cor-pora are in Table 4.
Source Docs Tokens Gaps Levels
Weebit 10 486 3.9M 157K 5
OSE 567 450K 8.5K 3
Table 4: Basic statistics of test corpora
Figure 1 displays the distribution of the Flesch-Kincaid Grade Level (FKGL) for these two cor-pora. Complexity levels are distributed nearly as expected for the Weebit corpus apart from lev-els 3 and 4 where the latter seems simpler than foreseen, with large overlapping spans. It was al-ready noted by (Vajjala and Meurers, 2012) that the actual readability level of each test was diffi-cult to predict accurately based on the sole FKGL. OSE complexity levels are also in agreement with the Flesch-Kincaid index, and in agreement with the numbers reported in (Vajjala and Lucic, 2018); again we see a large overlap between levels for this index. Overall, OSE texts are somewhat more complex than Weebit’s, with OSE level 1 compa-rable in difficulty to Weebit level 4.
Both sources were pre-processed with regular expressions to discard bits of text that were recur-rent such as advertisement footers for companies (BBC, WeeklyReader, MetaMetrics) and material
WikiText-2 WikiText-103 Wiki-Simple
p@... 1 5 25 50 1 5 25 50 1 5 25 50
RNN(1) 0.10 0.21 0.33 0.39 0.12 0.24 0.37 0.44 0.12 0.27 0.40 0.47
RNN(2) 0.09 0.20 0.29 0.35 0.11 0.23 0.34 0.41 0.11 0.23 0.36 0.43
RNN(3) 0.08 0.19 0.28 0.34 0.10 0.22 0.33 0.39 0.10 0.22 0.33 0.39
RNN(τ) 0.05 0.06 0.11 0.12 0.06 0.06 0.09 0.10 0.11 0.13 0.17 0.19
AWD(1) 0.11 0.22 0.34 0.40 0.12 0.23 0.35 0.42 0.12 0.25 0.36 0.43
AWD(2) 0.10 0.20 0.31 0.37 0.11 0.21 0.32 0.37 0.11 0.22 0.32 0.38
AWD(3) 0.09 0.19 0.30 0.35 0.10 0.21 0.31 0.37 0.10 0.21 0.30 0.36
AWD(τ) 0.05 0.08 0.09 0.11 0.06 0.07 0.09 0.11 0.11 0.11 0.15 0.17
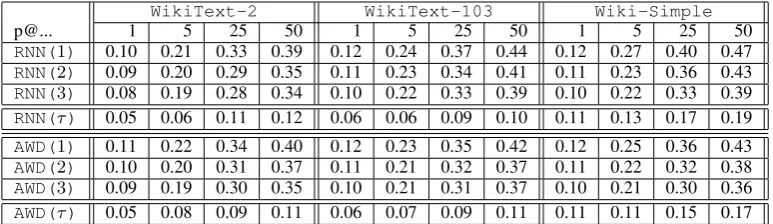
Table 5: Completion rates broken down per readability level for gap filling systems of variable strength tested on the OSE dataset. Kendall tau-b correlation is reported asτ.
WikiText-2 WikiText-103 Wiki-Simple
p@... 1 5 25 50 1 5 25 50 1 5 25 50
RNN(1) 0.07 0.18 0.28 0.34 0.10 0.23 0.34 0.40 0.15 0.28 0.40 0.46
RNN(2) 0.08 0.21 0.33 0.39 0.11 0.24 0.36 0.43 0.13 0.27 0.38 0.46
RNN(3) 0.09 0.21 0.33 0.39 0.12 0.25 0.36 0.43 0.13 0.26 0.39 0.45
RNN(4) 0.05 0.15 0.26 0.31 0.08 0.18 0.28 0.35 0.09 0.20 0.32 0.40
RNN(5) 0.06 0.15 0.24 0.29 0.09 0.19 0.28 0.33 0.10 0.20 0.31 0.37
RNN(τ) 0.07 0.11 0.11 0.12 0.07 0.12 0.15 0.14 0.15 0.19 0.16 0.16
AWD(1) 0.09 0.21 0.30 0.35 0.11 0.22 0.32 0.38 0.15 0.27 0.37 0.43
AWD(2) 0.09 0.22 0.33 0.40 0.12 0.23 0.35 0.41 0.13 0.25 0.36 0.42
AWD(3) 0.10 0.22 0.34 0.40 0.12 0.24 0.35 0.41 0.13 0.24 0.35 0.41
AWD(4) 0.06 0.17 0.27 0.33 0.08 0.18 0.26 0.31 0.09 0.19 0.27 0.34
AWD(5) 0.08 0.17 0.26 0.31 0.09 0.18 0.27 0.31 0.10 0.19 0.28 0.34
[image:6.595.106.493.62.174.2]AWD(τ) 0.06 0.12 0.10 0.11 0.10 0.12 0.14 0.16 0.15 0.17 0.19 0.18
Table 6: Completion rates broken down per readability level for gap filling systems of variable strength tested on the Weebit dataset. Kendall tau-b correlation is reported asτ.
from automatic scraping (e.g. ”Your web browser does not have JavaScript switched on at the mo-ment.”). Empty and duplicate documents were removed (around 400 texts), moreover, we used
spacy-cld10 (which uses CLD2 from Google)
to detect the main language of a document and get rid of documents that were not written in English (around 60 texts in French, German, Spanish and Gaelic). In all our test and evaluation datasets, word tokenization and POS tags inference are per-formed with SpaCy.11 Following this processing and as described in Section 2.3, passages and cloze positions are selected and fixed for all experiments to have a deterministic experimental setup. All the results presented below are computed using 500 randomly chosen texts for each readability level.
Since our objective is to study the correlation between gap filling performance and readability level, we compute two main metrics for each of the experimental conditions below: (a) the preci-sion of comprehenpreci-sion systems broken down by
10
https://github.com/nickdavidhaynes/ spacy-cld
11http://spacy.io
complexity group; (b) the correlation (Kendall’s Tau) between complexity classes and completion rates.12
3.3 Results
Our main results are presented in Table 5, 6 and 7 where we report the completion rates and correla-tions for all the systems compared in our experi-ments.
A first observation is that completion rates (especially p@1) are overall distributed as ex-pected across models/training corpora. Training
on WikiText-2 yields results that are
consis-tently worse than for the other two corpora; for both RNN implementations, the average success rate forWikiText-2andWikiText-103are very comparable. Interestingly, results for the eas-iest readability levels (Weebit 1 and 2) are higher for models trained on Wiki-Simple than on
WikiText-103andWikiText-2. Regarding
models, forWikiText-2andWikiText-103
the RNN implementation of (Merity et al., 2018)
12We use the Tau-b statistic which makes adjustments for
is slightly better than ours, while our model per-formance is better forWiki-Simple, which is consistent with the perplexity scores in Table 2
WebText
p@... 1 5
OSE(1) 0.22 0.42
OSE(2) 0.21 0.42
OSE(3) 0.20 0.40
OSE(τ) 0.05 0.04
Weebit(1) 0.18 0.35
Weebit(2) 0.18 0.37
Weebit(3) 0.21 0.39
Weebit(4) 0.13 0.27
Weebit(5) 0.13 0.29
Weebit(τ) 0.13 0.14
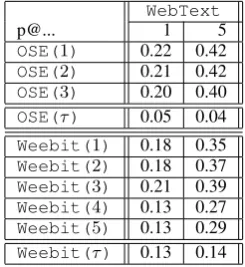
Table 7: Completion rates broken down per readability level for the GPT-2 gap filling system pre-trained on WebText and tested on the Weebit and OSE datasets. Kendall tau-b correlation is reported asτ.
As expected, GPT-2 scores in Table 7 vastly outperform all RNN-based approaches, with com-pletion rates (p@1 / p@5) that approximately dou-ble the completion rates of the other systems.
We can conclude that our set of models is quite diverse, even though we would have expected to get more diversity across training corpora from our RNNs, suggesting that we may have to move away from the Wikipedia domain in future experiments. If we now look at the variance of completion rates across difficulty levels, the overall picture is less clear. Overall, the most consistent results are obtained with OSE than with Weebit: for the for-mer we almost always see better completion rates for simpler texts, across systems, training corpus and metrics, even though the differences are often small. Results for Weebit are more difficult to an-alyze: all RNN models seem to achieve their best completion rates for Weebit level 3, which is con-sistently higher than levels 4 and 5 (which is fine), but also higher than for level 1 and 2 (which is contradictory to our expectations). In fact, these easiest texts seem difficult to predict for all mod-els; as mentioned above, for RNNs, training on the simplerWiki-Simplegives a slight hedge over the other language models, which we also see as a positive sign. Overall however, the observed cor-relation scores remain small and insignificant, for all systems and metrics. Our best results are in the region[0.1,0.2]for OSE and Weebit. In compar-ison, the correlation for Flesh-Kincaid grade level score is 0.48 for OSE and 0.61 for Weebit.
A first conclusion is that with current machine
comprehension systems, as implemented in this study, we show gap filling performances that are not significantly impacted by the actual readabil-ity level of texts. Therefore, their performance in cloze tests can not reliably be used to infer the dif-ficulty of a text.
4 Discussion
4.1 Cloze tests and morphological tags
The results in Section 3 were obtained with a naive cloze test generation strategy, where deleted to-kens are selected uniformly at random. There are several ways in which this approach can be prob-lematic. Indeed, it is already a well documented fact that RNNs are far better at correctly predict-ing determiners, prepositions, or even verbs, than at predicting nouns (common or proper) that often require a much larger textual context (Hill et al., 2016).
This is also what we observe in Table 8 where we give the completion rate averaged over all texts in OSE corpora, broken down by part-of-speech (POS),13for all our models.
verb noun punct det
RNN-WT2(λ) 0.03 0.08 0.76 0.61
RNN-WTSIMPLE(λ) 0.05 0.14 0.81 0.66
RNN-WT103(λ) 0.04 0.11 0.82 0.59
RNN-WT2(τ) 0.02 0.06 0 0
RNN-WTSIMPLE(τ) 0.03 0.08 0.04 0.05
RNN-WT103(τ) 0.01 0.03 0.01 0
AWD-WT2(λ) 0.02 0.08 0.81 0.61
AWD-WTSIMPLE(λ) 0.05 0.1 0.81 0.66
AWD-WT103(λ) 0.05 0.09 0.81 0.6
AWD-WT2(τ) -0.01 0.06 0.02 0.01
AWD-WTSIMPLE(τ) 0.03 0.07 0.03 0.01
AWD-WT103(τ) -0.03 0.06 0.02 -0.03
GPT2(λ) 0.24 0.39 0.87 0.64
[image:7.595.119.242.115.249.2]GPT2(τ) 0.04 0 0.01 -0.02
Table 8: Completion rates (λwith p@5) broken down per model and POS tag and Kendall-Tau (τ) correlation between completion rates and their respective level on the OSE dataset.
A first consequence is that easy-predict to-kens, such as punctuations or determiners, will artificially increase the completion rate, even for texts that should be difficult to complete.
This would not be so much of a problem if the distribution of POS was constant across readabil-ity levels, an assumption that is also well known to be unrealistic - in fact, POS ratios have repeatedly
Level Title CR K0 Goldlilocks and the Three Bears 0 K1 The Courage of Sarah Noble 0
K1 Flat Stanley 0
K2 The Velveteen Rabbit 0.07
K2 Ribsy 0.07
K3 Stuart Little 0.20
K3 Peter Pan 0.33
K4 Prince Caspian 0.07
K4 Alice’s Adventures in Wonderland 0.07
K5 Robinson Crusoe 0.13
K5 The Voyage of the Dawn Treader 0.07 K6 The Red Badge of Courage 0.13
K6 The Last Battle 0.07
K7 The Count of Monte Cristo 0.07
K7 The Black Arrow 0.27
K8 Hamlet 0
K8 The Sword in the Stone 0.07
[image:8.595.80.283.58.254.2]K+ The Art of War 0.07
Table 9: A literary test set with completion rates from our RNN implementation trained on WikiText-2 using p@1 and 5 chunks of text per document.
been found to yield useful features when predict-ing readability (e.g. Franc¸ois and Fairon (2012)). The main consequence for our argument is that randomly selecting gaps will yield uneven POS distribution across readability levels, therefore bi-aising the overall result.
As suggested by the variance of the results in Table 8, this confounding factor cannot be ig-nored. Part-of-speech tags with the best rank cor-relation between their completion rate and their text’s level are nouns and verbs; their occurrences are however lesser than punctuations and deter-miners, which means that an uniformly random gap selection strategy is biased by morphological tags that are worse predictors of text readability for our models.
4.2 Experiment with literary texts
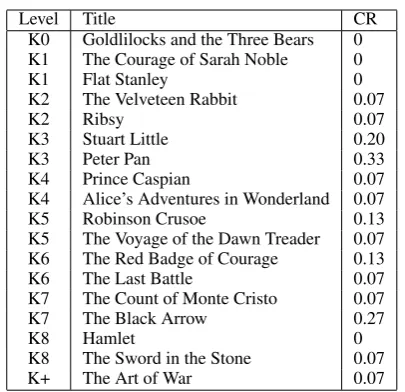
The test datasets used in this study are quite simi-lar in content, and all correspond to news articles intended for readers with variable levels of pro-ficiency. In this subsection, we run a small con-firmation study with an alternative test set based on literary texts. We use extracts from classical fictional books (see list in Table 9 where we also report the associated readability level and comple-tion rate).
Kendall rank coefficient between these rates and their respective levels is equal to−0.28.
Here again, levels are not distinguishable based on the observed completion rates. However, as seen above in section § 3.3 our systems perform better when we release the exact match constraint
for the precision@N metrics. We expect to in-crease the Kendall rank metric on larger experi-ments with this dataset in our future work.
5 Conclusion and outlook
In this paper, we have ran a preliminary study re-garding the ability of basic reading comprehen-sion systems, here implemented as mere neural language models, to recognize variance in the dif-ficulty of their input texts. Using randomly uni-formly generated cloze tests to measure compre-hension, we found that completion rates seem to deliver a small, yet insufficient, signal regard-ing the readability level of a text. Our strongest comprehension system, based on the recent GPT-2 model, is the worst of all, and does not help to distinguish between simple and more complex texts. Complementary experiments show that bet-ter controlling for POS distribution across corpora is likely to improve, albeit by a small margin our results: and that testing with other genre of texts might yield similar conclusions.
This pilot study only scratches at the surface of the problem, and we intend to continue this research in several directions. First, we need to continue the exploration of comprehension sys-tems of controllable strength, using either more sophisticated language modelling architectures, or even considering full-fledge machine comprehen-sion systems. A second line of study will con-sider alternative procedures for generating and fill-ing cloze tests: generation could for instance re-strict to specific gap types, based on their morpho-syntactic properties or blank word parts instead of complete words; filling could for instance increase the context rightwards. Finally, we feel that it will also be crucial to make more direct experiments of the ability of automatic system to consistently reproduce the performance of human subjects, no-tably in the context of the evaluation of educa-tional material, and we aim to develop experimen-tal protocols involving controlled populations of language learners.
References
Rami Al-Rfou, Dokook Choe, Noah Constant, Mandy Guo, and Llion Jones. 2018. Character-level lan-guage modeling with deeper self-attention. In Pro-ceedings of the Thirty-Third AAAI Conference on Artificial Intelligence, AAAI, Honolulu, Hawa¨ı.
Mich`ele Jardino, Kamel Smaili, and Imed Zitouni. 2001. An alternative scheme for perplexity es-timation and its assessment for the evaluation of language models. Computer Speech & Language, 15(1):1–13.
Dominique Brunato, Lorenzo De Mattei, Felice Dell’Orletta, Benedetta Iavarone, and Giulia Ven-turi. 2018. Is this sentence difficult? do you agree? In Proceedings of the 2018 Conference on Empiri-cal Methods in Natural Language Processing, pages 2690–2699, Brussels, Belgium.
Stanley F Chen and Joshua Goodman. 1999. An empirical study of smoothing techniques for lan-guage modeling. Computer Speech & Language, 13(4):359–394.
Kevyn Collins-Thompson. 2014. Computational as-sessment of text readability: A survey of current and future research. ITL-International Journal of Ap-plied Linguistics, 165(2):97–135.
Kevyn Collins-Thompson and James P. Callan. 2004. A language modeling approach to predicting reading difficulty. InHLT-NAACL 2004: Main Proceedings, pages 193–200, Boston, Massachusetts, USA.
Bhuwan Dhingra, Hanxiao Liu, Zhilin Yang, William Cohen, and Ruslan Salakhutdinov. 2017. Gated-attention readers for text comprehension. In Pro-ceedings of the 55th Annual Meeting of the Associa-tion for ComputaAssocia-tional Linguistics (Volume 1: Long Papers), pages 1832–1846, Vancouver, Canada.
Arne Dietrich. 2004. Neurocognitive mechanisms un-derlying the experience of flow. Consciousness and Cognition, 13(4):746 – 761.
William H DuBay. 2007. Smart language. Readers, Readability, and the Grading of Text. Costa Mesa: Impact Information.
Jeffrey L. Elman. 1990. Finding structure in time. Cognitive Science, 14(2):179–211.
Lijun Feng, No´emie Elhadad, and Matt Huenerfauth. 2009. Cognitively motivated features for readability assessment. InProceedings of the 12th Conference of the European Chapter of the ACL, EACL 2009, pages 229–237, Athens, Greece.
Thomas Franc¸ois and C´edrick Fairon. 2012. An AI readability formula for French as a foreign language. In Proceedings of the 2012 Joint Conference on Empirical Methods in Natural Language Process-ing and Computational Natural Language LearnProcess-ing, pages 466–477.
Karl Moritz Hermann, Tomas Kocisky, Edward Grefenstette, Lasse Espeholt, Will Kay, Mustafa Su-leyman, and Phil Blunsom. 2015. Teaching ma-chines to read and comprehend. InAdvances in Neu-ral Information Processing Systems 28, pages 1693– 1701. Curran Associates, Inc.
Felix Hill, Antoine Bordes, Sumit Chopra, and Jason Weston. 2016. The Goldilocks principle: reading children’s books with explicit memory representa-tions. InProceedings of the International Confer-ence on Learning Representations, ICLR, San Juan, Puerto Rico.
Sepp Hochreiter and J¨urgen Schmidhuber. 1997. Long short-term memory. Neural computation, 9(8):1735–1780.
Hakan Inan, Khashayar Khosravi, and Richard Socher. 2017. Tying word vectors and word classifiers: A loss framework for language modeling. In Proceed-ings of the International Conference on Representa-tion Learning, ICLR, Toulon, France.
Robin Jia and Percy Liang. 2017. Adversarial exam-ples for evaluating reading comprehension systems. In Proceedings of the 2017 Conference on Empiri-cal Methods in Natural Language Processing, pages 2021–2031.
Divyansh Kaushik and Zachary C. Lipton. 2018. How much reading does reading comprehension require? a critical investigation of popular benchmarks. In Proceedings of the 2018 Conference on Empirical Methods in Natural Language Processing, pages 5010–5015, Brussels, Belgium.
Yoon Kim, Yacine Jernite, David A Sontag, and Alexander M. Rush. 2016. Character-aware neu-ral language models. InProceedings of the Annual Meeting of the American Association for Artificial Intelligence, AAAI 16.
J Peter Kincaid, Robert P Fishburne Jr, Richard L Rogers, and Brad S Chissom. 1975. Derivation of new readability formulas (automated readability in-dex, fog count and Flesch reading ease formula) for navy enlisted personnel. Technical report, Institute for Simulation and Training, University of Central Florida.
Peter J. Liu, Mohammad Saleh, Etienne Pot, Ben Goodrich, Ryan Sepassi, Lukasz Kaiser, and Noam Shazeer. 2018. Generating wikipedia by summariz-ing long sequences. In Proceedings of the Inter-national Conference on Learning Representations, ICLR, Vancouver, BC, Canada.
G´abor Melis, Chris Dyer, and Phil Blunsom. 2018. On the state of the art of evaluation in neural language models. InProceedings of the International Confer-ence on Learning Representations, ICLR, Vancou-ver, BC, Canada.
Stephen Merity, Nitish Shirish Keskar, and Richard Socher. 2018. Regularizing and optimizing LSTM language models. In Proceedings of the Inter-national Conference on Learning Representations, ICLR.
models. InProceedings of the International Con-ference on Learning Representations, ICLR, Toulon, France.
Tom´aˇs Mikolov, Martin Karafi´at, Luk´aˇs Burget, Jan ˇ
Cernock`y, and Sanjeev Khudanpur. 2010. Recur-rent neural network based language model. In Eleventh Annual Conference of the International Speech Communication Association (InterSpeech), pages 1045–1048, Makuhari, Chiba, Japan.
John W. Oller Jr. 1973. Cloze tests of second lan-guage proficiency and what they measure. Lan-guage Learning, 23(1):105–118.
Denis Paperno, Germ´an Kruszewski, Angeliki Lazari-dou, Ngoc Quan Pham, Raffaella Bernardi, San-dro Pezzelle, Marco Baroni, Gemma Boleda, and Raquel Fernandez. 2016. The LAMBADA dataset: Word prediction requiring a broad discourse context. InProceedings of the 54th Annual Meeting of the As-sociation for Computational Linguistics (Volume 1: Long Papers), pages 1525–1534, Berlin, Germany.
Sarah E. Petersen and Mari Ostendorf. 2009. A ma-chine learning approach to reading level assessment. Computer Speech & Language, 23(1):89 – 106.
Ofir Press and Lior Wolf. 2017. Using the output em-bedding to improve language models. In Proceed-ings of the 15th Conference of the European Chap-ter of the Association for Computational Linguistics: Volume 2, Short Papers, pages 157–163, Valencia, Spain.
Alec Radford, Jeffrey Wu, Rewon Child, David Luan, Dario Amodei, and Ilya Sutskever. 2019. Language models are unsupervised multitask learners. Techni-cal report, OpenAI.
Pranav Rajpurkar, Jian Zhang, Konstantin Lopyrev, and Percy Liang. 2016. Squad: 100,000+ questions for machine comprehension of text. InProceedings of the 2016 Conference on Empirical Methods in Natu-ral Language Processing, pages 2383–2392, Austin, Texas.
Matthew Richardson, Christopher J.C. Burges, and Erin Renshaw. 2013. MCTest: A challenge dataset for the open-domain machine comprehension of text. InProceedings of the 2013 Conference on Em-pirical Methods in Natural Language Processing, pages 193–203, Seattle, Washington, USA.
Herbert Robbins and Sutton Monro. 1951. A stochastic approximation method. The Annals of Mathemati-cal Statistics, 22(3):400–407.
Sarah Schwarm and Mari Ostendorf. 2005. Reading level assessment using support vector machines and statistical language models. In Proceedings of the 43rd Annual Meeting of the Association for Compu-tational Linguistics (ACL’05), pages 523–530, Ann Arbor, Michigan.
Rico Sennrich, Barry Haddow, and Alexandra Birch. 2016. Neural machine translation of rare words with subword units. InProceedings of the 54th An-nual Meeting of the Association for Computational Linguistics (Volume 1: Long Papers), pages 1715– 1725, Berlin, Germany.
Ilya Sutskever, James Martens, and Geoffrey Hinton. 2011. Generating text with recurrent neural net-works. In Proceedings of the 28th International Conference on International Conference on Ma-chine Learning, ICML’11, pages 1017–1024.
Wilson L. Taylor. 1953. Cloze procedure: A new tool for measuring readability. Journalism Quarterly, 30:415–433.
Sowmya Vajjala and Ivana Lucic. 2018. On-estopenglish corpus: A new corpus for automatic readability assessment and text simplification. In Proceedings of the Thirteenth Workshop on Innova-tive Use of NLP for Building Educational Applica-tions, pages 297–304, New Orleans, Louisiana.
Sowmya Vajjala and Detmar Meurers. 2012. On im-proving the accuracy of readability classification us-ing insights from second language acquisition. In Proceedings of the seventh workshop on building ed-ucational applications using NLP, pages 163–173.
Sowmya Vajjala and Detmar Meurers. 2014. Explor-ing measures of ”readability” for spoken language: Analyzing linguistic features of subtitles to identify age-specific tv programs. InProceedings of the 3rd Workshop on Predicting and Improving Text Read-ability for Target Reader Populations (PITR), pages 21–29.
Ashish Vaswani, Noam Shazeer, Niki Parmar, Jakob Uszkoreit, Llion Jones, Aidan N Gomez, Łukasz Kaiser, and Illia Polosukhin. 2017. Attention is all you need. InAdvances in Neural Information Pro-cessing Systems, pages 5998–6008.
Qizhe Xie, Guokun Lai, Zihang Dai, and Eduard Hovy. 2018. Large-scale Cloze test dataset created by teachers. InProceedings of the 2018 Conference on Empirical Methods in Natural Language Process-ing, pages 2344–2356, Brussels, Belgium.
Zhilin Yang, Zihang Dai, Ruslan Salakhutdinov, and William W. Cohen. 2018. Breaking the softmax bot-tleneck: A high-rank RNN language model. In Pro-ceedings of the International Conference on Learn-ing Representations, ICLR.
Adams Wei Yu, David Dohan, Minh-Thang Luong, Rui Zhao, Kai Chen, Mohammad Norouzi, and Quoc V. Le. 2018. QANet: Combining local convolution with global self-attention for reading comprehen-sion. In Proceedings of the International Confer-ence on Learning Representations, ICLR.