Proceedings of the BioNLP 2018 workshop, pages 172–176 172
Prediction Models for Risk of Type-2 Diabetes Using Health Claims
Masatoshi Nagata, Kohichi Takai, Keiji Yasuda
†, Panikos Heracleous, Akio Yoneyama
KDDI Research, Inc.
†
present affiliation: Nara Institute of Science and Technology
{ms-nagata, ko-takai, pa-heracleous, yoneyama}@kddi-research.jp, ke-yasuda@dsc.naist.jp
Abstract
This study focuses on highly accurate prediction of the onset of type-2 diabe-tes. We investigated whether predic-tion accuracy can be improved by uti-lizing lab test data obtained from health checkups and incorporating health claim text data such as medical-ly diagnosed diseases with ICD10 codes and pharmacy information. In a previous study, prediction accuracy was increased slightly by adding diag-nosis disease name and independent variables such as prescription medi-cine. Therefore, in the current study we explored more suitable models for prediction by using state-of-the-art techniques such as XGBoost and long short-term memory (LSTM) based on recurrent neural networks. In the cur-rent study, text data was vectorized us-ing word2vec, and the prediction model was compared with logistic re-gression. The results obtained con-firmed that onset of type-2 diabetes can be predicted with a high degree of accuracy when the XGBoost model is used.
1
Introduction
The incidence of lifestyle-related diseases is in-creasing in many regions (WHO, 2009; Lim SS et al., 2012). Predicting the onset of lifestyle-related diseases and implementing preventive measures in advance is important for municipali-ties and insurers. Particularly in type-2 diabetes mellitus, not only medical cost but also indirect cost such as reduced productivity present a seri-ous problem (American Diabetes Association, 2018), and therefore, it is very important to take preventive measures early.
From reports to date on the prediction of the onset of diabetes, it is well known that health checkup data items such as HbA1c, BMI, and ages are important indicators for estimating the onset of type-2 diabetes (Edelstein et al., 1997). Many related studies achieved accurate results by means of logistic regression and cox hazards regression models mainly based on bood test results (Droumaguet et al., 2006; Guasch-Ferré et al., 2012). These studies are aimed at predicting the onset of type-2 diabetes using a simple form. However, it is now common for machine learn-ing and data minlearn-ing methods to be used due to higher computer performance. Several studies have reported the effectiveness of using machine learning technique to improve classification ac-curacy (Meng et al., 2013; Tapak et al., 2013; Kavakiotis et al., 2017). Another attempt in-volved using clinical information such as health claims or electronic health records (EHRs). Health insurance claims data could prove to be a rich source of information for the early detection of type-2 diabetes as a previous study showed a slight improvement in prediction using such data
(Krishnan et al., 2013; Razavian et al., 2015). In this study, we aim to develop and evaluate prediction models for the risk of type-2 diabetes using health insurance claims data in addition to health checkup data.
2
Related work
currently, healthcare data management systems in-tegrate large amounts of medical information, such as diagnoses, medical procedures, lab test re-sults, and more. Health claims and EHRs are two examples of this medical information which in-cludes medical text data. It is suggested that there are latent factors that could improve diseases diction models by including diagnoses and pre-scribed medicines (Krishnan et al., 2013; Razavi-an et al., 2015). In addition, some natural lRazavi-an- lan-guage processing (NLP) techniques such as word2vec have been widely used to discover nov-el patterns and features (Choi et al., 2017; Jo et al., 2017). It is expected that data-driven assessment of individual patient risk would provide better personalized care (Neuvirth et al., 2011).
Recently, Razavian et al. (2015) showed that using an L1-regularized logistic regression (L1LR) model with about 900 variables from health insurance claim data resulted in an area un-der the ROC curve (AUC) of 0.80 compared with an AUC of 0.75 when using conventional diabetes risk factors. The L1LR model is an effective method where there are many independent varia-bles, although a recent machine learning study has suggested that a gradient boosting method (XGBoost) could achieve high performance pre-diction (Wei et al., 2017). Furthermore, long short-term memory (LSTM), which is based on a recurrent neural networks model, is feasible for long-range dependencies in sequential data.
In this paper, we compare multiple prediction models for diabetes incidence using health check-up and insurance claims data. In the study, three classification models (i.e. L1LR, XGBoost and LSTM) are developed, and their prediction per-formance is evaluated as an AUC.
3
Methods
In this section, the dataset and variables used for the evaluation of the proposed methods are de-scribed, and three prediction models are also pre-sented.
3.1 Dataset
In the experiments, a collection of anonymized yearly health checkup and health claims at a health insurance society in Japan is used. The health checkup items consist of profile infor-mation (e.g. age, sex), lab test results (e.g. body mass index, blood pressure, HbA1c), and health questionnaire (e.g. smoking, alcohol intake,
exer-cise level). We used 33 health checkup items as features for further experiments. The data were obtained from about 40,000 people aged 20 to 64 years. From the whole dataset, we selected those subjects who had health checkups regularly over a period of at least three years. In addition, we ex-cluded some samples missing blood test data. Af-ter selection was complete, the final total sample size was 31,000. We used 20% of the dataset ran-domly sampled for test data, and the rest was used for training. Subjects were diagnosed with diabe-tes if they had a measured fasting blood sugar (FBS) ≥126 mg/dL, or HbA1c 6.5%, or a diagno-sis of diabetes on a health insurance claim. Out-come was evaluated if a subject had onset of dia-betes in a year in the last of dataset.
3.2 Health insurance claims
Patient records of health insurance claims include medical cost, laboratory test, medical diagnosed disease with ICD10 (International Statistical Clas-sification of Diseases and Related Health Prob-lems) codes and pharmacy information related to the individuals between the years 2011 and 2016. About 5% of subjects had no claim data and had never visited clinics or hospitals. We used ICD10 codes and medicine name data for additional fea-tures. To build a training data, firstly, we checked FBS level and HbA1c of health checkup data, and ICD10 codes of diabetes in health insurance claims to extract positive examples.
Our goal is to predict onset of diabetes later than next year and the after that. Thus, for training and prediction, we did not use health checkup re-sults and health insurance claims of immediate 1 year before of diabetes diagnosis.
Since the health insurance claims are issued in monthly unit, there can be more than one ICD10 codes and medicine names in one health insurance claim. We preprocessed them by using word2vec
Figure 1: Diabetes prediction using LSTM.
3.3 Prediction model
As baseline, a conventional L1LR model was used. For L1 regularization hyper-parameter, we searched over values of [0.001, 0.01, 0.1, 1, 10], and 0.1 was selected as the optimum value.
In the experiment, we compare two state of the art prediction models. One is XGBoost which is a scalable machine learning system based on tree boosting (Chen T. and Guestrin C. 2016). To train the XGBoost model, we used scikit-learn API with default parameters. For XGBoost train-ing and L1LR models traintrain-ing, all features includ-ing medical checkup results, and distributed ex-pressions of ICD10 and medical ingredients are simply concatenated.
The other prediction model is Long Short-term Memory (LSTM). Figure 1 shows the LSTM architecture used in our experiments. As shown in the figure, the LSTM method consists of two training parts. The first part is health checkup, and second is the ICD10 code, or/and medicinal in-gredients of prescribed medicines.
{𝐱#, ⋯ , 𝐱&, ⋯ , 𝐱'} are an array of input sequence for LSTM. For example, 𝐱& could be embedded insurance claim vector at t-th month.
LSTM consist of four components comprising forget gate (𝐟&), input gate (𝐢&), output gate (𝐨&), and memory state (𝐜&). These real value vectors are calculated using the following formulas:
𝐟& = 𝜎 (𝐖2𝐱&+ 𝐔2𝐡&6#+ 𝐛2),
𝐢& = 𝜎 (𝐖9𝐱&+ 𝐔9𝐡&6#+ 𝐛9),
𝐨& = 𝜎 (𝐖:𝐱&+ 𝐔:𝐡&6#+ 𝐛:),
𝐜; = tanh (𝐖& @̃𝐱&+ 𝐔@̃𝐡&6#+ 𝐛@̃),
𝐜& = 𝐟&⊙ 𝐜&6#+ 𝐢&⊙ 𝐜;& (1)
where 𝐖and U are weight matrices, and b are bias vectors. 𝜎 (·) and tanh (·) are an element-wise sigmoid function and hyperbolic tangent function, respectively. Using these vectors, the hidden layer vector (𝐡&) is calculated as follows:
𝐡& = 𝐨&⊙ tanh(𝐜&) (2)
Where ⊙ is an element-wise multiplication. In our experiments, we used up to three kinds of fea-ture sets (shows in Table 1). Each feafea-ture set is processed by individual LSTM. After processing all of feature sets by LSTMs, each of the last hid-den layer vectors are concatenated as follows:
𝐡𝒂𝒃𝒄= 𝐡𝒂𝐡𝒃𝐡𝒄 (3)
By using 𝐡𝒂𝒃𝒄, the output layer calculates proba-bilities of diabetes. The output layer calculates probability of diabetes.
4
Results
Incidence of type 2 diabetes in our dataset was 4%. The characteristics detailed statistics are shown in Table 2.
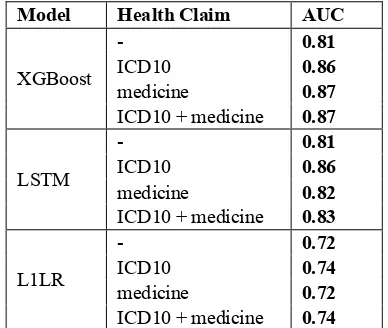
We developed three models namely XGBoost, LSTM, and L1LR. For each model, we used four patterns of health claim variables. Table 3 shows the AUC when using the three models. The results show that the performance of the XGBoost and LSTM models was superior to that of the L1LR model without health claim features. In our exper-iments, the highest performance was obtained
Characteristic ALL subjects Subjects with diabetes
Average age 41.63 48.23
Female ratio 0.33 0.15
Average length of
data in years 3.04 3.75
Body mass index
[image:3.595.299.524.84.161.2](kg/m2) 23.07 27.18
Table 2: Characteristics of the dataset.
Model Health Claim LSTMa LSTMb LSTMc
XGboost LSTM L1LR
- 33 N/A N/A
ICD10 33 200 N/A
medicine 33 N/A 200
ICD10
[image:3.595.307.523.211.300.2]+ medicine 33 200 200
when the XGBoost with ICD10 plus medicine features was used. On the other hand, the L1LR model had the lowest AUC, though a slight im-provement was obtained by incorporating health claim data.
LSTM with the ICD10 model showed a rela-tively high performance, however, adding pre-scribed medicine features did not improve its level of prediction.
5
Discussion
In this study, we compared the predictive perfor-mance of a conventional model to that of machine learning-based models using health checkup data and additional health claim features vectorized by word2vec. The results showed that the XGBoost and LSTM models achieved better performance compared to the L1LR model without using health claim information. Adding health claim features improved prediction performance in each of the three models. This is consistent with a previous study in which use of the L1LR model obtained slightly improved prediction performance (Ra-zavian et al. 2015). These results suggest that medical information contains latent signals for risk factors associated with the onset of diabetes.
In terms of how to use health claim data, a previous study used the data as one-hot vectors. However, one-hot encoding cannot express the re-lationship and meaning between words. On the other hand, word2vec makes it possible to give a latent meaning to the vector. This effect was con-sidered to be valid in the case of the XGBoost model.
In recent years, the LSTM model has been used to estimate disease name or mortality from medical information obtained from medical sys-tems with a high degree of performance (Ayyar et al., 2016; Lipton et al., 2016; Jo et al., 2017). LSTM can embed influence over time series data across multiple layers. Therefore, although we ex-pected this effect in our experiments, prediction performance was not improved much when ICD10 and medicine name were used in combina-tion, compared with the case when using only ICD10. This result can probably be attributed to the difference in the quality of the information be-tween the diagnosis disease name and prescription medicine.
Our study has several limitations. First, the vectorization from health claims data was empiri-cally set to 200 dimensions. However, it is not clear what the optimal dimension is. Second, the duration in terms of years of the dataset is rela-tively short. From the standpoint of disease pre-vention, it may be desirable for predictive purpos-es to extend this period to three years or more. Fi-nally, the dataset sample population may have been biased because our data collection depended on information from one health insurance society.
6
Conclusion and Future Work
It would be useful in terms of practicality if risk could be estimated easily with noninvasive data. However, it is also very important, from the view-point of personal care, to predict onset of disease with a high degree of precision with obtained from various types of medical information. In this study, we developed and evaluated several predic-tion models for type-2 diabetes to explore an ef-fective means of vectorization using health claims. We used health claims, ICD10 and prescribed medicine name as variables in addition to health checkup data by vectorizing via word2vec. The results showed that the XGBoost model with health claim variables achieved a higher perfor-mance compared to the LSTM and L1LR models. Our study suggests that there are potential factors contained in large amounts of medical information which may be signals to the onset of diabetes. It is possible that the LSTM model may still be able to further improve prediction performance as well. As future work, we plan to test the effect of di-mensional compression by parameter tuning.
Model Health Claim AUC
XGBoost
- 0.81
ICD10 0.86
medicine 0.87
ICD10 + medicine 0.87
LSTM
- 0.81
ICD10 0.86
medicine 0.82
ICD10 + medicine 0.83
L1LR
- 0.72
ICD10 0.74
medicine 0.72
[image:4.595.84.278.90.254.2]ICD10 + medicine 0.74
References
American Diabetes Association. 2018. Economic costs of diabetes in the U.S. in 2017. Diabetes Care;41:917–928.
Ayyar S. Don' OB. & Iv W. 2016. Tagging Patient Notes with ICD-9 Codes. In Proceedings of the 29th Conference on Neural Information Processing Systems (NIPS 2016).
Chen T. Guestrin C. XGBoost: A Scalable Tree Boost-ing System. 2016. 22nd ACM SIGKDD Int. Conf.
785 DOI: 10.1145/2939672.2939785.
Choi E. Schuetz A. Stewart WF. and Sun J. 2016. Medical concept representation learning from elec-tronic health records and its application on heart failure prediction. arXiv preprint arXiv: 1602.03686.
Jo Y. Lee L. and Palaskar S. 2017. Combining LSTM and latent topic modeling for mortality prediction.
arXiv preprint arXiv:1709.02842.
Kavakiotis I. Tsave O. Salifoglou A. Maglaveras N. Vlahavas I. Chouvarda I. 2017. Machine learning and data mining methods in diabetes research.
Comput Struct Biotechnol J. 15:104–16.
Kengne AP. Beulens JW. Peelen LM. Moons KG. van der Schouw YT. Schulze MB. et al. 2014. Non-invasive risk scores for prediction of type 2 diabe-tes (EPIC-InterAct): a validation of existing mod-els. Lancet Diabetes Endocrinol. 2:19-29.
Krishnan R., Razavian N., Choi Y., Nigam S. Blecker S., Schmidt A., Sontag D. 2013. Early detection of diabetes from health claims. NIPS workshop in Machine Learning for Clinical Data Analysis and Healthcare.
Lim SS. Vos T. Flaxman AD. Danaei G. Shibuya K. Adair-Rohani H. et al. 2012. A comparative risk assessment of burden of disease and injury at-tributable to 67 risk factors and risk factor clusters in 21 regions, 1990–2010: a systematic analysis for the Global Burden of Disease Study 2010. Lancet.
380(9859):2224–2260.
Lindstrom J. Tuomilehto J. 2003. The diabetes risk score: a practical tool to predict type 2 diabetes risk, Diabetes Care, vol. 26:725-731.
Lipton Z. Kale D. Elkan C. Wetzell R. 2016. Learning to diagnose with LSTM recurrent neural networks.
arXiv preprint arXiv: 1511.03677.
Meng XH. Huang YX. Rao DP. Zhang Q. Liu Q. 2013. Comparison of three data mining models for pre-dicting diabetes or prediabetes by risk fac-tors. Kaohsiung J Med Sci. ;29:93–99.
Nanri A. Nakagawa T. Kuwahara K. Yamamoto S. Honda T. Okazaki H. ..., for the Japan
Epidemiolo-gy Collaboration on Occupational Health Study Group. 2015. Development of risk score for pre-dicting 3-year incidence of type 2 diabetes: Japan epidemiology collaboration on occupational health study.PloS One. 10:e0142779.
Neuvirth H. Ozery-Flato M. Hu J. Laserson J. Kohn MS. Ebadollahi S. Rosen-Zvi M. 2011. Toward personalized care management of patients at risk: the diabetes case study; Proceedings of ACM inter-national conference on knowledge discovery and data mining; 395–403.
Razavian N. Blecker S. Schmidt AM. Smith-McLallen A. Nigam S. Sontag D. 2015. Popula-tion-level prediction of type 2 diabetes from claims data and analysis of risk factors. Big Data. 3:277– 287.
Schulze MB. Heidemann C. Schienkiewitz A. Berg-mann MM. HoffBerg-mann K. Boeing H. 2006. Com-parison of anthropometric characteristics in pre-dicting the incidence of type 2 diabetes in the EP-IC-Potsdam Study. Diabetes Care ;29:1921–3. Tapak L. Mahjub H. Hamidi O. Poorolajal J. 2013.
Real-data comparison of data mining methods in prediction of diabetes in Iran. Healthcare Informat. Res., vol. 19, no. 3, pp. 177-185.
Thomas C. Hypponen E. Power C. 2006. Type 2 dia-betes mellitus in midlife estimated from the Cam-bridge Risk Score and body mass index. Arch In-tern Med 166:682–688.
Wei X. Jiang F. Wei F. Zhang J. Liao W. & Cheng S. 2017. An Ensemble Model for Diabetes Diagnosis in Large-scale and Imbalanced Dataset. Proceed-ings of the Computing Frontiers Conference on ZZZ - CF17. doi:10.1145/3075564.3075576. WHO. 2009. Global health risks: morality and burden