Munich Personal RePEc Archive
Gross Domestic Product – National
Income of Romania 1862 – 2010. Secular
statistical series and methodological
foundations
Axenciuc, Victor and Georgescu, George
Institute of National Economy
16 October 2017
Gross Domestic Product
–
National Income of Romania 1862
–
2010.
Secular statistical series and methodological foundations
Victor Axenciuc
George Georgescu
Abstract
Starting from the importance and need to investigate one of the most relevant issues regarding the structure and dynamics of the economic and social development of all countries in the world, the book focuses on Romania, from the perspective of certain synthetic indicators, aggregated at macroeconomic level, i.e. the Gross Domestic Product and the National Income, on long data series over the past 150 years, also taking into account the comparative
international context, in terms of purchasing power parity. The Part One contains a synthesis,
developed and completed, of GDP data for each year of the period 1862 – 2010 and also indicators resulting from the GDP, as Net Domestic Product, Net National Product and National Income. The historical research has adopted and applied, with maximum attention, criteria that substantiated the calculations, through rigorous techniques and methods of data aggregation, in order to remove certain errors that would lead to distorted results, focusing on the accuracy of evaluations, so that they would express, in the most genuine manner, the real dimension of the statistical indicators, allowing for a correct interpretation of the economic phenomena. The operations for compiling the indicators are accompanied by comments regarding the criteria and calculation methods, as well as by methodological explanations, so that the data would be able to be rebuilt in a better format, by the interested authors, should they have a more reliable and relevant statistical information about Romania. The Part Two of the book focuses on the international literature, dedicated to criticisms theoretical and methodological opinions regarding the GDP, as well as a comparative analysis of the GDP evolution in Romania, in various hypotheses, compared to other countries.
Key words: System of National Accounts; International Comparison Program; wellbeing; GDP criticism; Romania EU convergence.
JEL Classification:B15, B41, C82, E01, N10, O11
Victor AXENCIUC George GEORGESCU
_______________________________________________________________________________________Gross Domestic Product
–
National Income of Romania
1862 - 2010
Secular statistical series and methodological foundations
S U M M A R Y
Preface...
Historical and methodological introduction……….
PART ONE
Section A: The Gross Domestic Product during 1862-2010
Overall synthesis of statistical series...
Section B: The Gross Domestic Product during 1862-1947
Historical and methodological introduction……….
Synthesis of computing detailed statistical series...
Section C: The Gross Domestic Product during 1950-1979
Historical and methodological introduction……….
Calculations for converting the National Income to Gross Domestic Product...
Section D: The Gross Domestic Product during 1980-2010
Historical and methodological introduction……….
Compatibility calculations in comparable prices...
Section E: External sector indicators
The external debt of Romania during 1864-2010...
The BoP current account balance of Romania during 1862-2010...
PART TWO
1. The GDP and national accounts………
2. The GDP relevance and limitations………..
3. Addressing GDP deficiencies………
4. International comparisons……….
5. Eurostat indicators for the EU cross-country comparisons………
References...
Addendums
The Foreward of NIS President to the Romanian edition ...
P R E F A C E
Starting from the importance and need to investigate one of the most relevant issues
regarding the structure and dynamics of the economic and social development of all countries
in the world, the authors elaborated this volume, by focusing their scientific research on
Romania, from the perspective of certain synthetic indicators, aggregated at macroeconomic
level, i.e. the Gross Domestic Product and the National Income, on long data series over the
past 150 years, also taking into account the comparative international context, in terms of
purchasing power parity.
This volume is structured into two scientific parts. Part One represents a synthesis, developed and completed, of the work of professor Victor Axenciuc published in Romanian
(The Gross Domestic Product of Romania – 1862-2000, Volumes I and II). The present paper contains secular statistical series and methodological arguments, detailed over more than 1300
pages. It is considered a synthesis because, by rigorous selection of the most significant statistical worksheets regarding the aggregate indicator – Gross Domestic Product –, a number
of 250 papers were kept, leaving aside numerous calculations and preliminary tables and
addendums of documents; Part One also stands for development, because the current research extended the analysis period until 2010 and, in addition, indicators resulting from the GDP –
Net Domestic Product, Net National Product – and National Income were calculated for the entire period.
Part Two of the study, elaborated by George Georgescu, PhD, focuses on the international literature, dedicated to criticisms theoretical and methodological opinions
regarding the Gross Domestic Product, as well as a comparative analysis, also novel in nature,
of the evolution of this indicator, in various hypotheses, of the Romanian economy compared
to other countries.
Our historical research has adopted and applied, with maximum attention, criteria that
substantiated the calculations and that verified them, through rigorous techniques and
methods of data aggregation, in order to remove certain errors that would lead to distorted
results, focusing on the accuracy of evaluations, so that they would express, in the most
genuine manner, the real dimension of the statistical indicators, allowing for a correct
As it is the case of any research topic, which requires a complex approach, in time and
space, the quality and utility of these secular statistical series would be validated by the future
activity of scientific knowledge and by further researche astudies in the field. We would like
to point out that the operations for compiling the indicators are accompanied by explanations
and comments regarding the criteria and calculation methods, so that the data would be able
to be rebuilt in a better format, by the interested authors, should they have more reliable and
relevant statistical information available, as well as by methodological improvements.
Such research studies with outstanding results, in which the economic past of several
centuries is expressed in the language of modern statistical representations, have been
developed in several countries by different authors and/or institutions, most often of academic
nature, measuring the evolution of synthetic macroeconomic indicators by groups of
countries, continents and even at a global level.
As regards Romania, it must to be mentioned that, due to the discontinuity of data
series which could be compared for longer periods of time, also caused by territorial and
political regime changes that have occurred over the past 150 years, the analytic studies
focusing on the macroeconomic evolutions at a national and international level are relatively
few, seizing, in a compact manner, only some of the periods from the reference interval.1
In Part One of the paper, depending on the nature of the statistical information and
the calculations performed, the secular interval of the topic, which focuses on the period
1862-2010, was developed on three time segments, 1862-1947, 1950-1979, and 1980-2010
respectively (corresponding to sections B, C, and D), anticipated by the presentation of a
general synthesis, for the entire period (Section A).
The time segment of the period 1862-1947, which represents the backbone of the
paper, was fully developed starting with the collecting and processing of the information for
primary operations, up to the development of synthetic indicators.
The module of the 1950-1979 interval was developed by converting the data regarding
the National Income according to the System of Material Production, presented in the official
statistics, to the Gross Domestic Product.
The time segment of the period 1980-2010 was developed by transposing the data in
current prices published by the National Institute of Statistics and the National Bank of
Romania, to comparable prices.
1Some of them were useful for our historical research, mentioning in this context the National Income of
At the end of Part One, the aggregate indicators deriving from GDP, e.g. the Gross
National Product, Net Domestic Product and National Incomeare presented by making
calculations and processing some data on the historical series, taking into account the levels of
the external debt, the BoP current account balance and the consumption of fixed capital.
The building of secular retrospective series of economic statistical indicators and
calculating, for the same historical period, the macroeconomic synthetical aggregates,
represented, especially in the second half of the 20th century, one of the main concerns and
focuses of economics and international institutions at global level.
Part Two of the paper, in a theoretical and methodological approach to the Gross Domestic Product issues, presents a short history of the System ofNational Accounts,
focusing on the methodological changes of the SNA 2008 and ESA 2010, respectively, as
well as their impact on revising the GDP at the level of the European Union.
In the context of the global crisis effects on certain macroeconomic and financial
concepts, and from the perspective of the GDP indicator relevance, despite methodological
improvements, certain limits are highlighted in this regard, as well as its interpretation
distortions, sometimes strained to abusive forms and diverted for political purposes.
The attempts to address the GDP deficiencies, many of them being included in the
recommendations of the Stiglitz-Sen-Fitoussi Commission, focused on establishing certain
GDP complementary indicators, as well as systems of alternative indicators, suggested by
different authors or international institutions, that would reflect, in a more adequate manner,
the individual and social wellbeing, both for analytical and operational purposes.
At the end of Part Two our research focuses on international comparisons regarding
the GDP at the purchasing power parity, highlighting Romania’s position in European and/or
global rankings, its evolution over time, as well as the relative and absolute gaps compared to
advanced countries, adding some considerations regarding the perspectives of the real
convergence with the EU Member States.
Considering that they would add value and interest to the paper, the foreword by
Professor Vergil Voineagu to the Romanian edition, a historical background and
acknowledgements for the same edition, are presented in the addendums.
In the elaboration of this study the authors started from the belief that the historical
data, the secular indicators assessed, as well as our own interpretations, would be useful for
the scientific research studies of historians, economists, sociologists and all who would
develop retrospective or prospective analyses regarding the evolution of the social and
An articulated, coherent system of statistical data, implicitly of the aggregate
macroeconomic indicators for long periods of time, can represent benchmarks for
substantiating certain policies aimed at the present and future of our country, focusing on the
characteristics of the cyclical secular evolution, as well as the nature of development gaps and
convergence prospective in the European and global context. The foundation of the current
processes and phenomena based on historical and economic sources, the ascertainment by
synthetic indicators of the secular dynamics and continuity of the economy evolution and
transformation affords a more comprehensive perspective for understanding the present and
future trends of the long-term macroeconomic cycles.
Any research paper, such as the current one, enjoys the information support of certain
institutions and persons. In this regard we would like to thank the National Commission of
Prognosis, the National Institute of Statistics, the Institute of National Economy, and the
National Institute for Economic Research of the Romanian Academy; for technical operations
and type scripting we benefitted from the support of Mrs. Rădoi Alina and Mrs. Mincu
Cristina, who deserve our special thanks.
At the end of this preface we consider that any rigorous scientific endeavor, as we
hope ours has been, should be constantly guided by the everlasting truth expressed by Seneca:
Historical and methodological introduction
The building of the retrospective series of the economy statistical indicators, and in
particular calculating the macroeconomic aggregates during the same historical time frame
represented, especially since the second half of the 20th century, one of the main interests and
concerns of economics at global level. The substantiation of the current processes and
phenomena based on historic-economic sources, establishing by synthetic indicators the
retrospective dynamics, the secular continuity of the evolution and transformations of the
economy ensure a more comprehensive perspective of the analysis and understanding of the
current and future development trends, of the unfolding the long term macroeconomic cycles.
Such researches with outstanding results, where the economic history of several
centuries became expressed in the language of modern statistical representations, have been
developed in several countries.2 At the same time, such comparisons are performed by groups
of countries, continents, and at a global level.3
2 Studies in this field have been mostly published in prestigious periodicals: The Review of Income and Wealth,
Income and Wealth, The Journal of Economic History, The Journal of European Economic History, Bulletin de
l’Institut International de Statistique, Weltwirtschaftliches Archiv, etc. as well as papers in different countries: Deane, Ph., Cole, W.A., British Economic Growth, 1688-1959. Trends and Structure, Cambridge, 1964; Hofman, W.G., Műler, J.H., Das Deutsche Volkseincomme 1851-1957, Tübingen, 1959; Johansson, O., The Gross Domestic Product of Sweden and its Composition, 1861-1955, Stockholm, 1957; Firestone, O.J., Canada
‘s Economic Development, 1867-1953, London, 1958; Eckstein, A., National Income and Capital Formation in Hungary, 1900-1950, London, 1953; Bjerke, K., The National Product of Denmark, 1870-1952, London, 1955; Markzewski, J., Some Aspects of the Economic Growth of France, 1660-1958, 1961; etc. More detailed references having the same scientific value can be found in the special section of our study dedicated to the bibliography (resources).
3 Kuznets, S., Economic Growth of Nations, 1977; Maddison, A., Economic Growth in the West. Comparative
Experiences, New York, 1964; Bairoch, P., The Economic Development in the Third World since 1900, London, 1975; idem, Europe’s Gross National Product, 1800-1975; Cipola, C.M., Before the Industrial Revolution: European Society and Economy, 1000-1700, New York, 1976; Maddison, A., Growth and Fluctuation in the World Economy, 1870-1964; idem, The World Economy in the Twentieth Century, 1989; idem, Monitoring the World Economy 1820-1992, 1995; idem, The World Economy, vol. I, A Millenniar Perspective, - 2001; vol. II, Historical Statistics, - 2006. In the 20th century, the international institutions and programs, through economics
departments calculated and estimated the synthetic indicators of the national income, gross domestic product, gross national product and their components, in different countries and groups of countries, on different continents for medium and long term periods; among these we can find The Society of the Nations in the 20s-40s; after 1945, the United Nations, the Organization for Economic Cooperation and Development, the United Nations Program for Development, the World Bank, the International Monetary Fund, the European Free Trade Association, the European Union, etc. The estimations and calculations of the macroeconomic outcome indicators at international level were developed and are still being developed by different public and private educational and research institutions. All these led to the development of rich literature, statistical data analyses for numerous countries, based on different calculation methodologies and various outcomes of economic development measurement.
During the period 1860-1950, there is only one study in the Romanian literature regarding the national income of
Romania, and it is for the medium term; the said paper bears the title “National income of Romania” for the
period 1926-1938 by Mitiţă Georgescu for the Romanian Encyclopedia and published in its 4th volume in 1943.
The data provided by this study, continue to be, seven decades later, the only source of information regarding the national income of our country until de middle of the 20th century, being utilized also by international specialized
In these international studies, the data regarding our country, for long periods of time,
are missing or, in rare situations, they are author estimations.
Until the middle of the 20th century, the official statistics institution in Romania did not
publish data regarding the national income of the country, as it was the case in most of the
European countries. The lack of official data regarding the global indicator - is one of the first
arguments for focusing our research on two time intervals; the first one - 1862-1947 to which
the second volume of the paper in Romanian was dedicated4 and in which the full calculation of
the indicator was performed, and the second interval - 1950-2010, for which the official
statistics published successive series of data regarding the National Income in the system of
material production – SMP for 1950-1990 and regarding the gross domestic product5 as of
1980;
In our research the two indicators underwent different statistical compatibility
operations, which are explained into detail below, in order to obtain full statistical series -
1862-2010 - comparable with the GDP, in international currency, USD PPP 2000.
4 Victor Axenciuc, Romania’s Gross Domestic Product, 1862-2000, vol. I and II, “Editura Economică”
Publishing House, Bucharest, 2012.
5 In the Romanian economic research, both the institutional one as well as the one of different authors, the
calculation methodology utilized for the macroeconomic indicators in the Romanian system of national accounts started to be assimilated in the 70s, during the 20th century. Different state institutions operating in the field of
synthesis, the Central Directorate for Statistics (CDS), the State Planning Committee, the Ministry of Public Finances etc., directly or by means of the institutes and departments methodology, developed researches and studies regarding the SNA, on the manner in which it is applied in the official statistics in order to compare the Romanian macroeconomic indicators with the indicators of the Western countries. It wass the period during which Romania, after two decades of isolation, was looking for financial, scientific and political opportunities etc.; it becomes a member of the International Monetary Fund, of the International Bank for Reconstruction and Development. In the Western economies the application of the SNA was expanded, becoming the official methodology of many member states of the United Nations and of its bodies.
Among the studies developed in the 70s and 80s regarding the SNA, we would like to mention the following: The methodology for calculating the national income, the gross and net domestic product in accordance with the system of national accounting, developed by SPC in 1973; the study regarding the possibilities of using in Romania a national accounts system, developed by the Center for Financial and Monetary Researches of the Ministry of Public Finances, in 1974; several papers of the Central Directorate for Statistics regarding the methodology and calculation of the gross domestic product in Romania, developed in the period 1974-1979; the Institute of National Economy also developed in 1986, with the same purpose, papers on the Problems of determining the macroeconomic summary indicators, Study Paper n. 112; Problems of international comparability of the summarized indicators, Study Paper no. 113 of 1989. SPC, the Ministry of Public Finances, CDS and the Central Institute for Economic Research developed the study having the title Unitary Methodology for Planning and Monitoring the Gross National Product, etc.
After 1990 the SNA becomes official in Romania, in the field of statistics and economy; the universities teach classes, perform scientific research in this field. The National Institute of Statistics publishes periodical papers regarding the National Accounts and numerous methodological publications. Among the papers worth mentioning: System of National Accounts and Macroeconomic Aggregates (1994) by I. Capanu, P. Wagner, C.
This was presented in different sections in Volume I of the Romanian edition and, in a
summarized manner, adequate for this study, in section A in English.
We would like to mention that, as compared to the previous Romanian edition, which
contains the 1962-2000 time series, we have updated the statistical series of the GDP,
expanding it with the decade until 2010, in comparable monetary terms, based on USD PPP
2000. The absolute data regarding the GDP for this interval - 2001 - 2010 - were calculated by
means of dynamic and structure indexes, with the base 100 in the year 2000, as provided by the
National Institute of Statistics.
Our research regarding the calculation on long term, for historical time series,
Romania’s macroeconomic indicators, e.g. the national income, and subsequently the gross domestic product, dates back in the 20th century; it was developed in the period 1962-1963 as a
retrospective knowledge and synthesis study of the Romanian economy, by means of national
income, and the author was teaching during the period a university class of economic history.
When we are young, our dreams are big and beautiful and they guide our ideals, the purpose of
our activity, and, in my case, the research activity. Due to the fact that the specialized literature
did not contain a calculation of the statistical series of the national income of Romania 1860
-1950 - series which is necessary in order to convert it to GDP, I decided to compute the national
income series for this period.
After several years of investigation in the libraries, the documentation activity
underlined the higher complexity of the topic and the insurmountable difficulties regarding the
statistical data. The statistical information available for the period of almost one century was
fragmented, incomplete, lacking in data for decades; others had a higher level of uncertainty
and did not allow the direct setting of the annual series of indicators necessary in order to
determine the national income. Thus, with the same level of determination I decided first of all
to establish and reestablish the statistical series of the national economy for the said period,
1860-1950, and afterwards, based on the said data, to develop the indicators of the national
income.
More than two decades of investigations in libraries and archives, more than I could
have initially imagined, this new activity required and it was finalized within the Institute of
National Economy of the Romanian Academy. The research of the topic has benefitted from the
collaboration of certain researchers, colleagues which were mentioned in the first edition and at
the end of this edition.
Finally, the historical time series, as a basis for calculating the national income, most of
thousand indicators for the period 1859-1947, were completed and subsequently published, by
the Romanian Academy’s Publishing House6, in three volumes.
Thus, having most of the basic statistical information established, reestablished and
verified, we were then able to move to the next stage and calculate the components of the
national income. The topic was accepted within the research program of the Institute and it was
implemented; the first draft was finalized, as a manuscript, at the end of the 80s, and it bears the
title National Income of Romania in the period 1862-1938, based on the methodology of the
system for material production. The activity of the fist years had as result the data necessary for
each main branch of material production and services for the indicators of the national income.
Several versions of the paper, based on the initial format, in the thematic structure and
monetary terms were developed, and this represented, in fact, steps towards a more
comprehensive document. The indicators were calculated in successive alternatives, focusing
on the most appropriate format: in current prices, comparable prices of 1938 and in the prices of
1913; each price alternative has pros and cons.
In 1993 we moved to the general rebuilding of the project, from the formula of the
national income to that of the gross domestic product for the period 1862-1938; in the following
years, the different variants of GDP indicators were developed for the time interval 1939-2010.
Depending on the nature of the statistical information and the methodology used, as shown
above, the secular investigation time interval of the topic - 1862-2010 - was investigated and
structured on three time intervals and three sections: the periods 1862-1947, 1950-1979,
1980-2010. Each time interval having different statistical sources and calculation methods, was made
compatible at a later date. For these there are three corresponding results sections, and they
follow the same order: Section B-1862-1947; Section C-1950-1979 and Section D-1980-2010;
The first time interval, 1862-1947, focused most on the research activity, documentation, development of the methodology, calculation of the gross domestic product
starting with the primary operations until the final ones; the final format – the Romanian GDP
1862-1947 - is Volume II, of the previous edition, having 875 pages, based on which the
summarized version was developed which is presented in Section B.
The second interval of the topic comprises the period 1950-1979, for which the calculations focused on the conversion of the data regarding the national income, presented in
6 Victor Axenciuc, Evoluţia economică a României. Cercetări statistico-istorice 1859-1947, vol. I, Industria şi
the official statistics, in accordance with the system of material production - SMP - to the series
of the gross domestic product according to the national accounts system - NAS - they are
presented in Section C.
The third and last time interval focuses on the decades 1980-2010. The NIS provides data for the entire interval, 1980-2010, regarding the gross domestic product in current prices;
they were translated in comparable prices, in lei, in Section D.
With the view of having a full and unitary, continuous and comparable presentation, the
series of the gross domestic product indicator in the three sections - B, C and D - were
cumulated in the single series of the period 1862-2010, after the data in lei expressed in the
prices of different years were converted, using the presented methods, in international dollars,
at the purchasing power parity – PPP of the year 2000. Thus, the full presentation of the 1862-2010 series of the gross domestic product, breakdown on resources, expressed in indicators and indexes, in dynamics and structures is shown in Section A of general synthesis.
In order to make compatible the macroeconomic indicators for the period -1862-2010 -
the calculation data of the three sections, expressed in lei in constant prices for each interval,
that allowed also comparison within the series, were converted, in accordance with the methods
specified in each section, in international currency - dollars at the purchasing power parity of
the year 2000, thus ensuring the compatibility of the entire series.
We decided to convert the national currency in dollars PPP 2000, taking into account the
possible comparisons that the reader might want to perform with similar indicators from other
countries, expressed in USD PPP. Of course, with the available means a single researcher does
not have the possibility to calculate the lei versus dollars purchasing power parity of such a long
period of time.
The method that we used, namely the conversion of the GDP from the national currency
- lei - into the international currency - dollars PPP - was a simplified one; for the period
1862-1947, during which the indicators are expressed in comparable prices - lei gold 1913, the
conversion was done, as it is explained into detail in the Special Introduction, by transforming
them in dollars gold 1913, close to the purchasing power, and multiplying the obtained data by
depreciation coefficients of the US dollar until 2000; for the periods 1950-1979 and 1980-2010,
the conversion of the gross domestic product indicators from lei comparable prices to dollars
PPP 2000, was done based on the converter of the year 1975, namely of 8.8 lei = 1 dollar PPP,
determined in the 3rd round of the International Comparisons Program7, as follows: the gross
7 The baseline data included: The Economic Memorandum of Romania 1983 and the International Comparisons
domestic product indicators series 1950-1979, expressed in comparable prices in lei 1963, were
transformed based on the price index comparable lei price 1975 and were divided to the 1975
PPP converter, respectively 8.8 lei = 1 dollar PPP; the GDP series in dollars PPP 1975 thus
obtained was multiplied by the depreciation coefficients of the US dollar between 1975 and
2000, thus resulting the 1950-1979 GDP series in dollars PPP 20008.
The series of the gross domestic product indicators for the years 1980-2000, was
converted in dollars PPP 2000, as follows: for the period 1980-2000, the gross domestic
product calculated in comparable lei 1990, as highlighted in the Introduction was updated by
using the price index, to the level of the comparable prices of 1975; the data were divided to the
8.8 converter, building the GDP 1980-2000 series in dollars PPP 1975, which in turn was
multiplied by means of the depreciation coefficients of the GDP USA dollar between
1975-2000, finally resulting in the 1980-2000 GDP series, in PPP dollars 2000; the GDP series for
the last decade of the period, respectively 2001-2010, due to the lack of official data regarding
the GDP in comparable prices and of the official deflator of the current prices (not published by
the official statistics), in order to obtain the GDP figures for the period 2001-2010, we utilized
the GDP indexes of the period with a fixed base (100% in 2000) which were successively
multiplied with the available data of the GDP by resources for the base year 2000.
The simplified method that we applied in order to be able to compare the GDP indicator
expressed in international comparable currency proved to be efficient. It was also applied by
some of the foreign researchers.
Despite all the differences between the calculation and conversion methods for the GDP
in dollars PPP of the four intervals: 1862-1947, 1950-1979, 1980-2000 and 2001-2010, the
statistic series of the GDP indicator per capita 1862-2010, in dynamics and structure, does not
have, as shown, any discrepancies in the evolution or any disagreements with the temporal
thresholds between them. We consider that this is the essential argument of the plausible nature
of the adopted solutions. For the sake of confirmation, we show that the thresholds between the
periods, that marked the change of the calculation methods and conversion solutions, the years
8After 1975 the International Comparisons Program had some other rounds as well, out of which the one related
1947 and 1950, 1979 and 1980, the differences between the size of the GDP per capita and its
structure by resources are plausible. Thus, when in 1950, after the post-war recovery, the
economy achieved the level of 1939, the GDP per capita in dollars PPP 2000 stood at 1342
dollars as compared to 1164 dollars in 1939, a plausible and acceptable difference, especially
after a decade of major structural, economic and social transformations. At the same time, at the
threshold between the two methods of calculation, between 1979 and 1980, the same indicator
is expressed in 1979 as 8974 dollars and in 1980 as 8939 dollars, the difference being also
normal, acceptable.
Once again we would like to underline that all these prove that the statistical methods
and solutions were substantiated in an adequate manner and were used correctly, being
confirmed, with some reserves, by the result expressed in dynamics and structure of the GDP
series for the entire period of 1862-2010.
In conclusion, with these methodological applications we conclude the part I point 1
containing, in a summarized manner, the four sections for calculating the aggregate outcome -
GDP - of Romania for one and a half century.
As compared to the Romanian version, this paper has deepened even further the
research, calculating the aggregates of the GDP, for the same time interval and with the same
value parameters – international dollars PPP 2000 – the Gross Domestic Product and National
Income, respectively the Net National Product, based on the revised version of the National
Accounts System of 1955.
The topic of synthetic macroeconomic indicators, GDP, NNP, GNP, etc. enjoyed a long
theoretical and methodological debate, ever since the first aggregate drafts for measuring the
national economic activities and international comparisons. From the content, the area of
coverage, the efficiency of measurements, the value of results etc., of the synthetic aggregates,
some verified in the historical practice of different countries, the virtues as well as the limits of
these statistical instruments were revealed. To this regard, in order to ensure as added value of
knowledge to the users of data regarding the gross domestic product of Romania, the part II of
this paper envisages a summary of the main theoretical and methodological debates, from the
international specialized literature regarding the global outcome aggregates, as well as a section
with data showing the position Romania within the international comparisons rankings,
according with certain models and values of economic and social indicators.
This analysis of the concepts, criticisms and solutions for improving the synthetic
aggregates, highlighted in the publications of highest scientific level, has not only the value of
reading it to debate these important topics. Furthermore, by a more comprehensive and
documented insights, the users of the statistical information from the first part of the study will
be able to evaluate, in a more critical manner, the calculations and data value, as well as having
the possibility to improve the methodology; the authors welcome the potential comments9.
As concerns the proceedings of presenting the data series, of classifying the components of the
statistical and methodological matter, solutions with a high level of systematization and clarity
were accepted; the statistical situations are assigned with figures and letters as reference and
identification indicatives.
As concerns the framework of the research methodology, the principles and criteria, the
calculation methods which were utilized, the territorial and temporal framework, the
investigation area, the prices in comparable lei and dollars PPP, etc. - these are mostly
presented in the Introductions of each section; the summary of the tables is presented in pairs,
having a double approach: in the series of years averages (four-six years), being more
concentrated, on one page, and in annual series, in an extended format on three-four pages.
The changes in territory and potential, of the period 1862-1947, in three moments (years
1918, 1940, 1945) led to extra economic modifications in the size of the indicators, which does
not ensure their comparability for the entire period; these historical thresholds are marked in
tables with a horizontal line for the year when the border was moved. In order to overcome this
obstacle, the indicators were divided to the number of inhabitants, solution which allows, with
some reserves, to compare the data for the time interval 1862-2010.
9Beyond the GDP, June 2016, Debate at National Institute of Statistics, where Andrei Tudorel, Ph. D., President
PART ONE Section A
THE GROSS DOMESTIC PRODUCT OF ROMANIA DURING 1862-2010 Overall synthesis of statistical series
The statistical series of Section A,summarizing the indicators of the gross domestic product, for the period 1862-2010, focuses on presenting, in dynamics and structure, the most
important economic processes - which can be expressed statistically - of Romania’s evolution
within the historical borders of the state. The analysis of the macroeconomic aggregates from
the constitutive sections of the investigated periods, 1862-1947, 1950-1979 and 1980-2010
provides through the multitude of indicators resulting from research, a broad field of
considerations and conclusions; this focuses on the nature, profile and structure of the economy,
the stages and level of its development during different periods of time, as well as the
specificity of this development, in comparison with other countries, on the way of modern and
contemporary history.
Such analysis and interpretations of the various indicators, in the context of knowing the
economy, will contribute to positioning the study of the Romanian economy on a better base of
arguments, by measuring and using the statistical approach of the cardinal processes of
development. On the one hand, by measuring the components of the economic and social
evolution, we will be able to confirm different characteristics of the national economy,
formulated by the historical science until the present moment, and on the other hand we will be
able to highlight new characteristics and aspects of its past which are meant to enrich its image;
at the same time they will invalidate certain opinions of the same nature, which, in time, have
become opinionated in the interpretation of the stage, level or profile of the national economy
development.
We believe that it is equally important that in international statistics, through the data
series of the Romanian GDP, provided by this paper for a period of 150 years, could be
complemented on long periods of time, and substituting the uncertain data, not always
confirmed. Therefore, the series of the gross domestic product indicators, especially during the
second half of the 19th century, until the first half of the 20th century, will be able to introduce
Romania in the international retrospective statistics, for knowledge and comparison.
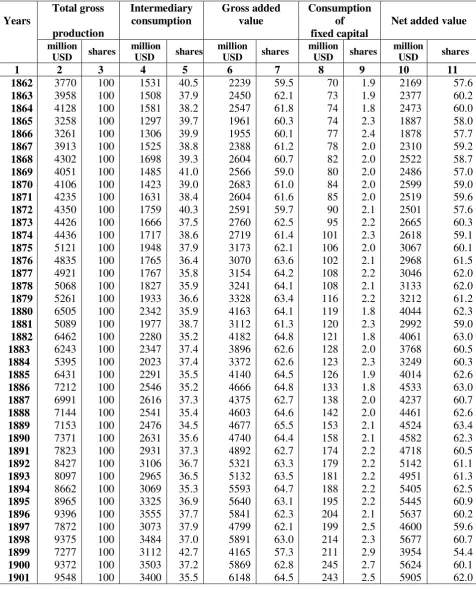
The indicators of section A, of the entire project, which are presented in further 21statistical tables – A 1-A 21, are generally presented in absolute values: millions of USD PPP
The groups of indicators which were selected in order to present in the best possible
manner, the trends of the economy’s evolution by means of the global outcome aggregate, are
presented in the beginning through tables A 1 and A 2; the gross domestic product expressed in
million USD, USD per capita and per employed capita, and indexes, on series of averages of
the years and succesive annual series of the period 1862-2010; they represent the most focused
measurement of the evolution of added values produced by the entire social and economic
activity of the country; the global indicator is at the beginning of the statistical tables which
follow: the elements of the basic equation for determining the gross added value are presented:
production, intermediary consumption and the gross added value as the final result of the
economic activities; for more detailed analyses which are necessary for our subsequent
calculations in order to determine the indicators, the gross domestic product, the net domestic
product - respectively the national income, the gross added value indicator was broken down in
consumption of fixed capital and net added value.
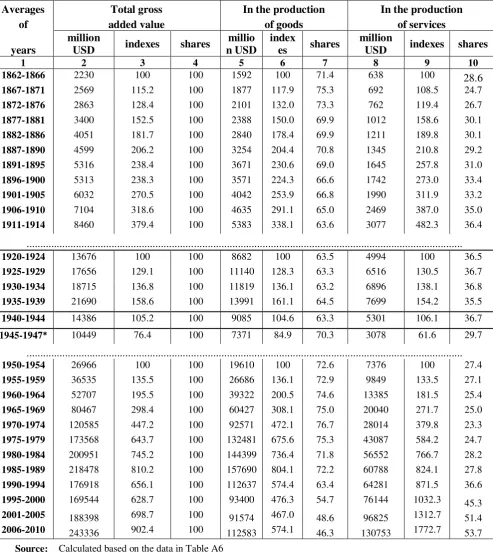
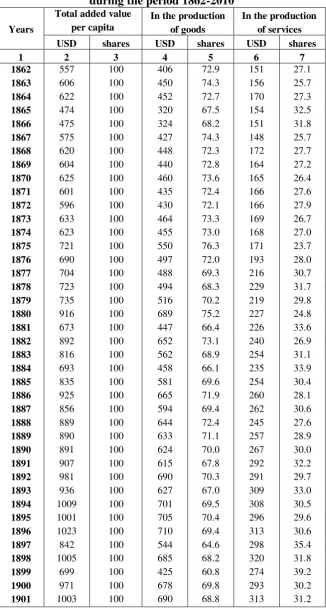
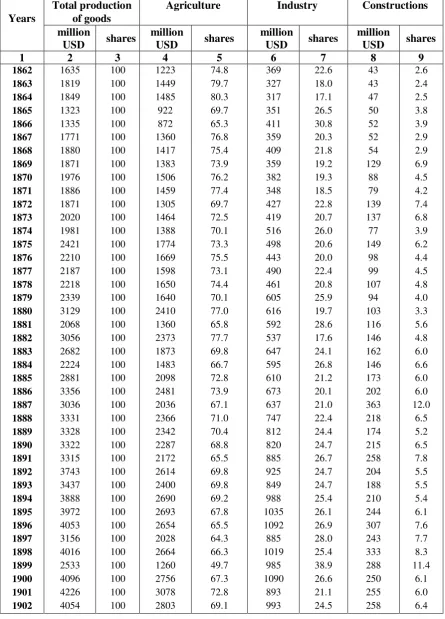
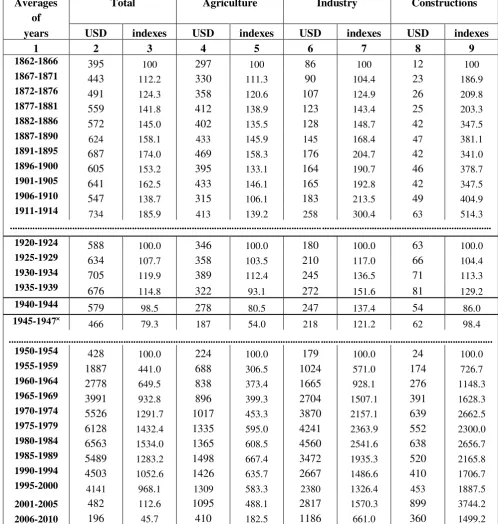
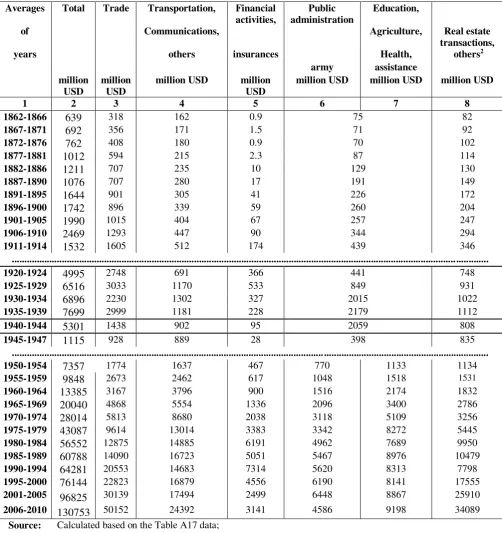
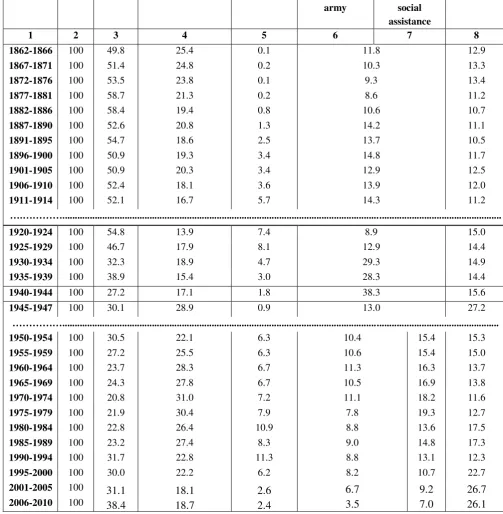
It follows tables presenting the statistical series of the gross added value according to
the two sectors - production of goods and production of services, averages of the years and
annual series, as well as the structure of the above mentioned components, as shares in the total
added value by following the same parameters; this group of statistical situations highlights the
contribution of the two fundamental categories of resources in the total gross added value and
the trends which are significant for changing the ratio between them, as a reflection of the
transformations which took place in the Romanian economy and society, during the reference
period; the following groups of statistical tables present, in accordance with the same structure
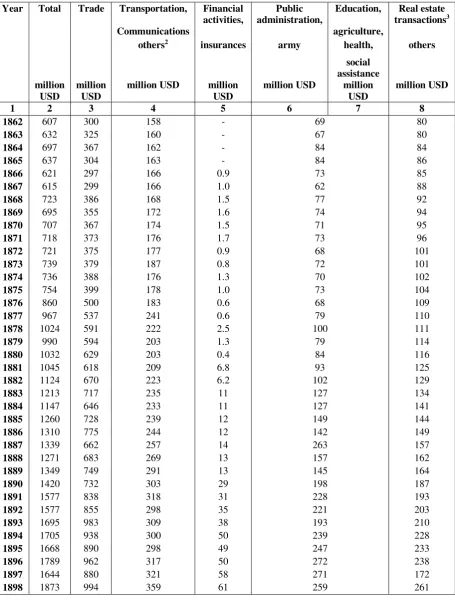
and purpose, the components of the gross added value of the production of goods by branches:
agriculture, industry and constructions, as well as of the services activities by branches:
transportation and communications; commerce; financial activities and insurances; public
administration, defence; education, culture, health, social assistance; real estate transactions,
others; in accordance with the classification of the national accounts.
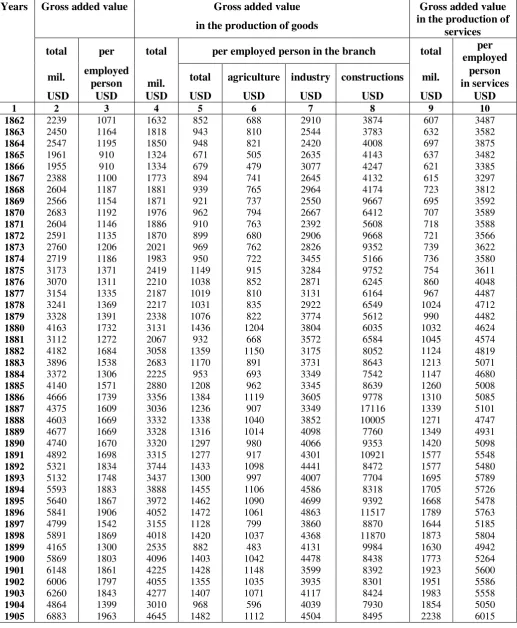
Two groups of statistical situations, following the same time and value parameters,
present the series of the gross added value in the two sectors - of production of goods and
production of services in relation to the number of inhabitants and employed inhabitants.
Dividing the gross added value to the number of persons employed in the production of goods
in a sector - agriculture, industry and constructions - on the one hand and services on the other
hand, highlight for the first time in the historical research of global indicators in Romania, the
level of efficiency, the labor productivity, in the main sectors of the economy on long term;
aspects, of high scientific value, not only from the quantitative perspective but also from the
qualitative one, of economic and social evaluation.
Dividing the GDP to the number of inhabitants shows the absolute level of created
value, per unit of population and it is easy to represent and understand, including international
comparisons. The GDP per capita or employed person shows the qualitative side of the
aggregate, and the measured outcome of the value producer, namely the productivity and labor
force efficiency per unit. In accordance with this indicator, in a century and a half, as the
national economy moved from manual labor and technique, the assimilation of automation,
modern technique and technology and the industrialization of the economy, in 2010 the GDP
per employed person, expressed in comparable monetary values, was 27 times higher than in
the initial calculation year 1862 (Table A 2, column 6).
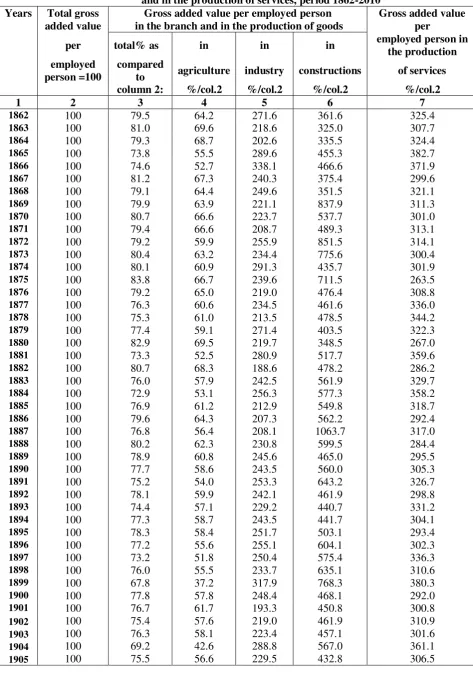
In order to have a general view of the gross added value per person employed in the
production of goods and services, we have developed, based on table A 14, a genuine statistical
situation. This shows, in comparable dollars, per capita employed in a sector, the production of
gross added value in six selected years of the period 1862-2010 and the magnitude of the
amounts.
Gross added value per employed person in the branch -
in the production of goods and services, in USD 2000 and coefficients, selected years in the period 1862-2010
Years
Total average
gross
Gross added value in the production of goods Gross
added value per employed person in the branch added value
per
in the production
employed
person total agriculture industry constructions of services
no. of years
USD DC USD DC USD DC USD DC USD DC USD DC
1 2 3 4 5 6 7 8 9 10 11 12 13 14
1862 1 1071 1.0 852 1.0 688 1.0 2910 1.0 3874 1.0 3487 1.0
c.comp 1.0 0.8 0.64 2.72 3.63 3.26
1912 50 2206 2.1 1585 1.9 985 1.4 6398 2.2 11537 3.0 7235 2.1
c.comp 1.0 0.72 0.45 2.90 5.23 3.28
1938 76 1903 1.8 1427 1.7 828 1.2 6413 2.3 16189 4.2 5011 1.4
c.comp 1.0 0.75 0.44 3.37 8.59 2.63
1960 99 4794 4.5 4211 4.9 2233 3.2 11846 4.1 7108 1.8 8247 2.4
c.comp 1.0 0.88 0.47 2.47 1.48 1.73
1990 128 18376 17.2 18225 21.4 14662 21.3 21384 7.3 16176 4.2 18773 5.4
c.comp 1.0 0.99 0.80 1.16 0.88 1.02
2010 149 28891 27.0 24596 28.9 9845 14.3 40494 13.9 38036 9.8 34669 9.9
c.comp 1.0 0.85 0.35 1.48 1.32 1.20
Source: Calculated based on table A 14
The purpose of our research is not the analysis, for which we will suggest only certain
statistical “surprises” that the researches in the field din not highlight and comment, although
they are very important for the economic science, especially on a secular basis. We would like
to signal the ratio between the gross added value and the gross added value per employed
person in the branches of material production - agriculture, industry and constructions, as well
in the production of services in the selected years; the indicators are unexpectedly varied in size
and proportion. For a better understanding we used coefficients instead of percentages, both for
comparing c.comp horizontally as well as for the dynamic - DC - vertically. Thus, in the first
year, 1862, the gross added value per employed person as compared to the economy’s average,
1071 USD - in the production of goods was of 852 USD, and for services it was of 3874 USD,
3.3 times higher.
The secular examination of the components of social production, for the Romanian
economy, that started the development, initially, from an agrarian structure mainly for
self-consumption, highlights, due to the size, the structure and the modification of the trends of all
mentioned indicators, the radical changes following the modernization and development of the
country.
If the gross production factor, in the context of the calculation of the newly created
value has the meaning of the basic term, in the long term approaches, as total value of
production and services, by comparing its size, the total and per capita evolution, and its
structure, by branches-resources, this indicator can acquire high analytical importance; the
social production size of the country for certain periods of time, in terms of total values and per
capita, as an expression of valorizing the potential of the national economy, as well as different
Table A 1 Total gross domestic product, per capita and per employed person,
in USD PPP 2000 and indexes, averages of the years¹, 1862-2010
Averages of the years
Gross domestic product
total per capita
per employed person million
USD indexes USD indexes USD indexes
1 2 3 4 5 6 7
1862-1866 2261 100 554 100 1064 100 1867-1871 2540 112.3 598 107.9 1143 107.4
1872-1876 2926 129.4 667 120.4 1269 119.3
1877-1881 3492 154.4 770 139.0 1458 137.0
1882-1886 4185 185.1 860 155.2 1619 152.2
1887-1890 4775 211.2 915 165.3 1717 161.4
1891-1895 5582 246.9 1015 183.2 1896 178.2
1896-1900 5599 247.6 954 172.2 1774 166.7
1901-1905 6298 278.5 998 180.1 1850 173.9
1906-1910 7411 327.8 1094 197.5 2014 189.3
1911-1914 8829 390.5 1202 217.0 2206 207.3
……….... 1920-1924 14351 100 896 100 1534 100 1925-1929 18365 128.0 1070 119.4 1831 119.4
1930-1934 19424 135.3 1054 117.6 1807 117.8
1935-1939 22338 155.7 1144 127.7 1958 127.6
1940-1944 14873 103.6 1103 123.1 1878 122.4
1945-1947³ 10621 37.4 672 39.5 1080 70.4
..………... 1950-1954 28375 100 1700 100 3233 100 1955-1959 39869 140.5 2241 131.8 4220 130.5
1960-1964 55653 196.1 2977 175.1 5808 179.6
1965-1969 84700 298.5 4350 255.9 8620 266.6
1970-1974 129653 456.9 6270 368.8 12976 401.4
1975-1979 179123 631.3 8214 486.1 17465 540.2
1980-1984 211036 744.0 9401 553.0 20242 626.1
1985-1989 234305 826.0 10216 601.0 21811 674.6
1990-1994 182433 643.0 7950 467.6 17474 540.5
1995-2000 183595 647.0 8145 479.0 20496 634.0
2001-2005 211147 744.1 9685 569.1 25263 781.4
2006-2010 273438 963.7 12716 747.9 32027 990.6 Source: Autor’s calculations based on the data in table A2
Notes: 1 Calculated based on the data in table A2
2 The horizontal lines are continuous during the period which marks the
territory changes, respectively Romania’s changes in potential; the non-continuous lines show the of data for certain years.
Table A 2 Total gross domestic product, per capita and per employed person,
in USD PPP 2000 and indexes, annual series, 1862-2010
Years
Gross domestic product
total per capita
per employed person million
USD indexes USD indexes
1 USD indexes1
1 2 3 4 5 6 7
1862 2264 100 563 100 1083 100
1863 2479 109.5 613 108.9 1177 108.7
1864 2577 113.8 630 111.9 1208 111.5
1865 1997 88.2 483 85.8 926 85.5
1866 1987 87.8 483 85.8 925 85.4
1867 2431 107.4 585 103.9 1120 103.4
1868 2652 117.1 632 112.3 1209 111.6
1869 2429 107.3 572 101.6 1092 100.8
1870 2539 112.2 591 105.0 1128 104.2
1871 2648 117.0 611 108.5 1165 107.6
1872 2653 117.2 610 108.3 1162 107.3
1873 2823 124.7 648 115.1 1233 113.9
1874 2784 123.0 638 113.3 1214 112.1
1875 3237 143.0 736 130.7 1398 129.1
1876 3132 138.3 704 125.0 1337 123.5
1877 3227 142.5 720 127.9 1366 126.1
1878 3331 147.1 743 132.0 1406 129.8
1879 3413 150.8 754 133.9 1426 131.7
1880 4264 188.3 938 166.6 1773 163.7
1881 3224 142.4 697 123.8 1317 121.6
1882 4297 189.8 917 162.9 1729 159.6
1883 4029 178.0 844 149.9 1590 146.8
1884 3494 154.3 719 127.7 1353 124.9
1885 4281 189.1 863 153.3 1624 150.0
1886 4822 213.0 956 169.8 1797 165.9
1887 4543 200.6 889 157.9 1670 154.2
1888 4778 211.1 923 163.9 1732 159.9
1889 4854 214.4 923 163.9 1731 159.8
1890 4926 217.6 926 164.5 1735 160.2
1891 5118 226.0 949 168.6 1776 164.0
1892 5564 245.7 1026 182.2 1917 177.0
1893 5434 240.0 991 176.0 1850 170.8
1894 5872 259.4 1059 188.1 1977 182.5
1895 5921 261.5 1051 186.7 1959 180.9
1896 6129 270.7 1073 190.6 2000 184.7
1897 5161 228.0 891 158.3 1657 153.0
1898 6223 274.9 1061 188.5 1974 182.3
1899 4397 194.2 738 131.1 1371 126.6
Years
Gross domestic product
total per capita
per employed
person
million
USD indexes USD indexes1 USD indexes1
1 2 3 4 5 6 7
1901 6412 283.2 1047 186.0 1941 179.2
1902 6293 278.0 1016 180.5 1883 173.9
1903 6522 288.1 1037 184.2 1919 177.2
1904 5101 225.3 786 139.6 1466 135.4
1905 7161 316.3 1105 196.3 2041 188.5
1906 7818 345.3 1187 210.8 2191 202.3
1907 6402 282.8 958 170.2 1764 162.9
1908 6971 307.9 1030 182.9 1896 175.1
1909 6935 306.3 1010 179.4 1861 171.8
1910 8931 394.5 1282 227.7 2357 217.6
1911 8824 389.8 1245 221.1 2286 211.1
1912 9088 401.4 1256 223.1 2304 212.7
1913 9211 406.8 1253 222.6 2298 212.2
1914 8192 361.8 1054 187.2 1935 178.7
………...
1920 11826 100 761 100 1302 100
1921 12960 109.6 824 108.3 1410 108.3
1922 14638 123.8 917 120.5 1569 120.5
1923 16039 135.6 990 130.1 1694 130.1
1924 16290 137.7 991 130.2 1696 130.3
1925 16660 140.9 998 131.1 1709 131.3
1926 18472 156.2 1091 143.4 1868 143.5
1927 18671 157.9 1089 143.1 1864 143.2
1928 18372 155.4 1056 138.8 1808 138.9
1929 19650 166.2 1114 146.4 1907 146.5
1930 19811 167.5 1097 144.2 1896 145.6
1931 20272 171.4 1116 146.6 1910 146.7
1932 18623 157.5 1011 132.9 1730 132.9
1933 18981 160.5 1018 133.8 1742 133.8
1934 19433 164.3 1027 135.0 1759 135.1
1935 21039 177.9 1102 144.8 1887 144.9
1936 21892 185.1 1133 148.9 1940 149.0
1937 22910 193.7 1173 154.1 2008 154.2
1938 22654 191.6 1147 150.7 1963 150.8
1939 23197 196.2 1164 153.0 1991 152.9
1940 15038 127.2 1131 148.6 1938 148.8
1941 15533 131.3 1164 153.0 1962 150.7
1942 14512 122.7 1076 141.4 1826 140.2
1943 16631 140.6 1219 160.2 2086 160.2
1944 12649 107.0 923 121.3 1580 121.4
1945 9863 83.4 627 82.4 1007 77.3
1946 9647 81.6 611 80.3 982 75.4
1947 12352 104.4 777 102.1 1252 96.2
Years
Gross domestic product
total per capita
per employed person million
USD indexes USD indexes
1 USD indexes1
1 2 3 4 5 6 7
1950² 21897 100 1342 100 2613 100
1951 28059 128.1 1704 127.0 3265 125.0
1952 27979 127.8 1682 125.3 3230 123.6
1953 31523 144.0 1871 139.4 3511 134.4
1954 32419 148.1 1899 141.5 3544 135.6
1955 40099 183.1 2315 172.5 4282 163.9
1956 34884 159.3 1994 148.6 3672 140.5
1957 41495 189.5 2327 173.4 4407 168.7
1958 38947 177.9 2157 160.7 4111 157.3
1959 43921 200.6 2410 179.6 4629 177.2
1960 48168 220.0 2617 195.0 5050 193.3
1961 52238 238.6 2813 209.6 5479 209.7
1962 54096 247.0 2896 215.8 5647 216.1
1963 58988 269.4 3135 233.6 6142 235.1
1964 64774 295.8 3422 255.0 6720 257.2
1965 70122 320.2 3685 274.6 7241 277.1
1966 78007 356.2 4075 303.7 7971 305.1
1967 85570 390.8 4437 330.6 8683 332.3
1968 91988 420.1 4664 347.5 9320 356.7
1969 97815 446.7 4888 364.2 9885 378.3
1970 107592 491.4 5312 395.8 10842 414.9
1971 115570 527.8 5646 420.7 11627 445.0
1972 130348 595.3 6308 470.0 13072 500.3
1973 146695 669.9 7043 524.8 14638 560.2
1974 148062 676.2 7041 524.7 14703 562.7
1975 151409 691.5 7127 531.1 14915 570.8
1976 168205 768.2 7843 584.4 16447 629.4
1977 178309 814.3 8233 613.5 17372 664.8
1978 194780 889.5 8912 664.1 18929 724.4
1979² 202913 926.7 8957 667.4 19662 752.5
1980 198465 906.4 8939 666.1 19175 733.8
1981 198606 907.0 8885 662.1 19140 732.5
1982 206650 943.7 9194 685.1 19816 758.4
1983 219220 1001.1 9720 724.3 20961 802.2
1984 232237 1060.6 10265 764.9 22117 846.4
1985 232024 1059.6 10211 760.9 21918 838.8
1986 237399 1084.2 10402 775.1 22249 851.5
1987 239415 1093.4 10437 777.7 22335 854.8
1988 238305 1088.3 10337 770.3 22055 844.0
1989 224380 1024.7 9692 722.2 20498 784.5
1990 211813 967.3 9127 680.1 19539 747.8
1991 184409 842.2 7954 592.7 17097 654.3
1992 168096 767.7 7376 549.6 16073 615.1
1993 170599 779.1 7497 558.6 16954 648.8
Years
Gross domestic product
total per capita
per employed person million
USD indexes USD indexes1 USD indexes1
1 2 3 4 5 6 7
1994 177249 809.5 7798 581.1 17705 677.6
1995 189867 867.1 8371 623.8 20011 765.8
1996 197436 901.7 8733 650.7 21051 805.6
1997 185390 846.6 8223 612.7 20546 786.3
1998 176530 806.2 7845 584.6 20031 766.6
1999 174372 796.3 7764 578.5 20709 792.5
2000 177973 812.8 7933 591.1 20625 789.3
2001 187940 858.3 8387 625.0 21948 840.0
2002 197728 903.0 9120 679.6 23740 908.5
2003 208584 952.6 9598 715.2 25124 961.5
2004 226026 1032.2 10429 777.1 27437 1050.0
2005 235458 1075.3 10889 811.4 28064 1074.0
2006 254501 1162.3 11791 878.6 30086 1151.4
2007 271943 1241.9 12627 940.9 31165 1192.7
2008 294901 1346.8 13714 1021.9 33715 1290.3
2009 274078 1251.7 12766 951.3 32586 1247.1
2010 271765 1241.1 12681 944.9 32582 1246.9
Source: Calculated based on the data from sections B, C, D and the number of inhabitants and employed
population.
1 The GDP per capita was kept with the previous base, reflecting faithfully the dynamic of the indicator regardless
of the territorial changes that also proportionally modified the number of the population.
2 The modalities of calculating the GDP, as shown in the introduction for the three consecutive periods: 1862-1947,
1950-1979 and 1980-2010 were different; the data of the connection and comparison years seem to be relatively normal, logical, which confirms the accuracy and suitability of the applied methods and techniques. Therefore in the first part of the series, 1862-1947 and in the second part 1950-2010, threshold, 1938 and 1950. The GDP per capita in 1950 was of 1342 USD, a value close to 1938 of 1147 USD. The difference additional to 1938 seems to be acceptable after an interval of 12 years and does not hamper the development and compatibility of the GDP series. The second moment of connection is between the periods 1950-1979 and 1980-2010, calculated based on different methods, when the border between 1979 and 1980 registers a minor difference of the GDP per capita: 1979 – 8957 USD, and the year - 8939 USD PPP 2000. Therefore, the entire series of the GDP 1862-2010 is continuous and comparable, of course with the reserves mentioned in the calculations made during the research.
Table A 3
Gross production by components - intermediary consumption, gross added value, fixed capital consumption, net added value - in USD PPP 2000 and structure,
averages of the years, 1862-2010
Averages Gross production
Intermediary consumption
Gross added value
Consumption of
Net added value
of fixed capital
years
million
USD shares
million
USD shares
million
USD shares
million
USD shares
million
USD shares
1 2 3 4 5 6 7 8 9 10 11
1862-1866 3675 100 1445 39.3 2230 60.7 74 2.0 2157 58.7
1867-1871 4121 100 1552 37.7 2569 62.3 82 2.0 2487 60.3
1872-1876 4634 100 1771 38.2 2863 61.8 99 2.1 2764 59.6
1877-1881 5369 100 1969 36.7 3400 63.3 114 2.1 3285 61.2
1882-1886 6349 100 2297 36.2 4051 63.8 126 2.0 3925 61.8
1887-1890 7165 100 2566 35.8 4599 64.2 148 2.1 4451 62.1
1891-1895 8395 100 3079 36.7 5316 63.3 183 2.2 5132 61.1
1896-1900 8658 100 3345 38.6 5313 61.4 215 2.5 5098 58.9
1901-1905 9595 100 3563 37.1 6032 62.9 256 2.7 5777 60.2
1906-1910 11517 100 4413 38.3 7104 61.7 319 2.8 6785 58.9
1911-1914 13777 100 5317 38.6 8460 61.4 463 3.4 7997 58.0 ...
1920-1924 23544 100 9868 41.9 13676 58.1 701 3.0 12975 55.1
1925-1929 31253 100 13597 43.5 17656 56.5 1042 3.3 16613 53.2
1930-1934 32548 100 13833 42.5 18715 57.5 1185 3.6 17529 53.9
1935-1939 38500 100 16810 43.7 21690 56.3 1568 4.1 20122 52.3
1940-1944 26491 100 12105 45.7 14386 54.3 1238 4.7 13149 49.6
1945-1947 19265 100 8816 45.8 10449 54.2 1131 5.9 9318 48.4 ...
1950-1954 45908 100 18941 41.3 26966 58.7 3244 7.1 23723 51.7
1955-1959 64945 100 28410 43.7 36535 56.3 4677 7.2 31858 49.1
1960-1964 103577 100 50870 49.1 52707 50.9 6893 6.7 45814 44.2
1965-1969 161961 100 81493 50.3 80467 49.7 10697 6.6 69770 43.1
1970-1974 256840 100 136255 53.1 120585 46.9 13319 5.2 107266 41.8
1975-1979 386470 100 212901 55.1 173568 44.9 16415 4.2 157153 40.7
1980-1984 518216 100 317265 61.2 200951 38.8 26028 5.0 174923 33.8
1985-1989 643523 100 425045 66.0 218478 34.0 34702 5.4 183776 28.6
1990-1994 442490 100 265572 60.0 176918 40.0 20034 4.5 156884 35.5
1995-2000 383522 100 213979 55.8 169544 44.2 20162 5.3 149382 39.0
2001-2005 408224 100 219826 53.8 188398 46.2 23051 5.6 165347 40.5
2006-2010 526271 100 282935 53.8 243336 46.2 29367 5.6 213969 40.7 Source: Calculated based on the data in table A 4