Explaining the labor share: automation
vs labor market institutions
Guimarães, Luis and Gil, Pedro
Queen’s University Belfast and cef.up, Faculdade de Economia,
Universidade do Porto, and cef.up
20 January 2019
A
UTOMATION
V
S
L
ABOR
M
ARKET
I
NSTITUTIONS
L
U´
ISG
UIMARAES˜
†& P
EDROM
AZEDAG
IL‡May 28, 2019
Abstract
We propose a simple model to assess the evolution of the US labor share and how automation
af-fects employment. In our model, heterogeneous firms may choose a manual technology and hire a
worker subject to matching frictions. Alternatively, they may choose an automated technology and
produce using only machines (robots). Our model offers three main insights. First,
automation-augmenting shocks reduce the labor share but increase employment and wages. Second, labor
market institutions play an almost insignificant role in explaining the labor share. Third, the US
la-bor share only (clearly) fell after 1987 because of a contemporaneous acceleration of automation’s
productivity.
JEL classification:E24; J64; L11; O33.
Keywords:Automation; Labor Share; Technology Choice; Employment; Matching Frictions.
∗We thank Alper C¸ enesiz, Bruno Decreuse, Alan Fernihough, Jakub Growiec, Maurizio Iacopetta, Duarte Leite, Joseba
Martinez, Klaus Prettner, and Shu Lin Wee for valuable comments and suggestions. We also thank conference participants at the 9thSaM Annual Conference and at the 2ndCatalan Economic Society Conference as well as seminar participants at
the University of Porto. This research has been financed by the European Regional Development Fund through COMPETE 2020 Programa Operacional Competitividade e Internacionalizac¸˜ao (POCI) and by Portuguese public funds through FCT (Fundac¸˜ao para a Ciˆencia e a Tecnologia) in the framework of the project POCI-01-0145-FEDER-006890 (cef.up – Center for Economics and Finance at University of Porto).
†Queen’s University Belfast and cef.up. E-mail address:l.guimaraes@qub.ac.uk.
1
Introduction
1.1 Motivation & Contribution
The stationarity of the labor share of aggregate income was a celebrated stylized fact of the 20th
cen-tury: although new technologies were continuously introduced, the labor share apparently fluctuated
around the same level (Kaldor,1961; Jones and Romer,2010). Yet, starting at the late 20th century,
a number of authors questioned this stylized fact and pointed out the decline of the labor share in
developed countries including the US. More recently, new empirical evidence has suggested a
sus-tained downward trend of the labor share in a wider range of countries, including both advanced and
developing countries.1
In light of the overwhelming evidence of a downward trend in the labor share, the literature shifted
towards understanding its causes. Two prominent groups emerged within this literature. One group
has focused on how technological change and the technological structure of the economy may affect
the labor share. Namely, this group has emphasized the roles of automation (e.g.,Acemoglu and
Re-strepo,2018), robot- or automation-augmenting technological change (e.g., Berg, Buffie and Zanna,
2018), falling price of capital (e.g.,Karabarbounis and Neiman,2014), and the emergence of superstar
firms together with overhead labor costs (e.g.,Autor et al.,2017b).2 Another group has analyzed the
role of labor market institutions and their potential interaction with the technological structure of the
economy. In these theories, either the shock emerges in the labor market (e.g.,Caballero and
Ham-mour,1998), or the presence of labor market institutions is crucial for the transmission mechanism
of technological shocks (e.g.,Hornstein, Krusell and Violante,2007).3 Our paper belongs to the
sec-1For earlier contributions questioning the stationarity of the labor share, see,e.g.,Blanchard(1997),Caballero and
Ham-mour(1998),Berthold, Fehn and Thode(2002),Jones(2003), andBentolila and Saint-Paul(2003). For more recent contribu-tions, see,e.g.,Bental and Demougin(2010),Elsby, Hobijn and S¸ahin(2013),Karabarbounis and Neiman(2014),Oberfield and Raval(2014),Autor et al.(2017b), andDao et al.(2017).
2See, as well,Zeira(1998,2010),Peretto and Seater(2013),Prettner and Strulik(2017),Martinez(2018),Hopenhayn, Neira
and Singhania(2018), andLe´on-Ledesma and Satchi(2019).
ond group, but instead of analyzing how one particular shock shrinks the labor share, we assess which
shocks are better candidates to explain the fall in the US labor share. Namely, we build a model with
matching frictions to contrast the role of technological factors (automation-augmenting
technolog-ical change and falling price of capital) with the role of changes in labor market institutions (falling
workers’ bargaining power and decreasing flows in the labor market). We conclude that the fall in the
US labor share was most likely caused by technological factors.
Parallel to this debate, the observed increasing substitutability of machines for workers has raised
concerns that machines will make labor redundant and eventually terminate employment (Acemoglu
and Restrepo,2018). Yet, so far, the empirical results indicate that technological shocks (either TFP or
routine-replacing specific) have not been employment-displacing at the aggregate level in developed
economies (Autor and Salomons,2018andGregory, Salomons and Zierahn,2018). Different models
that allow for a fall in the labor share are unable to simultaneously generate an increase in
employ-ment (e.g., Zeira,1998; Caballero and Hammour, 1998; Acemoglu and Restrepo, 2018). In contrast,
our model concurs with the evidence: an automation-augmenting shock reduces the labor share but
increases both employment and wages.
Our paper further contributes to the literature in two other ways because of its different approach.
First, we propose a rather simple model that extends the canonical Diamond-Mortensen-Pissarides
(DMP) model (similar toPissarides, 2000, Ch.1). In our model, heterogeneous firms may choose a
manual technology and behave as in the DMP model. Alternatively, they may choose an automated
technology and produce using only machines (robots). The canonical DMP model cannot assess the
effects of automation. But our simple extension can by only adding one equation to the canonical
model. Although the simplicity of our model naturally forced us to abstract from many ingredients,
our approach comes with the benefits of analytical tractability and the ensuing clarity of the
nisms at play in the model. Furthermore, many of the insights of our model find support in empirical
evidence. Second, most of the contributions in the literature build and adapt growth models. We, on
the other hand, build a model with matching frictions to properly distinguish how changes in labor
market institutions and in technology affect the labor share. Thus, our model offers a different
per-spective on the effects of automation and the evolution of the labor share by bringing the workhorse
model of the labor market (DMP model) to the center of the discussion.
1.2 Summary of the Model & Results
We build a model of technology choice with matching frictions and the following main features. When
entering the market, and after paying a sunk cost, each firm faces two alternative technologies to
pro-duce output. These technologies are perfect substitutes upon entry: an entrant firm either chooses
the automated technology, which is capital intensive, or the manual technology, which is labor
in-tensive.4 Each technology entails a specific start-up cost. The automated technology only employs
capital, while the manual technology only employs labor and requires each firm to search for a worker
in a labor market characterized by an aggregate matching function and where wages are set by Nash
bargaining. In the model, at the time of entry, firms draw an endowment (or capability) from a known
probability distribution, resembling an undirected technology-search process (as in,e.g., Benhabib,
Perla and Tonetti,2017). Each firm then combines this endowment with either technology (although
with possibly different efficiency levels) to determine its productivity. Depending on the draw of the
endowment, the firm chooses its technology. Under rational expectations, a no-arbitrage and a
free-4Jones and Romer(2010) cite evidence that corroborates that many different technologies are used with widely varying
entry condition must be satisfied. The no-arbitrage condition allows for the derivation of an
endoge-nous threshold,i.e., a cutoff level of the stochastic endowment at which firms are indifferent between
one technology or the other. The free-entry condition establishes a link between the two technologies,
so that a sort of complementarity between them endogenously arises in equilibrium at the aggregate
level.5
Our model paves the way to study how automation affects the labor market in models with
match-ing frictions. The canonical Diamond-Mortensen-Pissarides model allows us to study how labor
mar-ket institutions shape wages (versus output) and employment. Our model preserves the mechanisms
but in a richer context: changes in labor market institutions and productivity shocks propagate in
the economy also through the reallocation of resources between firms that choose to operate under
alternative technologies. In this context, the labor share reflects the influence of institutions and
pro-ductivity on both the average wage level (versus output) and the distribution of firms between the two
technologies (manual versus automated).
In order to inquire into the effects of increasing automation on jobs, we study analytically the
ef-fects of an automation-augmenting technological change in our model. We find that both the average
wage and employment increase as an aggregate-equilibrium result, which is noteworthy given that
manual and automated technologies are ex ante perfect substitutes at the micro level. A rise in the
productivity of machines incentivizes the reallocation of resources from the manual to the automated
technology, displacing labor. Yet, in the aggregate equilibrium of our model, the greater expected value
to open a firm induces a significant rise in the number of firms and output that ultimately outweighs
the labor-displacing effect, increasing employment and wages. Thus, in our model, the aggregate
ef-fect is stronger than the reallocation efef-fect, which agrees with the empirical evidence inAutor and
Salomons(2018) andGregory, Salomons and Zierahn(2018).
5As will be made clear later on, this complementarity arises in the sense that a technological shock that augments one of
As a second step, we calibrate our model to the US economy and compute the simulated
elastic-ities of key macroeconomic variables with respect to multiple parameters of our model. The goal is
to study quantitatively how the output, employment, average wage, and labor share respond to two
broad types of shocks: technological and labor-market shocks. Regarding the former, we distinguish
between automation-augmenting shocks, manual-augmenting shocks and shocks to the relative cost
of capital (in our model, cost of capital versus vacancy costs) (as in,e.g., Hornstein, Krusell and
Vi-olante,2007; Karabarbounis and Neiman,2014;Acemoglu and Restrepo,2018). Regarding the latter
type of shocks, we consider those to the nonemployment income, workers’ bargaining power,
match-ing efficiency, and job destruction rate (as in,e.g.,Caballero and Hammour,1998;Bentolila and
Saint-Paul,2003;Blanchard and Giavazzi,2003;Bental and Demougin,2010).
Two results stand out. First, an automation-augmenting shock increases the average wage and
employment but reduces the labor share. In our model, the labor share falls due to the reallocation of
activity towards the automated technology, which offsets the effect of higher wage and employment.
Yet, the labor share does not fall at the firm level. This result is particularly relevant as it agrees with the
empirical evidence, based on detailed micro data for the US, that points to a (relatively) stable labor
share at the firm level over time (Autor et al., 2017a,b). Second, technological shocks have a much
greater impact on output and the labor share than changes in the labor market institutions (although
the latter have non-neglectable effects on employment). Thus, in light of our model, unless labor
market institutions change massively, technological shocks are the best candidate to explain a fall in
the labor share. All these results agree with recent empirical observations, namely for the US (see,e.g.,
Karabarbounis and Neiman,2014;Autor et al.,2017a,b;Dao et al.,2017;Autor and Salomons,2018).
Finally, we conduct experiments on our model bearing in mind the historical behavior of the US
labor share, which we depict in Figure1for the period 1963-2007. The real wage per worker grew at a
Figure 1: The US Economy: 1963–2007
1963 1969 1975 1981 1987 1993 1999 2005 55
60 65 70 75 80 85
Prime-Age Employment Labor Share
1963 1969 1975 1981 1987 1993 1999 2005 1
1.2 1.4 1.6 1.8 2 2.2 2.4
Output per Worker Wage per Worker
Note:Both panels plot data for the US economy between 1963 and 2007 downloaded from the FRED and the BLS. The panel on the left-hand side plots the employment rate of workers aged 25-54 (prime-age) and the labor share. The vertical axis of this panel measures percentage points. The panel on the right-hand side plots the output and wage per worker in the nonfarm business sector (NBS). Both series are normalized to 1 in 1963, meaning that the vertical axis of this panel measures the ratio of each series relative to its value in 1963. Output per worker is the product of the real output per hour (OPHNFB) and total hours (HOANBS), both in the NBS, divided by the civilian employment level (CE16OV). Wage per worker is the real compensation per hour in the NBS (COMPRNFB) multiplied by total hours in the NBS (HOANBS) and divided by the civilian employment level (CE16OV). This wage is multiplied by the ratio of the Consumer Price Index (CPIAUCSL) over the GDP deflator (GDPDEF).
their growth rates diverge. In other words, the US labor share clearly drops only after the late 1980s
(e.g.,Elsby, Hobijn and S¸ahin,2013). Given this evidence, we focus on two time periods: 1967-1987,
characterized by a relatively stable labor share; and 1987-2007, characterized by a falling labor share.
Our goal is to answer three questions. (i) Can our model account for the fall in the labor share in the
second period? (ii) If yes, what are the forces that our model proposes to explain that fall? (iii) Why
are the two periods different as regards the behavior of the labor share? As a calibration strategy, we
consider shocks to alternative subsets of (technological and/or labor market) parameters by targeting
the growth rate of output and wages in the US data within each 20-year period. Then, we compute
the changes in the labor share and employment implied by our model and compare them with the
changes observed in the data for the same time period.
Concerning the 1987-2007 period, our model performs remarkably well in two experiments: the
cost-of-capital and manual-augmenting shocks. In both cases, the fall in the labor share is extremely
close to that in the data, while the employment rate increases only slightly more. In contrast,
experi-ments that include changes in labor market institutions render disappointing results. As suggested by
recent empirical studies (e.g.,Davis and Haltiwanger,2014;Farber et al.,2018), we consider
combina-tions of shocks that involve shifts in the workers’ bargaining power or in both the job destruction rate
and matching efficiency. These combinations of shocks either increase the labor share or decrease
it at the expense of counterfactual changes in labor market institutions (e.g., a very high increase in
the US labor market flows). We take these results as indicators that the drop in the US labor share
after 1987 was most likely caused by technological changes rather than by changes in the labor market
institutions.
Concerning the 1967-1987 period, our model suggests that the observed change of output and
wages was caused by manual-augmenting shocks, and this is why the labor share did not fall in that
period. Contrasting these results for the 1967-1987 period with those for the 1987-2007 period, then
it becomes clear that the fall after 1987 occurred because of a significant acceleration of
automation-augmentingvis-`a-vismanual-augmenting technological change. This acceleration concurs with the
significant shifts in the task content against labor (and towards automation) after 1987 estimated by
Acemoglu and Restrepo (2019). It also concurs with the VAR evidence inBergholt, Furlanetto and
Faccioli(2019), with recent empirical estimates of capital- vs labor-augmenting coefficients based on
closed-form aggregate-production functions (see,e.g.,Acemoglu and Restrepo,2018, and references
therein) and with direct evidence on the evolution of the stock of industrial robots (Prettner and
1.3 Related Literature
As explained earlier, we lay out a model of technology choice exploiting the idea that, in general, firms
face alternative technologies to produce output, be it a good or a task. The concept of alternative
technologies enters into numerous models in the literature and agrees with the empirical evidence
de-scribed byJones and Romer(2010) and references therein. In several of these models,e.g.,Zeira(1998,
2010),Acemoglu and Zilibotti (2001), Acemoglu(2003),Acemoglu and Restrepo(2018) and Alesina,
Battisti and Zeira(2018), the incentive for a given firm to adopt one technologyvis-`a-visthe other(s)
depends explicitly on a firm-specific exogenous feature. This feature may be interpreted, as in our
model, as a firm’s endowment or capability and determines,ceteris paribus, the firm’s overall
produc-tivity or cost level. A related literature, with a somewhat different approach, allows optimizing agents
to choose the elasticity of output with respect to inputs from a set of known technologies;e.g.,Zuleta
(2008) and Peretto and Seater (2013). Other papers let firms optimally choose the vector of
factor-augmenting coefficients in the production function from a given technology menu;e.g.,Jones(2005),
Caselli and Coleman(2006),Growiec(2008,2013,2017),Fadinger and Mayr(2014), andLe´on-Ledesma
and Satchi(2019).
From the literature above, our paper is closer toZeira(1998, Sec. 7;2010),Alesina, Battisti and Zeira
(2018), andAcemoglu and Restrepo(2018), with whom it shares the simplifying assumption that the
manual technology employs only labor and the automated (or ’industrial’) technology only capital. In
Zeira(1998,2010) andAlesina, Battisti and Zeira(2018), there is a final good produced by a continuum
of tasks. As new machines are made available for task production, they raise workers’ productivity and
wages. But firms respond to higher wages by replacing workers (manual technology) with machines
(‘industrial’ technology) in the tasks with the lower cost of machines. Consequently, these models
labor share. Acemoglu and Restrepo(2018) also devise a model of technology choice and
technolog-ical change where a final good is produced by a continuum of tasks. The authors consider research
activities directed either towards automation of existing tasks (i.e., task production switches from the
manual to the automated technology) or towards the creation of new tasks in which labor has a
com-parative advantage (and, thus, the new task uses the manual technology). While automation reduces
labor supply, the labor share, and possibly wages, the creation of new tasks has the opposite effects.
Depending on the long-run relative cost of the two production technologies (rental rate of capital
ver-sus wages), there may be an equilibrium in which all tasks are automated (and, thus, the labor share
is driven to zero), or one in which both automation and the creation of new tasks coexist (and, thus, a
positive and stable labor share is attained). The latter may occur because automation reduces the cost
of producing with the manual technology, thus discouraging further automation while incentivizing
the creation of new tasks.
The object of study and approach of our paper differ from that inZeira(1998,2010) andAlesina,
Battisti and Zeira (2018). Even though their models provide results on the effects of automation on
the labor share and employment, the authors explore other insights pertaining to different research
questions. In this sense,Acemoglu and Restrepo(2018) is closer to our paper as we share the main
object of study. Yet, becauseAcemoglu and Restrepodo not calibrate their model, they only study the
theoretical conditions under which different results occur. In contrast, our calibration of the model
allows us to offer insights on the evolution of the US labor share and employment since 1967.6
Looking into other strands of the literature, our paper relates to the ‘putty-clay’ model byCaballero
and Hammour(1998) and, along different lines, toHornstein, Krusell and Violante(2007) andBental
6In all these models, the mechanisms rely on an aggregate production function for the final good, which ultimately
and Demougin(2010). Our paper relates toCaballero and Hammouras this paper addresses the issue
of the labor share and explicitly considers a form of labor market frictions. In their model, labor can
appropriate capital due to the relationship-specificity of capital and limited precontracting
possibili-ties, which are influenced by,e.g., the strength of the workers’ bargaining position and by firing costs.
In the short run, appropriation shocks (due to,e.g., higher capital-specificity or firing costs) increase
wages and the labor share. But these shocks also motivate firms to reduce their exposure to future
ap-propriation by decreasing the labor-intensity of new production units. In the long run, firms reduce
hiring, thereby reducing employment, the average wage, and the labor share. These patterns agree
very neatly with the evolution of the French economy in 1967-1995, which is the object of study of
Caballero and Hammour.
Hornstein, Krusell and Violante(2007) develop a model with (standard) labor market frictions and
vintage capital. In their model, production requires matching one machine (capital) of a given vintage
with one worker to yield a homogeneous output good. But capital-embodied technological change
renders each vintage obsolete and eventually breaks the existing machine-worker match. The authors
show that an acceleration of capital-embodied technological change accelerates capital scrapping and
reduces firms’ incentives to create new jobs. This, in turn, shapes labor-market outcomes, yielding an
increase in the level and duration of unemployment, thereby reducing the employment rate and the
labor share. More recently, as a variation on the topic,Bental and Demougin(2010) explore the
rela-tionship between technology and labor market frictions in a model in which the worker-firm relations
are characterized by moral hazard, the allocation of bargaining power between firms and workers is
endogenous, and firms’ investment is irreversible. They focus, in particular, on ICT shocks that
en-hance the effectiveness of the monitoring technology, reducing the moral hazard problem. In their
model, these shocks lower the workers’ bargaining power and, thereby, decrease the wages per
The mechanism in our model is closer to the one inCaballero and Hammour(1998) than to those
inHornstein, Krusell and Violante(2007) andBental and Demougin(2010), inasmuch as the former
al-lows for changes in the labor share reflecting shifts in technology choice (in their case, a change in the
labor-intensity of new production units) as a reaction to given exogenous shocks. Such a mechanism
resembles the reallocation between manual and automated technologies in our model. But differently
from the models in these three papers and also the models inZeira(1998,2010) andAcemoglu and
Restrepo(2018), our model generates simultaneously a fall in the labor share and an increase in the
average wage and employment. Therefore, our model offers a better fit to the observed dynamics of
the US economy.
Also related to our model,Cords and Prettner(2019) develop a model with automation and
match-ing frictions. In their model, an aggregate production function combines high- and low-skill labor with
both traditional physical capital and automation capital (e.g., robots). Physical capital complements
both skill types but automation capital is a perfect substitute for low-skill labor and an imperfect
sub-stitute for high-skill labor. Cords and Prettneruse this model to study how shifts in the stock of
au-tomation capital differently affect the unemployment and wages of the two types of labor. Yet, they do
not focus on the behavior of the labor share and calibrate their model to the German economy.
Other contributions in the literature focus on alternative mechanisms to explain the shifts in the
labor share. In particular, these contributions exploit the interplay between an aggregate CES
pro-duction function and, namely, factor-augmenting technical progress, the relative price of investment
goods, structural change, or increases in market power (e.g., Acemoglu, 2003; Karabarbounis and
Neiman, 2014; Alvarez-Cuadrado, Long and Poschke, 2018; Berg, Buffie and Zanna, 2018;
Eggerts-son, Robbins and Wold,2018; Growiec, McAdam and Muck,2018). We emphasize, in particular, the
results inBerg, Buffie and Zanna. The authors simulate their model so that the economy moves from
robot-augmenting factor. Output per capita rises considerably while the strong induced accumulation of
the non-robot capital guarantees that overall labor demand and the real wage increase in the long
run, while the labor share falls. These results are all consistent with the results in our model
follow-ing an acceleration of the automation-augmentfollow-ing factor. The results of this literature (as well as of
Cords and Prettner, 2019), however, hinge crucially on the considered magnitude of the elasticity of
substitution between labor and capital (or robots).
Finally, our approach is very much in the spirit of the inter-firm reallocation mechanism analyzed
byAutor et al.(2017b, App. A).Autor et al. develop a partial-equilibrium model of an industry where
firms have heterogeneous (constant) total factor productivity and there is imperfect competition in
the product market. Each firm produces output using physical capital and (variable) labor under a
Cobb-Douglas technology, while putting up a fixed cost measured as overhead labor. There is free
entry and, upon entry, firms take an idiosyncratic productivity draw. The authors show that the firms
with bigger productivity draws (“the superstar firms”) are larger as they produce more efficiently and
capture a higher share of industry output. These firms also have a lower share of fixed costs in
to-tal revenues and, thus, a lower labor share, in line with the authors’ empirical results. When there
is an exogenous change (e.g., a globalization or a technological shock) that favors the most
produc-tive (larger) firms, the aggregate labor share falls as the economic activity shifts towards these low
labor-share firms.7 Similarly, in our model, the labor share mainly shifts because heterogeneous firms
reallocate activity towards those that are capital-intensive. Yet, our mechanism differs from the one
inAutor et al.(2017b, App. A) in important aspects. Our paper expresses the negative relationship
between firm size and the labor share by making explicit the choice between manual and automated
technologies by heterogenous firms, where the former entails search and matching costs in the
la-7Hopenhayn, Neira and Singhania(2018) offer a similar mechanism. They develop a dynamic model of heterogeneous
bor market while the latter only entails a fixed start-up cost. Therefore, our model allows us to take a
detailed look into the interplay between technology choice, labor market frictions, and labor market
outcomes (including the labor share), while emphasizing the reallocation mechanism.
The remainder of this paper is organized as follows. Section2details our model. Section3studies
analytically how an automation-augmenting shock affects employment and wages. Section4lays out
the results of our quantitative exercises. In particular, this section presents the simulated elasticities of
our model and the results of our targeted experiments to the periods 1967-1987 and 1987-2007.
Sec-tion5discusses how alternative assumptions affect our results. First, this section shows that, although
changes in labor market institutions do not seem to explain the evolution of the US labor share, our
model requires labor market institutions (in particular, wage bargaining) to fit the US evidence after
1967. Second, it shows that if entry costs are proportional to output, our model continues to point to
the acceleration of automation-augmenting technological change to explain the fall in the US labor
share only after 1987. Third, it shows that if the cutoff between technologies in our model is
techno-logically constrained, our model continues to suggest that an automation-augmenting shock raises
employment. Section6concludes the paper.
2
The Model
Our model extends the DMP model set in discrete time as in,e.g.,Ljungqvist and Sargent(2018, Ch.
29)]. In our model, firms pay an entry cost Ωto enter the market and draw a productivity z from a
distributionG(z)of productivity levels over the interval[zmin,∞).8 After knowing their productivity,
firms choose between an automated and a manual technology. If a firm chooses the automated
tech-nology, it is capital-intensive, bears the (start-up) cost of capital,κK > 0, and produceszK(z) ≡ zKz
8We interpret this productivity draw as an endowment or capability accessed through an undirected search process by
units of output using only capital.9 If a firm chooses the manual technology, it is labor-intensive and
behaves similarly to firms in the DMP model: it employs one worker, bargains the wagew(z)with the
worker, bears the (start-up) costκL/µ(θ) > 0to fill its vacancy, and produceszL(z) ≡ zLzα units of
output using only labor. zLdenotes the productivity of labor, which contrasts with the productivity
of capital,zK. In the labor market, a standard matching function determines the number of matches.
As a result, the job-filling probability,µ(θ) ≡ χθ−η, and the job-finding probability, f(θ) ≡χθ1−η, are
functions of the matching efficiency, χ > 0, the elasticity of the matching function with respect to
nonemployed workers,1> η >0, and the labor market tightness,θ.
2.1 Firms
A firm that draws the productivityzhas the present-discounted valuesJL(z)andJK(z)if it employs
the manual and automated technologies, respectively:
JL(z) =zL(z)−w(z) +β(1−δL)JL(z), (1)
JK(z) =zK(z) +β(1−δK)JK(z). (2)
We assume a common discount factor ofβ and an exogenous firm-destruction probability of δLfor
the manual technology andδKfor the automated technology.
Different draws of productivity may imply different choices of technology. A firm will only be
in-different between the two technologies if its value net of the respective start-up cost is the same for
the two technologies:
βJL(z
∗
)− κL
µ(θ) =JK(z
∗
)−κK, (3)
9Since capital (the automated technology) is regarded, ex ante, as a perfect substitute of the manual technology, capital
in our model can be interpreted, more specifically, as robots and the costκK as the cost of a robot. This agrees with the
where we assume that it takes one period for a worker to start production and we usez∗
to denote the
cutoff productivity draw that makes the firm indifferent between the two technologies. Throughout
this paper, we refer to Eq. (3) as a no-arbitrage condition between the two technologies. Also
through-out this paper, we assume that higher draws ofzare favorable to the automated technology relative to
the manual one, implying thatα <1. Thus, for draws ofzin the interval[zmin, z∗
], the firm chooses the
manual technology; and for draws ofzin the interval(z∗
,∞), the firm chooses the automated
tech-nology. This implies that the largest firms (which correspond to the firms with the largest productivity
draws and, thus, the largest sales) are capital intensive, as suggested by the empirical evidence (see,
e.g.,Autor et al.,2017a,2017b). To close the firms’ block of our model, we assume free-entry to open
firms:
Z z∗ zmin
βJL(z)− κL
µ(θ)
dG(z) +
Z ∞
z∗
(JK(z)−κK) dG(z) = Ω, (4)
whereΩis a sunk entry cost.
2.2 Workers
In our model, there is a measureLof risk-neutral workers who are in one of two states: employed or
nonemployed. If employed, a worker earns the wagew(z), which varies with the productivity draw of
the firm, and loses its job with a probabilityδL. We denote the lifetime income of an employed worker
byE(z):
E(z) =w(z) +β[(1−δL)E(z) +δLU]. (5)
If nonemployed, a worker enjoys incomeb≥0and finds a job with a probabilityf(θ). We denote the
lifetime income of a nonemployed worker byU:
U =b+β "
f(θ) 1
G(z∗)
Z z∗ zmin
E(z)dG(z) + (1−f(θ))U #
where G(1z∗)
Rz∗
zminE(z)dG(z)is the average expected value of employment.
10
2.3 The Wage
Workers and firms bargain over wages such that the bargained wage maximizes the Nash product:
w(z) = arg max (E(z)−U)φ
JL(z)−max
βJL(z)− κL
µ(θ), JK(z)−κK
1−φ
, (7)
where the parameter 1 > φ > 0 measures the worker’s bargaining power or, in other words, the
worker’s share of the surplus. In the standard DMP model, workers and firms also bargain over wages.
Yet, in the DMP model, the firm’s surplus of the match is merely the difference between the value of
employment and the value of a vacancy (equal to zero, in equilibrium), which is much simpler than
in our model. In our model, a firm has two options. The first is that it may not agree a wage with the
worker and search for another worker. The value of this option isβJL(z)− κL
µ(θ); that is, the firm may
invest κL
µ(θ) to find another worker which will generate a value ofβJL(z).11 The second option is that
it may instead threaten the worker it will move to the automated technology; in this case, its outside
value is given byJk(z)−κK. Yet, in an equilibrium of our model, the firm will only bargain with the
worker if it has previously chosen the manual technology (that is,zmin ≤z≤z∗
). As a result, the value
of the relevant outside option of the firm isβJL(z)− µκ(Lθ) andw(z)must satisfy
E(z)−U = φ 1−φ
(1−β)JL(z) + κL
µ(θ)
. (8)
10AlthoughE(z)depends onz,Udoes not.zis specific to a firm and, thus, only influences the wage of a particular job; it
does not influence the value of nonemployment. Instead, the value of nonemployment depends on the distribution ofG(z) in the range that firms decide to open manual firms:[zmin, z∗].
11In the DMP model, the firm may also threat it will search for another worker. But in that model the value of this option
Making use of Eqs. (1-6), we rewrite the previous equation as
w(z) = 1−φ 1−φβb+
φ
1−φβ
(1−β)zL(z) + κL
µ(θ)(1−β(1−δL))
+
βf(θ) φ 1−φβ
(1−β)
Ω−
Z ∞
z∗
(JK(z)−κK) dG(z)
1
βG(z∗) + (1−β)
κL βµ(θ) +
κL µ(θ)
. (9)
As in the DMP model, wages increase with the nonemployment income, b, the productivity of the
match,zL(z), and with labor market tightness, θ. This equation, however, is more complex than the
one in the DMP model due to the mechanism of technology choice in our model and its interaction
with labor market frictions.
2.4 Equilibrium
The equilibrium of the model is defined at the aggregate level of the economy and is characterized
by the vector(θ, z∗
, w(z)), which satisfies the no-arbitrage condition, Eq. (3), the free-entry condition,
Eq. (4), and the wage equation, Eq. (9). Furthermore, in equilibrium, the flows from employment to
nonemployment must equal the flows from nonemployment to employment. This implies that after
we derive the vector(θ, z∗
, w(z)), the employment rate satisfiesn= f(fθ)+(θ)δ
L.
In the equilibrium of our model, we obtain the output,y, by summing up the production of manual
and automated firms. To measure the production of each technology, we use the product of the
num-ber of firms using that technology and their (conditional) average production. We easily obtain the
production of manual firms: because each worker corresponds to a manual firm, there arenLmanual
firms, each producing an average of G(1z∗)
Rz∗
zminzL(z)dG(z)units of output. But it is more intricate to
obtain the production of automated firms as first we need to pin down their number. Every period
there is a measure of firms entering the market that satisfies Eq. (4). A proportionG(z∗
)choose the
manual technology and a proportion1−G(z∗
number of entering firms choosing the manual technology isf(θ)(1−n)L, which equals the number of
manual firms exiting the market,δLnL. Because the fractionG(z∗
)of total entering firms corresponds
toδLnLmanual firms, there areδLnL1
−G(z∗)
G(z∗) automated firms entering every period. Furthermore,
an automated firm lasts on average1/δKperiods. Thus, there are δL
δKnL
1−G(z∗)
G(z∗) automated firms, each
producing an average of 1−G1(z∗)
R∞
z∗ zK(z)dG(z)units of output. Output in our model, then, is
y≡ nL
G(z∗
)
Z z∗ zmin
zL(z)dG(z) + δL δK
Z ∞
z∗
zK(z)dG(z) !
. (10)
In our paper, it is essential to define the labor share, LS, which corresponds to the fraction of
output paid to workers. In our model, there arenLemployed workers, each receiving an average wage
of G(1z∗)
Rz∗
zminw(z)dG(z). Using the expression for output of Eq. (10), after a few rearrangements, we
write the labor share as12
LS ≡
Rz∗
zminw(z)dG(z)
Rz∗
zminzL(z)dG(z) +
δL
δK
R∞
z∗ zK(z)dG(z)
. (11)
3
Will Machines Terminate All Jobs?
The rising substitutability of machines for workers has driven the conception that machines will
sig-nificantly reduce (and ultimately terminate) employment. Our model, however, contradicts this
con-ception. We study the effects of an automation-augmenting shock (a rise inzK) and conclude that a
rise in the productivity of machines increases both wages and employment.
12As we assume thatκ
L,κK, andΩare not expressed in labor units, these costs do not contribute to labor income and,
3.1 Analytical Results
In this section, we study analytically how a rise inzKchanges the labor market tightness and, thus, the
employment rate. To ease our exposition and derivations, we assume thatα= 0(implyingzL(z) =zL),
but in the next section we show that our results hold under other calibrations ofα. Ifα= 0, our model
closely resembles the standard DMP model and we can write the wage equation that satisfies Eq. (9)
as
w= (1−φ)b+φ(zL+θκL)−φ
zKz∗
1−β(1−δK)
−κK
[(β−1)f(θ) + 1−β(1−δL)]
, (12)
which only differs from the wage equation of the standard DMP model because it includes a third
term on the right-hand side. An important implication ofα = 0is that the wage is independent of
the productivity drawz. Thus, the value of the manual technologyJL(z)is the same for all draws ofz.
Log-linearizing the no-arbitrage condition, Eq. (3), and the wage equation, Eq. (12), we obtain
ˆ
θ= A
B( ˆzK+ ˆz
∗), (13)
whereA≡ zKz∗
1−β(1−δK)
1−βφ+βφ(1−β)χθ1−η
1−β(1−δL)
>0,B ≡ − φβ(1−β)(1−η)
zK z∗
1−β(1−δK)−κK
χθ1−η+θκ L
1−β(1−δL) +η
κLθη
χ !
<
0, and we use hats to denote log-linear variables. (See Appendix A.1for more details on the
deriva-tions.) The signs of A andB imply that a rise in zK will only increaseθ if the elasticity of z∗ with
respect tozK is lower than −1. Thus, we must understand how a change in zK changes the
distri-bution of resources between the manual and automated technologies before we know its effects on
employment.
the no-arbitrage condition, Eq. (3), to derive:
zK Z ∞
z∗
zdG(z) +z∗
G(z∗
)
= (Ω +κK)[1−β(1−δK)]. (14)
At this stage, Eq. (14) already provides an important result. Ifα = 0, z∗
is orthogonal to θ andw
and to all of the labor market parameters and institutions (measured byzL, b, φ, δL, κL, χ,andη). This
implies that the role of labor market parameters and institutions is circumvent to the labor market,
without any effect on how resources are split between the manual and automated technologies. In
our simulations below, we show that this result does not hold ifα 6= 0. Yet, even in this case, a change
inb, φ, δL, κL, χ,orηhas a minor effect onz∗
and the labor share.
Moving to the log-linearization of Eq. (14), we obtain the elasticity ofz∗
with respect tozK:
ˆ
z∗
ˆ
zK =− R∞
z∗ zdG(z) +z
∗
G(z∗
)
z∗G(z∗) . (15)
(See AppendixA.2for more details on the derivations.) Independently of the distribution of
productiv-ity draws, this elasticproductiv-ity is lower than−1. Thus, if the productivity of the automated technology rises,
by Eq. (13), employment rises.
3.2 Interpretation and Discussion
To interpret the mechanism underlying an elasticity zzˆˆ∗
K lower than−1, we first recall that the
no-arbitrage condition in Eq. (3) links the manual and the automated technology at the cutoffz∗ . This
together with the assumption that the automated technology is multiplicatively linear inzimply, per
se, a reallocation from the manual to the automated technology with an elasticity of exactly−1. This
(15).13 On the other hand, the value of the ‘automated’ technology increases with the productivity
drawzmultiplied byzK, being zeverywhere larger thanz∗
for this technology. This implies that, by
the free-entry condition, Eq. (4), a firm entering the market must factor in the whole (conditional)
expected value ofzas regards the automated-technology option (and not only the value at the cutoff
z∗
). When the economy is hit by a positive shock tozK, the average value of the automated technology
increases, which reinforces the reallocation of resources towards this technology. This is expressed by
the first term in the numerator in Eq. (15). Consequently, for a given shift inzK, the cutoffz∗ shifts
more than proportionally in order to satisfy Eq. (4). In other words, the fact that the value of entering
depends on a non-null measure ofzunder the distributionG(z)induces a (negative) multiplier effect
inz∗ .14
Our result that an increase inzKraises employment is noteworthy given that the manual and
au-tomated technologies areex ante perfect substitutes at the micro level. If the automated technology
becomes more profitable following the rise inzK, it is only natural that some firms entering the market
steer away from the manual technology and invest in the automated technology. In our model, this
reallocation effectis captured by the fall inz∗
, which directly reduces employment. Yet, as our model
13We note that if the productivity of the automated technology is concave inz, then the effect of the denominator and the
second term in the numerator of Eq. (15) alone implies an elasticity smaller than−1.
14The elasticity ofz∗with respect toz
Kis also lower than−1for other calibrations ofα. To see this, note that the elasticity
in more general terms can be written as
ˆ z∗ ˆ zK =− zK R∞
z∗ zdG(z) +z
∗G(z∗) zKz∗G(z∗)−βz∗Rzzmin∗ j
′
L(z∗)g(z)dz
,
where we use the definition ofjL(z) ≡ zL(z)−w(z)and we assume thatδK = δL = δwithout much loss of generality.
(See AppendixA.2for more details on the derivations.)j′(z)is the derivative ofj
L(z)with respect toz. Ifα >0,jL′(z
∗)>0
because a higher productivity draw raises the returnzL(z)by more thanw(z)(see Eq. (9)). Thus, ifα >0, the elasticity of
z∗with respect toz
Kis even more negative than under the case ofα= 0. In this case, a firm entering the market must also
consider the (conditional) expected value ofzas regards the manual-technology option. The decrease inz∗induced by a
rise inzK shifts resources from the most productive and valuable manual-technology firms to the automated technology.
Hence, the average value of the manual technology falls, which reinforces the mechanism described in the text. This is expressed by the second term in the denominator in the equation above. To return an elasticity greater than−1,αmust be
(sufficiently) negative, implying that a higher productivity draw reduces the profitability of the manual technology. In our simulations below,α=−0.2continues to imply an elasticity lower than−1because, givenG(z∗)<1(i.e., there is a positive
shows, we should distinguish the implications of automation at the micro and at the aggregate level.
In our model, the choices made by individual firms at the micro level give rise to a sort of
complemen-tarity at the aggregate and general-equilibrium level that promote greater firm entry. It turns out that
the rise inzKcreates incentives to open firms (aggregate effect; size of the economy) that surpass the
reallocation effect, leading to a net increase in employment.
Looking at Eqs. (3), (4) and (9) further suggests that a rise inzKincreases employment even ifα6= 0
(as we confirm in Section4.2) and even if we conjecture different setups of our model. As long asΩ
is constant, a rise inR∞
z∗ (JK(z)−κK) dG(z) leads to an increase of the left-hand side of Eq. (4) that
must be compensated by either reallocation (change inz∗
) or an increase in the costs of the manual
technology (greater wages,w(z), or greater labor market tightness,θ). Changes inz∗
, however, can
only exacerbate the rise on the left-hand side of Eq. (4) as firms only shift between technologies if it
increases their profitability upon entry. Moreover, looking at Eq. (9), zK has a negative direct effect
on wages (by increasingJK(z)), which is amplified by the fall inz∗
as implied by Eq. (3) (and the fact
that the costs of the manual technology must increase to balance Eq. 4). Thus, after an
automation-augmenting shock, the labor market must become tighter, increasing employment.15
Our result that the aggregate effect is stronger than the reallocation effect echoes the empirical
re-sults byAutor and Salomons(2018) andGregory, Salomons and Zierahn(2018). Autor and Salomons
study the effect of total factor productivity (TFP) shocks on employment using data on multiple
indus-tries for 18 OECD counindus-tries since 1970. Their results indicate that the direct effect of TFP has been to
displace employment in the sectors in which it originates. Yet, their results also indicate that the direct
effect of TFP is more than outweighed by indirect effects. Namely,Autor and Salomonsconclude that
an increase in TFP in one sector generates employment gains in the downstream customer industries
15The logic above implies that an automation-augmenting shock leads to greater employment even if we were to
and in other sectors through greater aggregate demand that more than offset its direct
employment-displacing effects.Gregory, Salomons and Zierahn, on the other hand, analyze the effects on
employ-ment of a more specific type of innovation: routine-replacing technological change (RRTC) in Europe
from 1999 to 2010. Still, their findings are very similar to the ones byAutor and Salomons: the direct
effect of RRTC has been to significantly reduce employment (about 1.6 million jobs) but these effects
have been offset by the indirect effects of RRTC. They conclude that RRTC has increased employment
by about 1.5 million jobs.
3.3 Graphical Analysis
As mentioned above, our model has a closer resemblance to the DMP model ifα= 0. Thus, under this
condition, we can use the typical graphical analysis of the DMP model to gather further information
on the effects of the automation-augmenting shock. Figure2plots the equilibrium of our model in the
wage-tightness space assumingα = 0. The equilibrium in this space is obtained by the intersection
of the wage equation, Eq. (12), and the no-arbitrage condition, Eq. (3) (which replaces the free-entry
condition of the DMP model). Both equations maintain their main properties from the DMP model.
In tighter labor markets, workers demand higher wages, implying a positively-sloped wage equation.
Also in tigher labor markets, the hiring costs are higher because of the greater firm competition for the
same pool of nonemployed workers. As a result, in tighter labor markets, manual firms only attain the
same value if wages are lower, implying the negatively sloped curve named No-arbitrage in Figure2.
The slope of this curve becomes clearer if we rearrange Eq. (3) as
βw=βzL+
κK− κL
µ(θ)
[1−β(1−δL)]−zKz∗1−β(1−δL)
This equation also clarifies that the no-arbitrage condition shifts up after a rise inzKbecausezKz∗falls
(as we have shown in the case ofα = 0). The same logic applies to the wage equation, also implying
[image:26.612.192.429.202.423.2]an upward shift. Thus, unambiguously, an automation-augmenting shock increases wages.
Figure 2: Equilibrium wage and market tightness - the effect of higherzK
Note: This figure plots the effects of an in increase inzK for the equilibrium of our model in the wage-tightness space
assuming thatα= 0and the free-entry condition, Eq. (14), is satisfied. The intersection of the solid lines represents the equilibrium before the rise inzK, whereas the intersection of the dashed lines represents the equilibrium after the rise
inzK.
4
Simulations: Explaining the Labor Share
Considering the clear evidence of a downward trend in the labor share, a debate has emerged on
whether this trend is mainly driven by technological or by changes in labor market institutions. Our
model suggests that labor market institutions (relative to automation) play an almost insignificant role
in explaining the labor share. The model also indicates that the US labor share only falls after the late
4.1 Calibration
We calibrate the model to monthly US data and summarize our benchmark calibration in Table1. In
particular, we setβ = 0.996, implying an annual discount rate of 4.91%. We setδL = 0.036, which
equals the average job destruction rate in the US from 1948 to 2010 (Shimer,2012). And to maintain
the parallelism between the two technologies, we set δK = 0.036. To calibrate the elasticity of the
matching function with respect to nonemployment, we draw on the survey ofPetrongolo and
Pis-sarides(2001) and setη = 0.5. We also setφ= 0.5and normalizeΩ = 1,κK = 1, andL = 1. In the
literature, it is common to fixb ≈0.7zL(e.g.,Hall and Milgrom,2008,Pissarides,2009, andColes and
Kelishomi,2018). Based on this, we fixb= 0.7zLzminα . To be consistent with the evidence on firm size
distribution (e.g., Ghironi and Melitz,2005, Luttmer,2007, Gomes and Kuehn, 2017), in our model,
firms draw their productivity from a Pareto distribution,i.e.,G(z) = 1− zmin
z ξ
, whereξdetermines
the shape of the distribution. We setzmin = 0.15because of the normalization ofκK andΩ. To
cali-brateξ, we followGhironi and Melitz(2005), who useξto target the standard deviation of sales in the
[image:27.612.186.431.504.660.2]US plants. In our case, this target impliesξ= 3.12.
Table 1: Benchmark Calibration
Discount factor: β= 0.996
Rate of manual-firm destruction: δL= 0.036
Rate of automated-firm destruction: δK= 0.036
Matching function elasticity: η= 0.5
Workers’ bargaining power: φ= 0.5
Labor productivity (elasticity): α= 0 Minimum productivity draw: zmin= 0.15
Power term of the Pareto distribution: ξ= 3.12 Nonemployment income: b= 0.7zLzminα
Entry cost: Ω = 1
Cost of Capital: κK= 1
Size of the labor force: L= 1
that the productivity of labor-intensive firms is independent of the productivity draw (i.e.zL(z) =zL).
In our sensitivity analysis, however, we consider cases in whichzimproves the value of the manual
technology (α = 0.2) and in which zdeteriorates the value of the manual technology (α = −0.2).16
Regarding the remaining parameters, zL,zK, κL, andχ, to increase the comparability of our results
under the different experiments carried out in Sections4.2and4.3, we pin down their values to target
(i) the prime-age (aged 25-54) workers’ employment rate,n,17 (ii) the labor share,LS, (iii) the labor
market tightness value,θ, and (iv) the equilibrium proportion of firms that employ the manual
tech-nology,G(z∗
). In all our experiments, we targetG(z∗
) = 50%andθ = 1.18 The targets ofnandLS
change according to the simulation.
4.2 Simulated Elasticities
In this section, we present the simulated elasticities of key macroeconomic variables with respect to
multiple parameters and under various calibrations of our model. We study how the output,y, labor
share, LS, employment, n, average wages,w ≡ Rz∗
zminw(z)dG(z), and cutoff, z ∗
, change in response
to two broad types of shocks: technology and labor-market shocks. Regarding technology shocks, we
distinguish between automation-augmenting shocks,∆zK, manual-augmenting shocks,∆zL, shocks
to the cost of capital, ∆κK, and shocks to the vacancy costs, ∆κL. Regarding labor-market shocks,
we consider nonemployment income, ∆b, workers’ bargaining power,∆φ, matching efficiency,∆χ,
and job destruction rate,∆δL. To make the elasticities comparable, every experiment refers to a 1%
increase in the respective parameter. And, in all experiments, we recalibrate the model to target an
16Although we have no empirical counterpart of the parameterα, we note that our assumption of a Pareto distribution
(for the productivity draws) bounds its calibration. The Pareto distribution implies that there is a large mass of firms with productivity close to the minimum productivity draw,zmin. All of these firms use the manual technology. And, in Section4.2,
we show that the elasticity ofz∗with respect toz
Kgrows at increasing rates as we increaseα. Thus, ifαis (sufficiently) larger
than0.2, the elasticity zˆ∗
ˆ
zK is so high that the cutoffz
∗gets very close toz
minand the algorithm that runs the simulations of
our model is unable to converge.
17We target the employment rate of prime-age workers because our model abstracts from demographic changes.
18As inShimer(2005), our calibration strategy implies that a different target forθdoes not have any effect on our results.
employment rate ofn= 76%and a labor share ofLS = 61%.19Table2shows the simulated elasticities
of our model under the baseline calibration. This table confirms the analytical results of Section3and
[image:29.612.214.404.195.311.2]offers a number of other results.
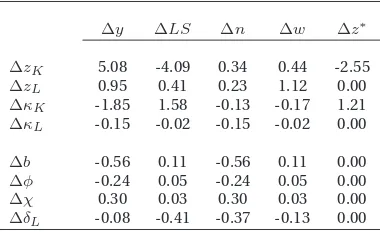
Table 2: Resultsα= 0
∆y ∆LS ∆n ∆w ∆z∗
∆zK 5.08 -4.09 0.34 0.44 -2.55
∆zL 0.95 0.41 0.23 1.12 0.00
∆κK -1.85 1.58 -0.13 -0.17 1.21
∆κL -0.15 -0.02 -0.15 -0.02 0.00
∆b -0.56 0.11 -0.56 0.11 0.00
∆φ -0.24 0.05 -0.24 0.05 0.00
∆χ 0.30 0.03 0.30 0.03 0.00
∆δL -0.08 -0.41 -0.37 -0.13 0.00
Note:This table shows the effects of the shocks to the parameters using our benchmark calibration. All values refer to percentage changes and all shocks are of1%. Thus, the values in this table may be interpreted as elasticities. In the first column, we write the respective source of the shock. In the remaining columns, we write the elasticities of output, labor share, employment, average wages, and cutoff.
Table2confirms that a rise in the automated technology productivity,zK, increases employment.
The significantly negative elasticity of z∗
with respect to zK implies that a rise inzK reallocates
re-sources from the manual to the automated technology, displacing labor. But, the greater value to
open a firm induces a significant rise in the number of firms and output that ultimately outweighs the
labor-displacing effect and increases employment. Table2also shows that a rise inzKincreases wages
but massively reduces the labor share. In our model, the increase in employment allows workers to
demand higher wages and capture a greater share of the match surplus. (See the graphical analysis in
Section3.3.) Yet, the greater employment and wage are not able to offset the shift of resources towards
the automated technology, which implies the fall in the labor share.20
19Our targets are the labor share in the nonfarm business sector and the average employment rate of prime-age workers
in the US from 1963 to 2018. Both series are retrieved from the BLS.
20As noted earlier, our model features gross complementarity between the two technologies as an aggregate equilibrium
result of an automation-augmenting shock (a rise inzK). In the standard framework of a neoclassical production function,
Our results agree to a large extent with the results inBerg, Buffie and Zanna(2018). Although our
models differ in multiple regards, an increase in the productivity of robots in their model also leads
to a considerable rise in output, which ultimately increases the real wage but reduces the labor share.
Their model, however, is silent on the labor supply response because it is assumed to be inelastic.
In this regard, our results are closer to the numerical findings in Cords and Prettner(2019). These
authors analyze quantitatively the effects of an increase in the ratio of industrial robots per
manufac-turing workers on low- and high-skill labor. By calibrating their model with German data, they find
that overall employment rises with automation since the increase in high-skill manufacturing jobs
compensates for the decrease in low-skill jobs.
The fact that the labor share drops in our model after a rise in zK further echoes the empirical
results byAutor and Salomons(2018). As mentioned earlier,Autor and Salomonsconclude that TFP
shocks have not been labor-displacing because the indirect effects have outweighed the direct effects.
This, however, is not the case for the labor share: the direct negative effect of TFP on the labor share
has not been outweighed by the positive indirect effects. Thus, in Autor and Salomons’ data, TFP
shocks work similarly to a rise inzK in our model: they both increase employment and reduce the
labor share.
Table2also confirms that the labor market parameters do not affect the allocation of resources
between the two technologies whenα = 0because they do not change the cutoff,z∗
. Furthermore,
technological shocks have a much greater impact on output and the labor share than equally
propor-tional changes in the labor market institutions. For example, a rise in the cost of capital,κK, implies a
change in the labor share about 53 times larger than that implied by a rise in the matching efficiency,χ.
Thus, unless labor market institutions change massively, technological shocks are the best candidate
to explain a fall in the labor share.21
This result leans against a theoretical literature arguing that the labor share has fallen in recent
decades due to changes in labor market institutions (e.g.,Caballero and Hammour,1998andBental
and Demougin, 2010). We should not, however, take literally our result that changes in labor
mar-ket institutions play a minor role. Our model is simple and parsimonious, which has its advantages
but also implies that it abstracts from other channels. For example, our model assumes the extreme
case that the manual technology only employs labor and the automated technology only capital (as
inZeira, 1998, 2010,Alesina, Battisti and Zeira, 2018, andAcemoglu and Restrepo,2018). Thus, our
model abstracts from the interactions between capital and labor at the micro level, which influence
how labor market institutions shape the labor share in this theoretical literature. But our model and
the models within this theoretical literature also differ in another important result: the latter models
usually predict that the labor share and employment drop simultaneously while our model predicts
that they may go in opposite direction; this makes our model broadly consistent with the US
expe-rience as we show in Section4.3. Moreover, even though simple, our model is in line with another
strand of literature. For example, as argued byAutor et al.(2017b), the fact that the labor share has
fallen in countries with very different labor market institutions points to the existence of other factors
to explain the drop in the labor share. The empirical work ofDao et al.(2017) confirms that logic: for
developed countries,Dao et al.conclude that policy and institutional factors (including labor market
institutions) barely play a role in explaining the fall in the labor share; conversely, technological
chan-nels explain about half. Furthermore, our results concur with the argument by Karabarbounis and
Neiman(2014) that the falling price of capital is a good candidate to explain the fall in the labor share.
Tables3and4show that our main conclusions from Table2hold under different calibrations ofα
21Table2also shows that labor market institutions have non-neglectable effects on employment but have limited power
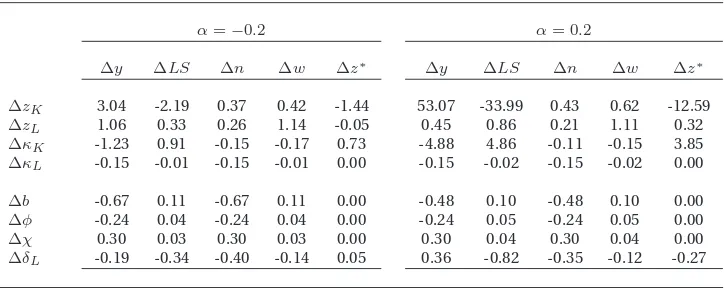
Table 3: Results –αSensitivity Analysis
α=−0.2 α= 0.2
∆y ∆LS ∆n ∆w ∆z∗ ∆y ∆LS ∆n ∆w ∆z∗
∆zK 3.04 -2.19 0.37 0.42 -1.44 53.07 -33.99 0.43 0.62 -12.59
∆zL 1.06 0.33 0.26 1.14 -0.05 0.45 0.86 0.21 1.11 0.32
∆κK -1.23 0.91 -0.15 -0.17 0.73 -4.88 4.86 -0.11 -0.15 3.85
∆κL -0.15 -0.01 -0.15 -0.01 0.00 -0.15 -0.02 -0.15 -0.02 0.00
∆b -0.67 0.11 -0.67 0.11 0.00 -0.48 0.10 -0.48 0.10 0.00
∆φ -0.24 0.04 -0.24 0.04 0.00 -0.24 0.05 -0.24 0.05 0.00
∆χ 0.30 0.03 0.30 0.03 0.00 0.30 0.04 0.30 0.04 0.00
∆δL -0.19 -0.34 -0.40 -0.14 0.05 0.36 -0.82 -0.35 -0.12 -0.27
Note:This table shows the effects of the shocks to the parameters using our benchmark calibration except for the elas-ticity of labor productivity,α. All values refer to percentage changes and all shocks are of1%. Thus, the values in this table may be interpreted as elasticities. In the first column, we write the respective source of the shock. The remaining columns are divided in two panels. In the panel to the left, we write the elasticities of output, labor share, employment, average wages, and cutoff assumingα=−0.2. In the panel to the right, we write the elasticities of the same variables but
assumingα= 0.2.
and targetedG(z∗
): a rise inzKraises wages and employment but reduces the labor share; and
tech-nological shocks have a much greater impact on output and the labor share than changes in the labor
market institutions. There are, however, two new and interesting results. Economies with a relatively
highαand a relatively low initial proportion of manual firms,G(z∗
), have much higher elasticities with
respect to automation-augmenting shocks.
Ifα = 0, all manual firms have the same value. But ifα >0, the productivity and (thus) the value of
the manual technology increases with the productivity drawz. In this case, the decrease inz∗
after a
rise inzKshifts resources from the most productive and valuable manual intensive firms to the
auto-mated technology. Therefore, the average value of the manual technology drops, which reinforces the
reallocation of resources observed whenα = 0. (Recall the analytical details in Footnote14 above.)
IfG(z∗
)is low, thenz∗
is also low and close to the lower boundzmin. This implies a higher
prepon-derance of the mass of firms that operate the automated technology and, hence, of the (conditional)
expected value ofzforz > z∗
in the transmission mechanism (see Eq. (15)). This leverages the effect
of a shock inzK, which translates into a greater elasticity ofz∗
Table 4: Results –G(z∗
)Sensitivity Analysis
G(z∗) = 0.4 G(z∗) = 0.6
∆y ∆LS ∆n ∆w ∆z∗ ∆y ∆LS ∆n ∆w ∆z∗
∆zK 10.19 -8.48 0.34 0.50 -3.47 3.02 -2.20 0.36 0.39 -2.00
∆zL 0.89 0.40 0.20 1.09 0.00 1.03 0.42 0.29 1.17 0.00
∆κK -3.06 2.84 -0.12 -0.18 1.55 -1.17 0.89 -0.14 -0.15 0.98
∆κL -0.15 -0.02 -0.15 -0.02 0.00 -0.15 -0.01 -0.15 -0.01 0.00
∆b -0.48 0.10 -0.48 0.10 0.00 -0.71 0.11 -0.71 0.11 0.00
∆φ -0.24 0.05 -0.24 0.05 0.00 -0.24 0.04 -0.24 0.04 0.00
∆χ 0.30 0.04 0.30 0.04 0.00 0.30 0.03 0.30 0.03 0.00
∆δL -0.03 -0.41 -0.34 -0.10 0.00 -0.17 -0.42 -0.43 -0.16 0.00
Note: This table shows the effects of the shocks to the parameters using our benchmark calibration but assuming a different target for the proportion of firms that use the manual technology,G(z∗). All values refer to percentage changes
and all shocks are of1%. Thus, the values in this table may be interpreted as elasticities. In the first column, we write the respective source of the shock. The remaining columns are divided in two panels. In the panel to the left, we write the elasticities of output, labor share, employment, average wages, and cutoff assumingG(z∗) = 0.4. In the panel to the
right, we write the elasticities of the same variables but assumingG(z∗) = 0.6.
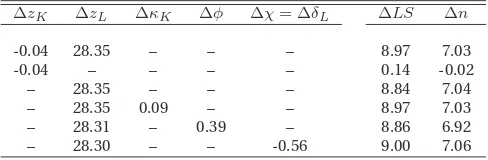
4.3 Targeted Simulations
The evidence by, e.g.,Elsby, Hobijn and S¸ahin(2013) indicates that the labor share started to fall in
the US in the late 1980s and, more specifically, around 1987. Given this evidence, in this section, we
conduct experiments to answer three questions: (i) can our model account for the fall in the labor
share after 1987? (ii) If yes, what are the forces that our model proposes to explain that fall? Finally,
(iii) why are the periods before and after 1987 different?
In our experiments, we use our model to analyze two 20-year periods: 1967-1987 and 1987-2007.
To calibrate the model, we always use our benchmark calibration as specified in Table1and our
tar-getsθ= 1andG(z∗
) = 0.5. But, depending on the 20-year period, we target the employment rate,n,
and the labor share,LS, to those observed at the beginning of the period.22 These two targets imply
that the values of the parameterszL,zK,κL, andχ(only) pertain to the 20-year period under analysis.
Then, in each experiment, we consider shocks to three parameters to target the growth rate of the size
22The targets for the labor share are63%and62%, which correspond to the average labor share in the US nonfarm business