DOI: 10.4236/jpee.2017.59011 Sep. 29, 2017 132 Journal of Power and Energy Engineering
Esebi A. Nyari
1,2*, Marcel Castro-Sitiriche
1,3, Seungyong Eugene Park
11Department of Material Energy and Science Engineering, The Nelson Mandela African Institution of Science and Technology,
Arusha, Tanzania
2Department of Mechanical Engineering, Dar es Salaam Institute of Technology, Dar es Salaam, Tanzania 3University of Puerto Rico, Mayagüez Campus, Mayagüez, PR, USA
Abstract
The present study uses power data from panel meter connected to the mi-cro-grid to identify electrical energy consumption of the school appliances and their behavior in both warm-up, standby and active operation states. Be-fore the conduction of experiments a load auditing of the school appliances was carried out by reading the rated power of each device (e.g. photocopy machine, printer, and fridge). The captures of this kind of information were essential as it provides a starting point to determine energy use of each ap-pliance and hence simplify the process of identification. The electric parame-ters such as active power, reactive power and current were used to analyze the behavior of electrical appliances in all states. Experimental results show that, both active and reactive power were found to be high for old Canon photoco-py machine as compared to new Canon photocophotoco-py machine. Another experi-ment reveals that printing one copy by using HP laser printer consumes about 700 W, while photocopying one copy with new Canon machine utilizes ap-proximately 1100 W. This study concludes that new photocopy machine con-sumes more electric energy in warm-up state as compared to other states (stand-by and active operation states). Future work is to develop an algorithm for demand side management strategies which will enable efficient utilization of the electric energy from the micro-grid and hence bring the intended energy impact to the school.
Keywords
Power Load Pattern, Load Identification, Active Power and Reactive Power
1. Introduction
Nowadays, identification of electrical appliance use from electricity meter panels How to cite this paper: Nyari, E.A.,
Ca-stro-Sitiriche, M. and Park, S.E. (2017) An Experimental Study of Electrical Appliances Consumption Using Panel Meter Data. Jour-nal of Power and Energy Engineering, 5, 132-144.
https://doi.org/10.4236/jpee.2017.59011
Received: August 4, 2017 Accepted: September 26, 2017 Published: September 29, 2017
Copyright © 2017 by authors and Scientific Research Publishing Inc. This work is licensed under the Creative Commons Attribution International License (CC BY 4.0).
DOI: 10.4236/jpee.2017.59011 133 Journal of Power and Energy Engineering has become an area of study on its own due to environmental and economic is-sues [1]. Accurate and reliable electric load identification and monitoring pro-vide critical information that enables households to effectively manage their elec-tric loads [2] [3][4][5]. A proper load identification system can help increase system efficiency by reducing the energy consumption and thus promoting green-er engreen-ergy use [6][7][8].
Over the past twenty years, many approaches have been proposed to monitor and identify electric loads. These methods can be broadly divided into two main categories: transient state and steady state [9][10]. In case of transient, the pri-mary approach of load separation is based on identification of state transitions which in most cases is done by the ON/OFF transition identification [1]. Thus, transient behavior of a typical load is intimately related to the physical task that the load performs [11][12][13]. In contrast, method based on steady state fea-tures is derived using constant or periodical signals when the electrical loads op-erate under a stable state [9]. In comparison with steady state signatures, the transient behavior of major appliances is found to be distinct and their features are less overlapping [4]. Regardless of the electrical parameters chosen to create the load signatures, the recognition algorithm can operate using three different approaches: analyzing the transient characteristics (the period of time when the load is turned ON or OFF), the steady state characteristics or a combination of both [14]. Guzel and Ustunel [15], suggested that the use of both transient and steady states can increase the possibility of identifying which load type is turned “ON”, since single state signature has its own limitation. Thus, this study con-siders both warm-up and standby states to determine the behavior of different electrical appliances at Ngarenanyuki secondary school. On the other hand, tra-ditional load signature studies and disaggregation research focused on macro load signature, such as real and reactive power [16]. Therefore, this work also uses active and reactive power plotted in the P-Q plane to identify the turn ON and OFF of school electrical appliances.
2. Methods
In this study the following methods were used; load assessment, load identifica-tion experiment, and load identificaidentifica-tion analysis.
2.1. Description of Ngarenanyuki Energy Systems
This study was conducted at the Ngarenanyuki Secondary School, which use a micro-grid hybrid generation to power the school. Figure 1 shows the layout of the main buildings in the school.
DOI: 10.4236/jpee.2017.59011 134 Journal of Power and Energy Engineering Figure 1. Layout of Nganarenanyuki secondary school.
Figure 2. Hybrid micro-grid configuration [17].
system, panel meters, and local user interface in order to manage the power flow control strategies from the power sources.
2.2. Load Assessment
[image:3.595.57.539.270.605.2]expe-DOI: 10.4236/jpee.2017.59011 135 Journal of Power and Energy Engineering riments, the first thing was to assess the electrical appliances of the school. The actual appliances of each load were identified and recorded to the energy as-sessment sheet. The following information was recorded to that sheet; type of appliance, model, size, quantity, rated power/voltage/current. This energy audit information was used as a starting point for the load identification analysis.
2.3. Load Identification
In load identification method, the key step is how to get the signatures of sample
[2]. The electrical loads often present unique characteristics in the electric sig-nals (i.e. voltage, current, and power). Such load characteristics provide a viable mean to identify the type of a load (e.g. PC, heater, lamp) and its operational status (e.g. active, ready, stand by) by analyzing the electric signals [9]. To clas-sify the load signatures some of its features are responsible like current wave-form (CW), active/reactive power (PQ), harmonics (HAR), instantaneous ad-mittance waveform (IAW), instantaneous power waveform (IPW), eigenvalues (EIG), and switching transient waveform (STW) [19]. Methods to detect elec-trical loads through voltage, current and power measurements have been pro-posed by various researchers [9]. In this study the data consisting of the active power, reactive power, voltage, current and frequency signals were acquired from the meter panel. The analysis was mainly based on active power, reactive power and current. The voltage signal was not used as a parameter for load iden-tification, as the voltage variations were negligible for the most part and in due course do not affect the identification results [14].
2.3.1. Experimental Setup
The Ngarenanyuki Secondary School blocks are divided into three loads. Load 1 includes administration, classrooms, library, and rest house blocks. Load 2 is connected to teacher’s houses and girls dormitory, whereas load 3 power both kitchen and canteen blocks. In this experiment only load 1 (administration and classroom blocks) and load 3 (canteen blocks) were studied. The following elec-trical appliances were considered; lights, Tube lights (18 W and 36 W), photo-copy machine (1000 W), printer (600 W), freezer (1500 W), desktop and laptop computer (90 W).
2.3.2. Experimental Procedure
During the experiment other blocks were switched OFF at the main switch to obtain the reading of electric energy consumption for the respective block only, as shown in Figure 3. Each experiment was video recorded in order to recall the starting and ending time of the experiment. After all experiments were com-pleted, the energy data was downloaded from the meter panel.
1) Administration Block Experiments
DOI: 10.4236/jpee.2017.59011 136 Journal of Power and Energy Engineering Figure 3. Ngarenanyuki micro-grid system main switch board.
Table 1. Switching ON and OFF appliances.
Appliance 1 2 3 4 5 6 7 8 9 10
Tube Light 1 ON ON ON ON ON ON ON ON ON ON Tube Light 2 ON ON ON ON ON ON ON ON ON ON Tube Light 3 OFF ON ON ON OFF OFF OFF OFF OFF OFF Monitor OFF OFF OFF OFF OFF ON ON OFF OFF OFF Acer PC Tower OFF OFF OFF OFF OFF OFF ON ON OFF OFF Latitude E6410
Laptop ON ON OFF ON ON ON ON ON ON ON
Internet Sever ON ON OFF ON ON ON ON ON ON ON
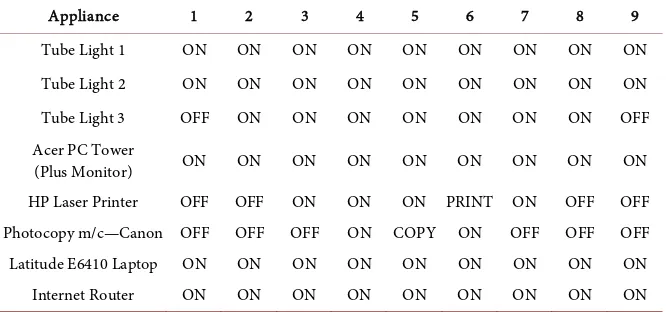
Table 2. Photocopy and printer experiment.
Appliance 1 2 3 4 5 6 7 8 9
Tube Light 1 ON ON ON ON ON ON ON ON ON
Tube Light 2 ON ON ON ON ON ON ON ON ON
Tube Light 3 OFF ON ON ON ON ON ON ON OFF
Acer PC Tower
(Plus Monitor) ON ON ON ON ON ON ON ON ON
HP Laser Printer OFF OFF ON ON ON PRINT ON OFF OFF Photocopy m/c—Canon OFF OFF OFF ON COPY ON OFF OFF OFF Latitude E6410 Laptop ON ON ON ON ON ON ON ON ON
Internet Router ON ON ON ON ON ON ON ON ON
turning ON some appliances, and then making a photocopy and printing. For the third experiment the photocopy machine was switched ON for about 10 seconds and then commanded to make 10 copies before being switched OFF as shown in experimental procedure Table 3.
2) Canteen Experiment
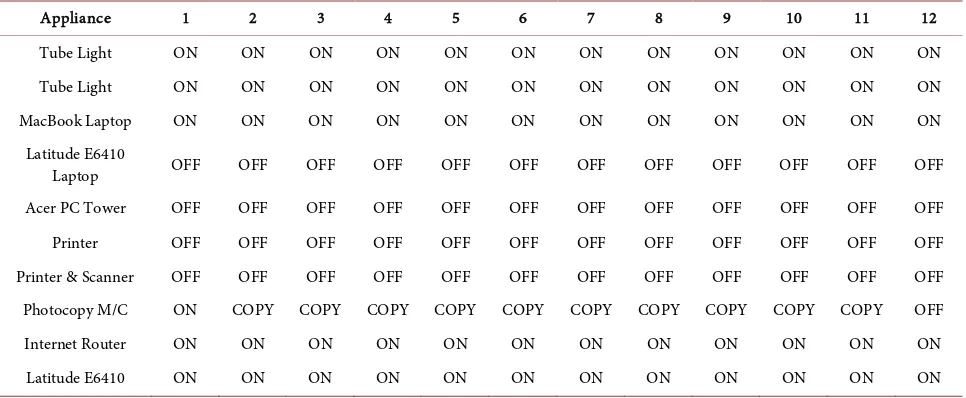
[image:5.595.207.540.436.592.2]DOI: 10.4236/jpee.2017.59011 137 Journal of Power and Energy Engineering Table 3. Photocopying experiment.
Appliance 1 2 3 4 5 6 7 8 9 10 11 12
Tube Light ON ON ON ON ON ON ON ON ON ON ON ON
Tube Light ON ON ON ON ON ON ON ON ON ON ON ON
MacBook Laptop ON ON ON ON ON ON ON ON ON ON ON ON
Latitude E6410
Laptop OFF OFF OFF OFF OFF OFF OFF OFF OFF OFF OFF OFF
Acer PC Tower OFF OFF OFF OFF OFF OFF OFF OFF OFF OFF OFF OFF
Printer OFF OFF OFF OFF OFF OFF OFF OFF OFF OFF OFF OFF
Printer & Scanner OFF OFF OFF OFF OFF OFF OFF OFF OFF OFF OFF OFF Photocopy M/C ON COPY COPY COPY COPY COPY COPY COPY COPY COPY COPY OFF
Internet Router ON ON ON ON ON ON ON ON ON ON ON ON
[image:6.595.56.540.321.371.2]Latitude E6410 ON ON ON ON ON ON ON ON ON ON ON ON
Table 4. Switching ON and OFF appliances in canteen.
Appliance 1 2 3 4 5 6 8
Lights Freezer
OFF ON OFF OFF OFF OFF OFF
OFF OFF OFF ON OFF ON OFF
3. Experimental Results
The present work used micro-grid power data to analyze and identify the ON/OFF status of loads and the operation behavior of school electrical appliances such as lights, photocopy machine, printer and freezer. It is worth mentioning here that, in the administration block, there is an uninterruptible power supply backup (UPS) connected, which is expected to alter the meter panel reading. The expe-riments were conducted with and without backup UPS connection. However, the present analysis considers the experimental results without backup UPS only, which gives the actual variations of power consumption. The results of both com-posite load (CL) and load signature analysis are presented in this section.
3.1. Warm-Up and Standby State Results
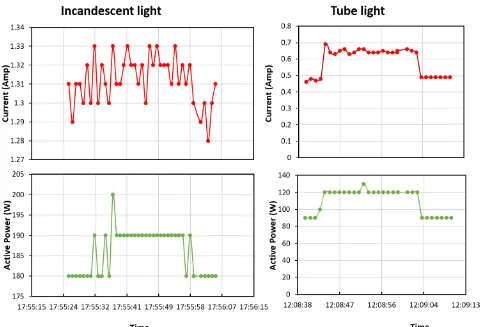
The patterns for both switching ON and switching OFF current and active pow-er have been acquired in ordpow-er to analyze the waveforms and extract unique ap-pliance specific features as shown in this section. The top graphs in Figures 4-7
shows the current consumed by different appliances and the bottom plots show the active power consumption.
DOI: 10.4236/jpee.2017.59011 138 Journal of Power and Energy Engineering Figure 4. Current and active power for lights.
Looking at Figure 5, load pattern for desktop computer is contrasted with the HP printer. HP printer draws more current and active power when turned ON as compared to desktop computer. On the other hand, the difference between current and active power waveform for both appliances are hardly noticeable denoting a fairly constant voltage. However, the load pattern of the two ap-pliances differs considerably.
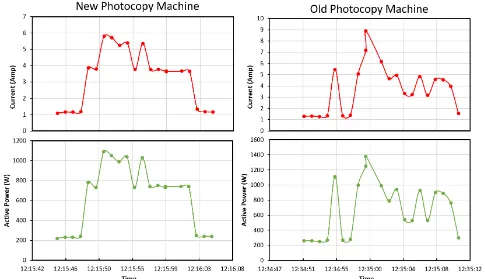
Figure 6 presents the comparison of load pattern for new and old photocopy machines. Although the two photocopy machines have slightly different loads, both have similar patterns in current and active power spectrum. Looking in the
Figure 6 power consumption is higher for the old photocopy machine as com-pared to new photocopy machine. There are slight increase of current and active power for second switch ON and OFF, as compared to first action
Figure 7 presents behavior of freezer when switched ON and OFF twice. Its event detection is observed by the peak values of both current and active power. It is noteworthy in the plot that the waveform responses are slightly different for the two sequences observed.
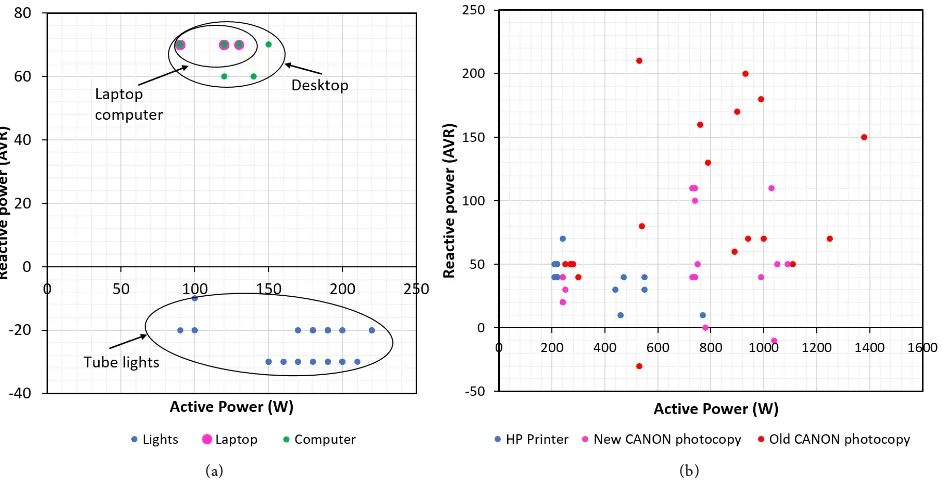
3.2. Reactive and Active Power
DOI: 10.4236/jpee.2017.59011 139 Journal of Power and Energy Engineering Figure 5. Current and active power for desktop computer and HP printer.
Figure 6. Current and active power for the photocopy machines.
[image:8.595.57.542.379.658.2]DOI: 10.4236/jpee.2017.59011 140 Journal of Power and Energy Engineering Figure 7. Current and active power for a freezer.
[image:9.595.67.541.465.705.2]DOI: 10.4236/jpee.2017.59011 141 Journal of Power and Energy Engineering reactive power of −20 AVR. Figure 8(b) shows the spatial view of HP printer, New CANON and old photocopy machines which are presented by blue, pink and red color respectively. In Figure 8(b) the reactive power is observed to be high for old Canon photocopy machine followed by new photocopy machine and the last is printer.
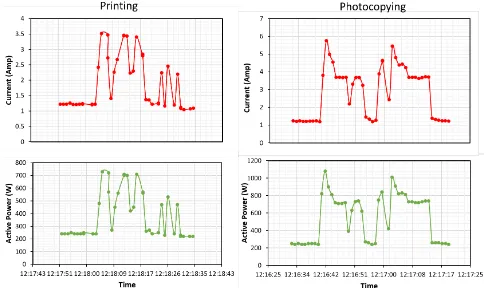
[image:10.595.56.543.417.705.2]3.3. Operation State Results
3.3.1. Printer and Photocopy MachineFigure 9 illustrates the observed current and active power for the printer and new photocopy machine operating in different conditions. Looking at the Figure 9 it is clear that the amount of current and active power used for photocopying one copy is higher as compared to printing one page. However, the active power signature is the same as current for both machines. The maximum printing cur-rent and active power was found to be 3.5 A and 700 W respectively. On the other hand, maximum photocopying current and active power was found to be 5.8 A and 1100 W respectively.
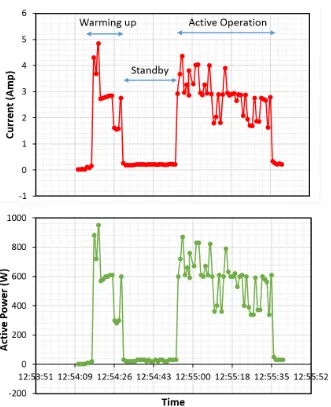
3.3.2. Photocopy Machine
When an electric load such as the photocopy machine is turned on the current waveform experiences high fluctuations at the time of switch ON. Those fluc-tuations need to be captured in a suitable format so that they can be used to automatically detect the event of switch ON [20]. As such this study also makes the comparative of all states using photocopy machine. Figure 10 illustrate the
DOI: 10.4236/jpee.2017.59011 142 Journal of Power and Energy Engineering Figure 10. Current and active power for a photocopy machine.
absolute magnitude values of the current and active power signals of photocopy machine in warm-up, standby and active operation states. Analysis of this plot indicates that the high fluctuations of current and active power can be observed at the time of warm-up state (switch ON).
4. Conclusion
signa-DOI: 10.4236/jpee.2017.59011 143 Journal of Power and Energy Engineering ture analysis methodologies. Another area for future research is to develop de-mand side management strategies by integrating the load signatures results with the impact that electricity has on the quality of life in the context of universal access of energy for remote rural communities.
Acknowledgements
The authors would like to thank Nelson Mandela African Institution of Science and Technology for the sponsorship. Funding from National Science Foundation (NSF), Cultivating Responsible Wellbeing (CRWS) project (award number 1449489) made possible the collaboration with University of Puerto Rico—Mayagüez (UPRM). We are also pleased to acknowledge valuable discussions and information from Ngarenanyuki Secondary School staff.
References
[1] Basu, K., Debusschere, V. and Bacha, S. (2012) Load Identification from Power Re-cordings at Meter Panel in Residential Households. 2012 XXth International Con-ference on Electrical Machines (ICEM), Marseille, 2-5 September 2012, 2098-2104. [2] Huang, Y. and Yang, H. (2012) A Method Based on K-Means and Fuzzy Algorithm
for Industrial Load Identification. 2012 Asia-Pacific Power and Energy Engineering Conference, Shanghai, 27-29 March 2012, 1-4.
[3] Srinivasan, D., Ng, W. and Liew, A. (2006) Neural-Network-Based Signature Rec-ognition for Harmonic Source Identification. IEEE Transactions on Power Delivery, 21, 398-405. https://doi.org/10.1109/TPWRD.2005.852370
[4] Zoha, A., et al. (2012) Non-Intrusive Load Monitoring Approaches for Disaggre-gated Energy Sensing: A Survey. Sensors, 12, 16838-16866.
https://doi.org/10.3390/s121216838
[5] Meehan, P. (2015) An Efficient Scalable Time-Frequency Method for Tracking Energy Usage of Domestic Appliances Using a Two-Step Classification Algorithm. PhD Thesis, Dublin City University, Dublin.
[6] Amenta, V. and Tina, G.M. (2015) Load Demand Disaggregation Based on Simple Load Signature and User’s Feedback. Energy Procedia, 83, 380-388.
https://doi.org/10.1016/j.egypro.2015.12.213
[7] Chan, W., So, A.T. and Lai, L. (2000) Harmonics Load Signature Recognition by Wavelets Transforms. Proceedings of 2000 International Conference on Electric Utility Deregulation and Restructuring and Power Technologies, London, 4-7 April 2000, 666-671. https://doi.org/10.1109/DRPT.2000.855745
[8] Moro, J.Z., et al. (2013) A Home Appliance Recognition System Using the Ap-proach of Measuring Power Consumption and Power Factor on the Electrical Panel, Based on Energy Meter ICs. Circuits and Systems, 4, 245.
https://doi.org/10.4236/cs.2013.43033
[9] Du, Y., et al. (2010) A Review of Identification and Monitoring Methods for Electric Loads in Commercial and Residential Buildings. 2010 IEEE Energy Conversion Con-gress and Exposition, Atlanta, 12-16 September 2010, 4527-4533.
DOI: 10.4236/jpee.2017.59011 144 Journal of Power and Energy Engineering
meters for Non-Intrusive Load Monitoring. Przegląd Elektrotechniczny, 91, 86-90. https://doi.org/10.15199/48.2015.08.22
[15] Guzel, T. and Ustunel, E. (2015) Principal Components Null Space Analysis Based Non-Intrusive Load Monitoring. Electrical Power and Energy Conference, London, 26-28 October 2015, 420-423.
[16] Cheng, J.W., et al. (2012) An Alternative Use of Power Quality Information-Load Signature Studies & Applications. 15th International Conference on Harmonics and Quality of Power, Hong Kong, 17-20 June 2012, 150-155.
[17] Carmeli, M., et al. (2015) Hybrid Micro-Grid Experimental Application in Tanza-nia. International Conference on Clean Electrical Power, Taormina, 16-18 June 2015, 534-541.
[18] Mario, E.B., et al. (2010) Enhancing Electricity Audits in Residential Buildings with Nonintrusive Load Monitoring. Journal of Industrial Ecology, 14, 844-858.
[19] Singh, M., et al. (2015) Residential Load Signature Analysis for Their Segregation Using Wavelet—SVM. In: Power Electronics and Renewable Energy Systems, Sprin-ger, Berlin, 863-871.https://doi.org/10.1007/978-81-322-2119-7_84
[20] Gillman, M.D., et al. (2014) Energy Accountability using Nonintrusive Load Moni-toring. IEEE Sensors Journal, 14, 1923-1931.
https://doi.org/10.1109/JSEN.2014.2305911
Submit or recommend next manuscript to SCIRP and we will provide best service for you:
Accepting pre-submission inquiries through Email, Facebook, LinkedIn, Twitter, etc. A wide selection of journals (inclusive of 9 subjects, more than 200 journals)
Providing 24-hour high-quality service User-friendly online submission system Fair and swift peer-review system
Efficient typesetting and proofreading procedure
Display of the result of downloads and visits, as well as the number of cited articles Maximum dissemination of your research work
![Figure 2. Hybrid micro-grid configuration [17].](https://thumb-us.123doks.com/thumbv2/123dok_us/171392.510308/3.595.183.419.71.236/figure-hybrid-micro-grid-configuration.webp)