ISSN Print: 2153-1196
DOI: 10.4236/jmp.2019.103021 Mar. 11, 2019 302 Journal of Modern Physics
Peak of Electron Density in F2-Layer Parameters
Variability at Quiet Days on Solar Minimum
Emmanuel Nanéma
1,2*, Moustapha Konaté
2, Frédéric Ouattara
21Centre National de la Recherche Scientifique et Technologique (CNRST), Institut de Recherche en Sciences Appliquées et Technologies (IRSAT), Ouagadougou, Burkina Faso
2Université Norbert ZONGO, Laboratoire de Recherche en Météorologie de l’Espace (LAREME), Koudougou, Burkina Faso
Abstract
This study deals with Peak of electron density in F2-layer sensibility scale during quiet time on solar minimum. Peaks of electron density in F2-layer (NmF2) values at the quietest days are compared to those carried out from the two nearest days (previous and following of quietest day). The study uses International Reference Ionosphere (IRI) for ionosphere modeling. The lo-cated station is Ouagadougou, in West Africa. Solar minimum of phase 22 is considered in this study. Using three core principles of ionosphere modeling under IRI running conditions, the study enables to carry out Peak of electron density in F2-layer values during the quietest days of the characteristic months for the four different seasons. These parameters are compared to those of the previous and the following of the quietest days (the day before and following each quietest selected day) at the same hour. The knowledge of NmF2 values at the quietest days and at the two nearest days enables to cal-culate the relative error that can be made on this parameter. This calcula-tion highlights insignificant relative errors. This means that NmF2 values at the two nearest days of each quietest day on solar minimum can be used for simulating the quietest days’ behavior. NmF2 values obtained by running IRI model have good correlation with those carried out by Thermos-phere-Ionosphere-Electrodynamics-General Circulation Model (TIEGCM).
Keywords
Ionosphere, Peak of Electron Density in F2-Layer, Solar Cycle, Quiet Day, International Reference Ionosphere Model
1. Introduction
Ionosphere layer is an important site for radio waves reflection because of its How to cite this paper: Nanéma, E.,
Ko-naté, M. and Ouattara, F. (2019) Peak of Electron Density in F2-Layer Parameters Variability at Quiet Days on Solar Minimum. Journal of Modern Physics, 10, 302-309. https://doi.org/10.4236/jmp.2019.103021
Received: February 1, 2019 Accepted: March 8, 2019 Published: March 11, 2019
Copyright © 2019 by author(s) and Scientific Research Publishing Inc. This work is licensed under the Creative Commons Attribution International License (CC BY 4.0).
DOI: 10.4236/jmp.2019.103021 303 Journal of Modern Physics bance predictions. Several models have been developed for ionosphere investiga-tion. In previous studies, we used International Reference Ionosphere model, Thermosphere-Ionosphere-Electrodynamics General Circulation Model, and
data [11]-[17] to carry out ionosphere parameters. The present study is focused
on the calculation of relative error on Peak of electron density in F2-layer values at the limits of the quietest days for different seasons during solar minimum, compared to those of the quietest days. In this work, we calculate the relative er-ror value on NmF2. The study is based on quiet time variation of solar cycle 22 at Ouagadougou station and uses International Reference Ionosphere (IRI) model for ionosphere investigation. 2012-version of IRI is used to run the model.
2. Methodology—Fundamentals
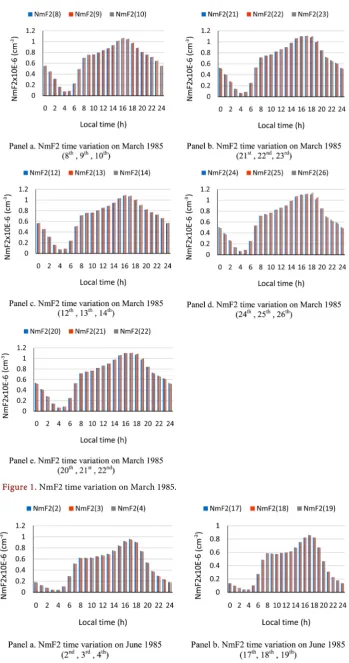
[image:2.595.206.541.692.729.2]In this study, the minimum year (1985) of solar cycle 22 is considered for Peak of electron density in F2-layer behavior. Ionosphere modeling using IRI study is focused on the following three core principles: 1) The characteristic months are March, June, September and December for spring, summer, autumn and winter respectively. 2) The five quietest days of each characteristic month are used. 3) Solar minimum is characterized by sunspot number Rz < 20 and Aa ≤ 20 nT. During quiet time conditions, the five quietest days characterize the whole month in each season. We consider the two nearest days (previous and following) of each quietest day in the characteristic month as the boundaries. Ouagadougou is located in West Africa. The following input parameters are used for running IRI model during solar minimum at the station: Year = 1985, Longitude = 358.5˚E, Latitude = 12.5˚N, Height = 500, Stepsize = 1. With above input para-meters, NmF2 time values are obtained on “List Model data”. These values are exported in an Excel file for plotting.
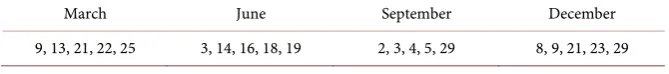
Table 1 highlights the five quietest days selected in each season on solar minimum.
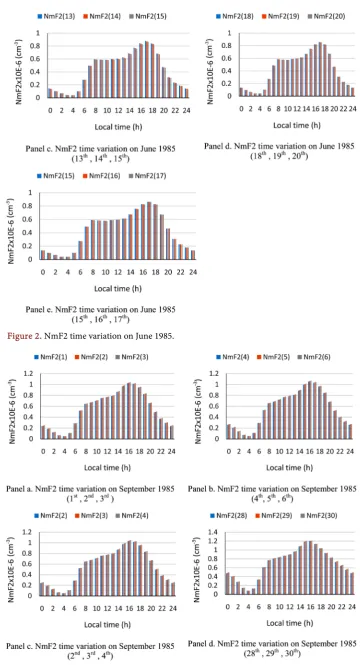
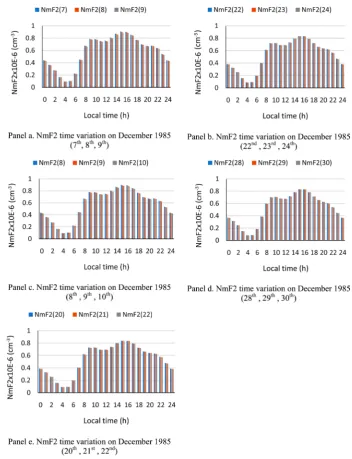
3. Results and Discussion
Figures 1-4 present NmF2 time variation carried out by running IRI model under
Table 1. Retain days during solar minimum (1985) of cycle 22.
March June September December
DOI: 10.4236/jmp.2019.103021 304 Journal of Modern Physics
DOI: 10.4236/jmp.2019.103021 305 Journal of Modern Physics
DOI: 10.4236/jmp.2019.103021 306 Journal of Modern Physics
Figure 3. NmF2 time variation on September 1985.
[image:5.595.187.540.249.709.2]DOI: 10.4236/jmp.2019.103021 307 Journal of Modern Physics In Equation (1), NmF2i(D) is the Peak of electron density value at i hour for
D-day. D-day is the quietest day.
(
D 1±)
are respectively the previous (D − 1) and the following (D + 1) day of the quietest day. i [0,24]∈ . The step for i val-ues variation is 1.Calculating the relative error on Peak of electron density in F2-layer for
Fig-ures 1-4 corresponding to March (spring), June (summer), September (autumn)
and December (winter) gives the following ranges: On March 1985:
[
]
i i NmF2 0%,4% NmF2 ∆∈ (2)
On June 1985:
[
]
i i NmF2 0%,2% NmF2 ∆∈ (3)
On September 1985:
[
]
i i NmF2 0%,4% NmF2 ∆ ∈ (4)On December 1985:
[
]
i i NmF2 0%,1% NmF2 ∆∈
(5)
The range of i
i
NmF2 NmF2 ∆
variation given by (2), (3), (4) and (5) is inferior to
4%. Peak of electron density in F2-layer values vary slightly from the quietest day to its two nearest selected days. This means that NmF2D-1 ~ NmF2D ~
NmF2D+1 at the same time Calculated relative error at each hour between the
quietest day and its two nearest days is inferior to 4% for NmF2. However, NmF2 value is a multiple of 105 cm−3. In each panel, a variation of 4% is
insensi-ble on NmF2 value. This enainsensi-bles to conclude that a 4% variation on NmF2 does not influence measurably Peak of electron density in F2-layer. So, using NmF2 value at the nearest days of quietest day doesn’t introduce a sensitive error on this parameter.
4. Conclusion
DOI: 10.4236/jmp.2019.103021 308 Journal of Modern Physics use of IRI model. The study highlights insignificant relative errors on NmF2 car-ried out from the quietest days on solar minimum of phase 22 at Ouagadougou station. This means that using NmF2 values at the nearest days of each quietest day instead of those of the quietest day doesn’t introduce significant error. The contribution of this study is the possibility to neglect the relative error on Peak of electron density in F2-layer parameter due by considering the value of this parameter at the limits of each quietest day on solar minimum at low latitudes. This means that we can use either NmF2 carried from the quietest day or those from the nearest days to characterize the quietest day behavior. For a next study, this method will be applied to NmF2 variability on solar maximum.
Conflicts of Interest
The authors declare no conflicts of interest regarding the publication of this paper.
References
[1] Pedatella, N.M., Forbes, J.M., Maute, A., Richmond, A.D., Fang, T.-W., Larson, K.M. and Millward, G. (2011) Journal of Geophysical Research, 116, A12309. https://doi.org/10.1029/2011JA016600
[2] Roble, R.G., Ridley, E.C., Richmond, A.D. and Dickinson, R.E. (1988) Geophysics Research Letter, 15, 1325-1328. https://doi.org/10.1029/GL015i012p01325
[3] Wang, W., Wiltberger, M., Burns, A.G., Solomon, S.C., Killeen, T.L., Maruyama, N. and Lyon, J.G. (2004) Journal of Atmospheric and Solar-Terrestrial Physics, 66, 1425-1441. https://doi.org/10.1016/j.jastp.2004.04.008
[4] Richmond, A.D., Ridley, E.C. and Roble, R.G. (1992) Geophysics Research Letter, 19, 601-604. https://doi.org/10.1029/92GL00401
[5] Burns, A.G., Wang, W., Killen, T.L. and Solomon, S.C. (2004) Journal of Atmos-pheric and Solar-Terrestrial Physics, 66, 1457-1468.
https://doi.org/10.1016/j.jastp.2004.04.009
[6] Weimer, D.R. (2005) Journal of Geophysical Research, 110, A05306. https://doi.org/10.1029/2004JA010884
[7] Jin, S. and Park, J.U. (2007) Earth Planet Space, 59, 287-292.
https://doi.org/10.1186/BF03353106
[8] Bittencourt, J.A. and Chryssafidis, M. (1994) Journal of Atmospheric and So-lar-Terrestrial Physics, 56, 995-1009. https://doi.org/10.1016/0021-9169(94)90159-7 [9] Ouattara, F. and Rolland, F. (2011) Scientific Research and Essays, 6, 3609-3622.
https://doi.org/10.5897/SRE10.1050
[10] Qian, L., Burns, A.G., Chamberlin, P.C. and Solomon, S.C. (2010) Journal of Geo-physical Research, 115, A09311. https://doi.org/10.1029/2009JA015225
[11] Ouattara, F. and Nanéma, E. (2014) Physical Science International Journal, 4, 892-902. https://doi.org/10.9734/PSIJ/2014/9748
[12] Ouattara, F. (2013) Archives of Physics Research, 4, 12-18.
[13] Ouattara, F. and Nanéma E. (2013) Archives of Applied Science Research, 5, 55-61. [14] Nanéma, E., Ouédraogo, I., Zoundi, C. and Ouattara, F. (2018) International
Jour-nal of Geosciences, 9, 572-578. https://doi.org/10.4236/ijg.2018.99033