s
PLANNING AND DEVELOPING THE RESOURCES BY CARBON FOOTPRINT ASSESSMENT
Manager (M), Forest Déptt., CCL,
ARTICLE INFO ABSTRACT
Climate change related policies, action plans and
Reporting Standard were used to develop a model for assessment of carbon foot print of a large opencast
3 as per GHG protocol corporate standard. These activities either direct or indirect emitters are main contributors of GHG emissions during coal mining process. 20 no
relations were used with assumptions. The paper also describes the Green House Gas (GHG) reduction measures in an opencast coal mine.27 pathways of GHG reduction along with 14 general pathways have been identified from differen
to reduce their carbon foot print & help the India’s INDC commitment for reducing 2% of carbon emission as per Paris 2015
development of mines in a locality. Thus knowledge of carbon footprint beforehand will also help planners in planning and developing urban settlement in and around an open cast mine As per although
shown a decreasing trend diesel consumption.
been illustrated through graphs,
Copyright©2016, Manoj Kumar. This is an open access article distributed under the Creative Commons Att distribution, and reproduction in any medium, provided the original work is properly cited.
INTRODUCTION
Coal mining has encouraged urbanization. The cities developed in and around the coal mines stem from the combination of industrialization and urbanization. The rural settlement has been transformed to urban settlement. Globally, economic and population growth in coal mining areas continue to be the most important drivers of increases in CO
from fossil fuel combustion. The mining industry is a major global energy user, but is not a significant GHG producer. Whole world is looking for clean energy. Coal being the prime source of energy needs to be cleaner and cleaner. A clean coal will result in less GHG emission. Carbon management for the urban population so developed near the coal mines will probably be the single most important challenge in the context of the enhanced greenhouse effect due to the various activities related to coal mining. Emission of CO
greenhouse gas (GHG), is strongly related to use of fossil fuels, especially coal, for energy production. Increasing population and consequent increasing energy demand warrants development of strategies to assess greenhouse gas emission level with minimum uncertainty and also to ensure stabilize
*Corresponding author: Dr. Manoj Kumar,
Manager (M), Forest Déptt., CCL, Ranchi-29
ISSN: 0975-833X
Article History:
Received 03rd September, 2016
Received in revised form 19th October, 2016
Accepted 10th November, 2016
Published online 30th December,2016
Key words:
GHG, Footprint, Pathways, Emission.
Citation: Manoj Kumar, 2016. “Planning and developing the resources by carbon footprint assessment 43312-43319.
RESEARCH ARTICLE
PLANNING AND DEVELOPING THE RESOURCES BY CARBON FOOTPRINT ASSESSMENT
*Dr. Manoj Kumar
Manager (M), Forest Déptt., CCL, Ranchi-29
ABSTRACT
Climate change related policies, action plans and GHG Protocol’s Lifecycle Accounting and Reporting Standard were used to develop a model for assessment of carbon foot print of a large opencast coal mine in India. 28 numbers of mining activities grouped into Scope
3 as per GHG protocol corporate standard. These activities either direct or indirect emitters are main contributors of GHG emissions during coal mining process. 20 no
relations were used with assumptions. The paper also describes the Green House Gas (GHG) reduction measures in an opencast coal mine.27 pathways of GHG reduction along with 14 general pathways have been identified from different sources. The paper will certainly help the mine managers to reduce their carbon foot print & help the India’s INDC commitment for reducing 2% of carbon emission as per Paris 2015 submits. Rural settlement sets on transforming to urban settlement on opment of mines in a locality. Thus knowledge of carbon footprint beforehand will also help planners in planning and developing urban settlement in and around an open cast mine As per although overall GHG emission has increased the GHG emission per u
shown a decreasing trend. The majority of GHG emissions apart from fugitive emission are from diesel consumption. The study can be replicated in other similar units of India also.
been illustrated through graphs, tables and figures.
is an open access article distributed under the Creative Commons Attribution License, which distribution, and reproduction in any medium, provided the original work is properly cited.
Coal mining has encouraged urbanization. The cities developed in and around the coal mines stem from the combination of industrialization and urbanization. The rural settlement has been transformed to urban settlement. Globally, economic and population growth in coal mining areas continue to be the most important drivers of increases in CO2 emissions from fossil fuel combustion. The mining industry is a major ergy user, but is not a significant GHG producer. Whole world is looking for clean energy. Coal being the prime source of energy needs to be cleaner and cleaner. A clean coal Carbon management for the eveloped near the coal mines will probably be the single most important challenge in the context of the enhanced greenhouse effect due to the various activities Emission of CO2, the principal d to use of fossil fuels, especially coal, for energy production. Increasing population and consequent increasing energy demand warrants development of strategies to assess greenhouse gas emission level with minimum uncertainty and also to ensure stabilized
emission to a desired level. So it is essential to carryout research to find out engineering solutions.Carbon footprint measurement is one such solution. Once the
footprint is known, a strategy can be devised to reduce it, which will help conserve the resources in a sustainable manner. Greenhouse gases (GHG) as per Kyoto Protocol includes Carbon Dioxide (CO
Oxide (N2O), Hydroflourocarbons (HFCs), Perfluorocarbons (PFCs), Sulphur Hexafluoride (SF
of Climate Change – 1997 -CO
14%, N2O – 8%, F-gases – 1% of the global GHGs. As per IPCC – 2015: CO2 emissions from fossil f
industrial processes contributed about 78% to the total GHG emission.
Aim
As the world is looking for clean energy, the cleaner coal may be one of the solutions. The clean coal will result in less GHG emission. This requires an approa
cleaner coal. Keeping this in mind a study was made to develop a model for carbon foot print assessment of an opencast coal mine and deduce the
reduction measures which helps the initial rural habitat and Available online at http://www.journalcra.com
International Journal of Current Research
Vol. 8, Issue, 12, pp.43312-43319, December, 2016
INTERNATIONAL
Planning and developing the resources by carbon footprint assessment”, International Journal of Current Research, z
PLANNING AND DEVELOPING THE RESOURCES BY CARBON FOOTPRINT ASSESSMENT
GHG Protocol’s Lifecycle Accounting and Reporting Standard were used to develop a model for assessment of carbon foot print of a large coal mine in India. 28 numbers of mining activities grouped into 1, 2 & Scope-3 as per GHG protocol corporate standard. These activities either direct or indirect emitters are main contributors of GHG emissions during coal mining process. 20 nos. of empirical mathematical relations were used with assumptions. The paper also describes the Green House Gas (GHG) reduction measures in an opencast coal mine.27 pathways of GHG reduction along with 14 general t sources. The paper will certainly help the mine managers to reduce their carbon foot print & help the India’s INDC commitment for reducing 2% of carbon submits. Rural settlement sets on transforming to urban settlement on opment of mines in a locality. Thus knowledge of carbon footprint beforehand will also help planners in planning and developing urban settlement in and around an open cast mine As per study overall GHG emission has increased the GHG emission per unit of coal production has GHG emissions apart from fugitive emission are from The study can be replicated in other similar units of India also. The results have
ribution License, which permits unrestricted use,
emission to a desired level. So it is essential to carryout research to find out engineering solutions.Carbon footprint measurement is one such solution. Once the size of carbon footprint is known, a strategy can be devised to reduce it, which will help conserve the resources in a sustainable manner. Greenhouse gases (GHG) as per Kyoto Protocol includes Carbon Dioxide (CO2), Methane (CH4), Nitrous flourocarbons (HFCs), Perfluorocarbons (PFCs), Sulphur Hexafluoride (SF6). As per International Panel CO2 contributes about 77%, CH4 – 1% of the global GHGs. As per emissions from fossil fuel combustion and industrial processes contributed about 78% to the total GHG
As the world is looking for clean energy, the cleaner coal may be one of the solutions. The clean coal will result in less GHG This requires an approach for producing clean and cleaner coal. Keeping this in mind a study was made to develop a model for carbon foot print assessment of an opencast coal mine and deduce the Green House Gas (GHG) which helps the initial rural habitat and INTERNATIONAL JOURNAL OF CURRENT RESEARCH
then urban habitat developed due to the establishment of coal mines and its ancillary activities.
Scope of study
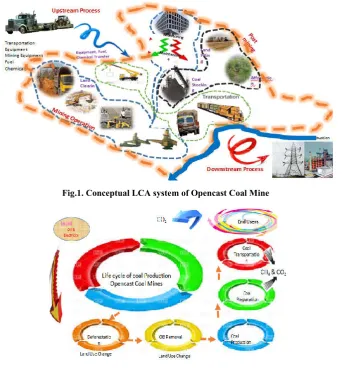
These study were in accordance with GHG Protocol’s Lifecycle - Accounting and Reporting Standard (Kumar, Manoj 2015). The assessment will further help the coal company to conserve the resources under their control. This model houses 20 empirical mathematical relations. The study area is the leasehold area of one of the opencast project of North Karnpura Coalfield of Jharkhand state. The study starts with selecting physical boundary and operational boundary. The various activities in operational boundaries of a mine are as under: disturbed area where tree cutting, felling and removal of top soil is in progress, area where overburden (OB) is being removed, OB dump site, current mining faces, de-coaled area where extraction of coal has been completed but no reclamation is done, de-coaled area where extraction completed and concurrent reclamation done, backfilled area where afforestation activity has been undertaken and the area has been restored, workshop, washery, coal stock yard etc. Emissions from oxidation of waste coal, spoil dump and fugitive emission is not being accounted because there is no accounting of quantity and huge uncertainty associated with it. Fig. 1.0 shows the conceptual coal Life Cycle Assessment (LCA) system covering typical view of physical (organizational) and operational boundary of study area. The study has been concentrated on this model.
MATERIALS AND METHODS
These studies were in accordance with GHG Protocol. Measurement of GHG emissions and includes (Kumar and Sangeeta, 2015): Identification of emission sources, Calculation approach, Collecting data, Applying suitable emission factors, Deriving total carbon footprint. Calculations were based on different activities in life cycle of coal production (Kumar and Sangeeta, 2015) (Fig 2.0) which is broadly divided into Overburden removal, Extraction of coal (i.e. breaking and Removal), Monitoring & maintenance, Coal Stocking, Coal Cleaning & Recycling, Afforestation. These activities (i) were further subdivided into sub-activities (j) and sub-activities into activities level (k).
Calculation of Carbon footprint in this model are based on empirical formula (IPCC, 2015; United States Department of Energy (USDOE) 1999; www.unfccc.int/resource/docs/cop2/ 15a01.pdf)
=
Where,
TE = Total emission in kg
ES = Emission due to various activity level
= ∗
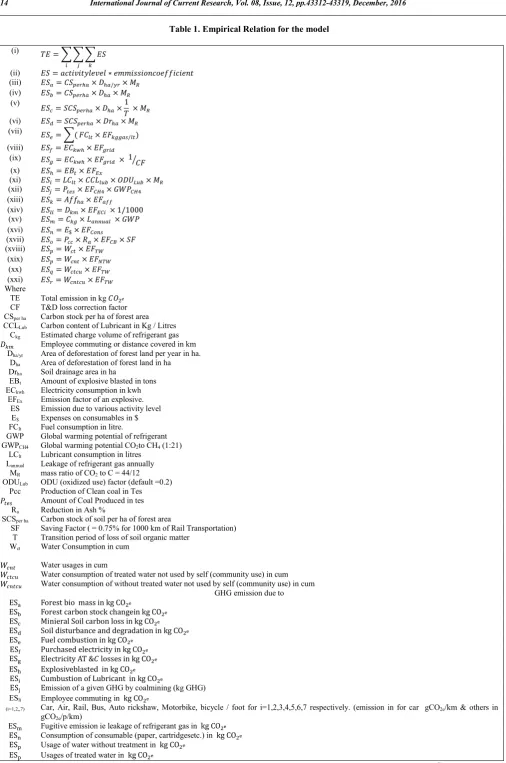
The other empirical relation used in the model are summarized in Table 1.
[image:2.595.133.477.419.790.2]43313 Manoj Kumar, Planning and developing the resources by carbon footprint assessment
[image:2.595.137.468.420.607.2]Fig.1. Conceptual LCA system of Opencast Coal Mine
Table 1. Empirical Relation for the model
(i) =
(ii) = ∗
(iii) = × / ×
(iv) = × ×
(v)
= × ×1 ×
(vi) = × ×
(vii) = ( ×
/ )
(viii) = ×
(ix) = × × 1
(x) = ×
(xi) = × × ×
(xii) = × ×
(xiii) = ×
(xiv) = × × 1/1000
(xv) = × ×
(xvi) = $×
(xvii) = × × ×
(xviii) = ×
(xix) = ×
(xx) = ×
(xxi) = ×
Where
TE Total emission in kg CF T&D loss correction factor CSper ha Carbon stock per ha of forest area
CCLLub Carbon content of Lubricant in Kg / Litres
Ckg Estimated charge volume of refrigerant gas
Employee commuting or distance covered in km Dha/yr Area of deforestation of forest land per year in ha.
Dha Area of deforestation of forest land in ha
Drha Soil drainage area in ha
EBt Amount of explosive blasted in tons
ECkwh Electricity consumption in kwh
EFEx Emission factor of an explosive.
ES Emission due to various activity level E$ Expenses on consumables in $
FClt Fuel consumption in litre.
GWP Global warming potential of refrigerant GWPCH4 Global warming potential CO2to CH4 (1:21)
LClt Lubricant consumption in litres
Lannual Leakage of refrigerant gas annually
MR mass ratio of CO2 to C = 44/12
ODULub ODU (oxidized use) factor (default =0.2)
Pcc Production of Clean coal in Tes Amount of Coal Produced in tes Ra Reduction in Ash %
SCSper ha Carbon stock of soil per ha of forest area
SF Saving Factor ( = 0.75% for 1000 km of Rail Transportation) T Transition period of loss of soil organic matter
Wct Water Consumption in cum
Water usages in cum
Water consumption of treated water not used by self (community use) in cum Water consumption of without treated water not used by self (community use) in cum
GHG emission due to
ES Forest bio mass in kg CO
ES Forest carbon stock changein kg CO
ES Minieral Soil carbon loss in kg CO
ES Soil disturbance and degradation in kg CO
ES Fuel combustion in kg CO
ES Purchased electricity in kg CO
ES Electricity AT & losses in kg CO
ES Explosiveblasted in kg CO
ES Cumbustion of Lubricant in kg CO
ES Emission of a given GHG by coalmining (kg GHG) ESli
(i=1,2,,7)
Employee commuting in kg CO
Car, Air, Rail, Bus, Auto rickshaw, Motorbike, bicycle / foot for i=1,2,3,4,5,6,7 respectively. (emission in for car gCO2e/km & others in
gCO2e/p/km)
ES Fugitive emission ie leakage of refrigerant gas in kg CO ES Consumption of consumable (paper, cartridgesetc.) in kg CO ES Usage of water without treatment in kg CO
ES Usages of treated water in kg CO
ES Removal GHG emission in kg CO2e
ES Reduction due to Ash Reduction
ES reduction due to usage of water used by community other than employee with treatment in
ES reduction due to usage of water by community other than employee without treatment in
afforestation
EFCB Emission factor of Coal Beneficiation
given GHGby type of fuel in kg CH4/ton)
EFcons Consumables
Employee commuting through ith mode of travel
EFkg gas/lt Given GHG by type of fuel
EFgrid grid of region
Water usage with treatment Water usage without treatment
0 50000 100000 150000 200000 250000 300000 350000
[image:4.595.58.538.26.812.2]2009-10 2010-11
Fig. 3 : Trend of CHG Emission [Scope wise
0% 10% 20% 30% 40% 50% 60% 70% 80% 90% 100%
2009-10
2010-Fig 4 : CHG Emission Scope
Fig 5 : SCOPE WISE GHG EMISSION SINCE 2009 43315 Manoj Kumar, Planning and
GHG emission reduction due to
reduction due to usage of water used by community other than employee with treatment in kg CO
reduction due to usage of water by community other than employee without treatment in kg CO
Emission Factor of
Emission factor of Coal Beneficiation /ton)
mode of travel
11 2011-12 2012-13 2013-14 2014
Fig. 3 : Trend of CHG Emission [Scope wise
Scope-1 Scope-2 Scope-3
-11 2011-12 2012-13 2013-14 2014-15
Fig 4 : CHG Emission Scope-wise & Yearwise
Scope-1 Scope-2 Scope-3
80% 16%
4%
Fig 5 : SCOPE WISE GHG EMISSION SINCE 2009-10
Scope-1
Scope-2
Scope-3
Planning and developing the resources by carbon footprint assessment
2014-15 2015-16
2015-16
0 1000 2000 3000
287 317 354
2009-10 2010-11
0 2000000 4000000 6000000 8000000 10000000 12000000 14000000
2009-10 2010-11
Fig 7 : CHG Emission per te vis a vis Coal production
-50000 0 50000 100000 150000 200000 250000
ESe1 ESe2 ESe3 ESe4 ESe5 ESj1
D1 D2 D3 D4 D5 D6
2013--2947 2014-15,
-3019 Fig 9 : CO2 sequestration
43316 International Journal of Current Research,
272
301 329
[image:5.595.84.516.42.792.2]298
Fig 6 : GHG Load since 2009-10
2011-12 2012-13 2013-14 2014-15
11 2011-12 2012-13 2013-14 2014-15
Fig 7 : CHG Emission per te vis a vis Coal production
Prod. GHG/tes
ESj1 ESj2 ESh ESa ESb ESc ESd ESk ESi ESe7 ESe8 ESf1 ESf2 ESf3 ESe6 ESg1 ESg2
D7 D8 D9 D10 D11 D12 D13 D14 D15 E1 E2 E3 F1 F2 F3
Fig 8: Hot Spot of Activities
2009-10, -2435
2010-11, -2435
2011-12, -2823
2012-13, -2875 -14,
2947 15, 3019
2015-16, -3092
International Journal of Current Research, Vol. 08, Issue, 12, pp.43312-43319, December
329 298
15 2015-16
0.0255 0.026 0.0265 0.027 0.0275 0.028 0.0285 0.029
2015-16
ESg2 ESg3 ESw1 ESw2 ESw3
F3 F4 F5 F6 F7
43317 Manoj Kumar, Planning and developing the resources by carbon footprint assessment
Table 2. GHG Reduction Measures
S.No. Activity 09-10 10-11 11-12 12-13 13-14 14-15 15-16
1 Surface miner 83.160 160.830 158.396 166.278 157.066 296.985 148.628
2 Inpit crushing & Conveyor 2672.76 2412.38 2767.98 3099.81 3755.06 2602.86 895.784
3 Afforestation 2435.07 2435.07 2822.82 2874.52 2946.9 3019.28 3091.66
4 Compensatory Afforestation 4710.08 4710.08 5330.48 5775.1 5775.1 5775.1 5775.1
5 Existing Washery 6568 6504 7221 6561 6512 6560 4212
6 Timer in colony nil nil nil nil nil 19630.07 13086.71
[image:6.595.56.540.409.490.2]7 Supply of LPG cylinder 5777.20 5777.20 5777.20 5777.20 5777.20 5777.20 3851.47
Table 3. Scope for reduction in GHG emission
S.No. Activity
1 Distribution of LED tube lights to employees
2 Replacement of existing fans with super energy fans in colony and offices 3 Replacement of existing tube lights / lamps in office with LED Tube lights 4 Switching off alternate street lights of colony after 11pm
5 Replacement of existing HPSV street light with LED street lights 6 Installation of meters for residential Quarters
7 Installation of floating pump house for dewatering
8 Implementation of Energy Saving measures for HEMMs to achieve benchmark diesel consumption 9 Deployment of Silo loading
10 Deployment of State of Art Belt Conveyor from mine to siding. 11 Solar Panel at various complexes (2 nos.)
12 Making separate arrangement of supply of water for (cooking + drinking) and (other rest) 13 Proposed Additional Washery (3.5 MTPA)
Table 4. GHG reduction by adopting further measures
Activity no. GHG reduction in tes Activity no. GHG reduction in tes
1 859.56 2 182.54
3 49.64 4 44.04
5 280.86 6 Not quantified
7 3.02 8 4139.64
9 1966.18 10 12869.64
11 4960.91 12 44.757
13 804.03
-50000 0 50000 100000 150000 200000 250000 300000
Overburden removal
Coal Production Transportation Monitoring &
Maintenance
Coal Stocking, Coal Cleaning &
Recycling
[image:6.595.74.532.519.660.2]Plantation
Fig. 10 GHG Emission in Life Cycle Stages
[image:6.595.165.436.690.770.2]Case Study (DEFRA 2012; DEFRA 2013; Kumar, Manoj 2015)
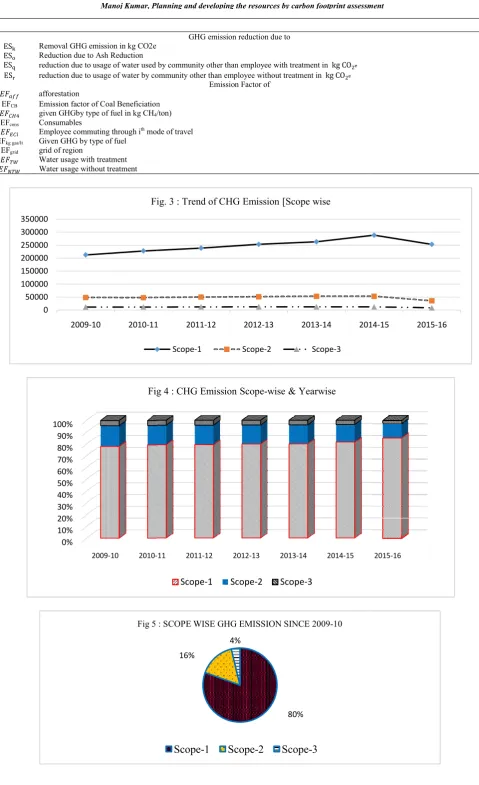
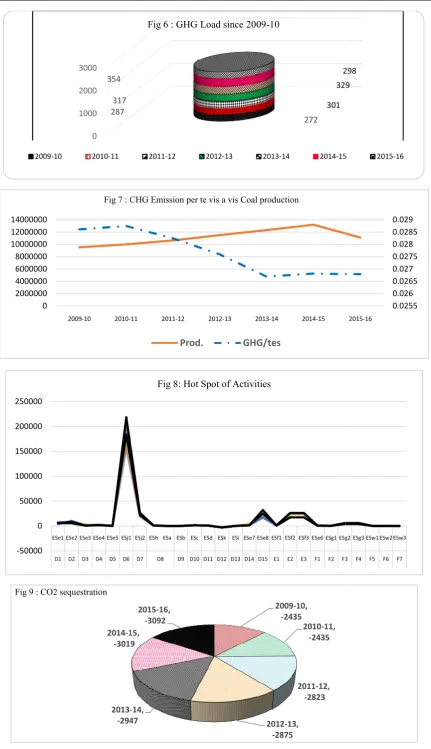
This model was administered in one of the opencast coal mine using empirical equation at table 1 and covering 26 emission sources of which 16 emission sources were from Scope-1, three sources of Scope-2 and 7 sources of scope -3. The various activity Level includes: Forest bio-mass loss, Forest carbon stock change, Mineral Soil Carbon loss, Soil disturbance and degradation, Fuel use, Electricity (Purchased) use, Electrical AT & Losses, Explosive use, Lubricant use, Fugitive Emission, Carbon Stock Gain. This model have been administered over the period of 2009-10 to 2015-16. There was an increasing trend of GHG emission (Fig 3) ranging from 272 million tes CO2e to 355 million tes CO2e of which Scope-1 sources were the major contributors. Scope – 1 emission (Fig 4 & Fig 5) is the leading contributor amounting to about 80-81% followed by Scope-2 emissions with about 16-17 % and to Scope-3 emission ranging up to 4%. The emission load 21.58 Million tes of CO2e (Fig. 6) has been contributed by the study area since 2009-10 with an average value of 27.6 kg CO2e per ton of coal production. (Fig 7) The hot spots activity (Fig 8) point out for Source no. 6 i.e. contribution by fugitive emission is maximum. Other hot spot area is near source no. 16 to source no. 19. The mining operations are energy intensive and revolves around diesel consumption. Coal production process contributes maximum to life cycle stages of coal mining process (Fig. 10). The values ranges from 0.20 to 0.26 Million tes of CO2e emission. Coal stocking, clearing and recycling process in LC stage are the next contributor ranging from 0.05 to 0.06 Million tes of CO2e emission. The OB removal and the transportation process of LC stages have almost equal contribution i.e. 0.014 to 0.025 Million tes of CO2e emission. There are some carbon stock gain enhances (Fig. 9) to the tune of 2435 to 3092 tes of CO2e emission during afforestation done by the study area. This will increase in the times to come.
The total GHG Emissions revolves round the diesel consumption. The mining operations rely upon diesel powered machines. The GHG emission for diesel use i.e. the main fuel being used in the LC stage of coal production. The main contributor amongst them is coal evacuation process (ES8) in scope-3 emission source contributing 38-39 %. The other contributor during coal production are ES2 & ES3 in Scope-1 emission source. (38-39% in combination) i.e. 76-78 % are contributed by ES8, ES2 & ES3. In the years 2009-10, 2010-11, 2011-12, 2012-13 & 2013-14, 2014-15 & 2015-16 the GHG emission were 28.6, 28.7, 28.2, 27.6, 26.7, 26.8 & 26.8 kg CO2e per ton of coal production respectively. The performance of GHG emissions per ton of coal production (Kumar and Sangeeta, 2015) in the study area though marginally increased from 2009-10 to 2010-11 seems to be improved from 2010-11 till 2013-14 and are flatten in last two years. There were continual improvement in performance of the order of 2%, 2%, 7% & 7% in subsequent year and a total of 7% from the 2010-11 level. The final analysis at the study area were found to be in order of fair GHG emission category. The GHG emission per unit of coal production has been a decreasing trend but the overall GHG emission has increased.
GHG reduction
The historic climate pact that was clinched in Paris puts India on board a global effort to achieve the global goal of “well below 2 degrees C” for temperature rise in order to tackle
climate change. In the voluntary pledge — the Intended NDCs (INDCs) — submitted to the UNFCCC, India has submitted a goal of reducing emissions intensity of the GDP by 33-35 per cent over 2005 levels by 2030.The biggest loser in the Paris agreement could be the fossil fuel industry. Also it is scientifically estimated by the UN's IPCC that the world can emit only about 2900 billion tonne (gigatonne or Gt) of carbon dioxide from pre-industrialization level till 2100 to stay below 2o Celsius global warming. But the world has already emitted 1,900 Gt of carbon dioxide till 2011, leaving only 1000 Gt of carbon space for the developing countries who still need to grow and thereby need to emit. Under this circumstances the coal companies may also contribute in combating the climate change by reducing the GHG emission. Though coal industry is not the major producers of the GHG, but can contribute a lot in providing cleaner fuel for further combating the climate change process. There is no single approach to achieve success of the GHG reduction commitment. It involves technical, managerial and human dimension and its unstained success depends on the right organizational climate. Many scientists agree that a doubling of atmospheric CO2 concentrations could have a variety of serious environmental consequences (Barnett and Schlesinger, 1987; Lindzen, 1994; Santer et al., 1995; Adams et al., 1999). Technical ways to manage C include: (i) efficient use of energy (ii) increased usage of low-C or C-free fuels and renewable energy, and (iii) capturing and securely storing carbon emitted from the global energy system (C sequestration) (USDOE, 1999). This has also been advocated by Sri Subodh Varma in an interview with Times of India that there are three ways of combating climate change. The first way, which is the focus of traditional climate talks, involves reducing emissions of greenhouse gases. A second way involves planetary geoengineering, for example, by injecting sulfur into the stratosphere to cool earth's surface. Because of the high probability of unintended consequences, most scientists consider geoengineering extremely high risk - for example it may de-stabilise the south Asian monsoon. A third way of combating climate change is to draw enough CO2 out of the atmosphere to make a difference to our climate future through biological & chemical approach. Biological approaches include initiatives such as reafforestation, the production of biochar, and wood chemistry technologies and Chemical pathways include the manufacture of carbon negative cements.
GHG reduction (in tes) by some of the measures till now at Piparwar OCP is given at Table 2. It can be observed that 0.19 M tes CO2e of GHG emission have already been saved at study area by adopting various GHG emission reduction measures. There are a lot of scope for further reduction in emission (Table 3). The details are tabulated at Table 3 and Fig. 11
By applying above measures further GHG reduction (in tes/yr) may also be taken at Piparwar OCP (Table 4).
The various other ways which may be think off are:
1. Using serpentine rocks as floor material, which sequester CO2 from the atmosphere as they weather. 2. New initiatives are to be launched in areas such as
cleaner thermal power generation 3. Promoting renewable energy
4. Reducing emissions from transport and waste 5. Creating climate resilient infrastructure.
7. Chilling the air to drop out CO2 as snow and burying them under earth crust.
8. Fly ash bricks used
9. Monetary reward to employee for GHG reduction initiative.
10.Publicity and promotion are essential to create an environment for success of GHG Reduction strategy. 11.Regular articles on energy conservation should be
included in company newsletter.
12.Posters and pamphlets may be exhibited at strategic locations.
13.Vehicles plying in the project areas may be painted with signs publicizing GHG Reduction.
14.Setting one day of the year as "GHG Reduction Day".
Conclusion
Under certain assumed conditions and with the help of derived equations carbon footprint of coal mine with available data can be assessed in ecofriendly manner and GHG emission can be derived and calculated. The pilot projects developed can be replicated to other similar units also.We strongly believe that this model will contribute to initiatives being taken to will not combat climate change but conserving the resources in better way. This will also help in planning and developing urban settlement in and around an open cast mine.
Acknowledgement
Authors is thankful to all for rendering their help both onsite and offsite. The views presented by authors are solely his interpretation.
REFERENCES
Adams, R.M., B.H. Hurd and J. Reilly. 1999. Agriculture and global climate change: AReview of Impacts to U.S. Agricultural Resources. The Pew Center on Global Climate Change, Arlington, VA
Barnett, T.P. and M.E. Schlesinger. 1987. Detecting changes in global climate induced by greenhouse gases. J. Geophy. Res., 92:14772-14780
DEFRA 2012: Guidelines to Defra / DECC's GHG Conversion Factors for Company Reporting; Version: 1.0; Updated: 28/05/2012, pp. 1-54.
DEFRA. 2013, “Government GHG Conversion Factors for Company Reporting: Methodology Paper for Emission Factors” (July 2013); Department for Environment, Food and Rural Affairs, London, pp 27-40 (www.gov.uk/defra). IPCC, 1997. Revised 1996 IPCC Guidelines for National Greenhouse Gas Inventories: Reference Manual (3). Chapter 4: Agriculture. Intergovernmental Panel on Climate Change. Paris, France
IPCC, 2015, Climate Change 2014, Synthesis Report; pp. 1-167 (ISBN 978-92-9169-143-2); (http://www.ipcc.ch.) Kumar M, Sangeeta, ‘Carbon Footprint Assessment Model for
Opencast Coal Mine (2015); IMEJ, Bhubaneshwar, Oct, 2015.
Kumar M, Sangeeta, Kumar A; ‘Carbon Footprint Assessment –A tool to conserve resource’, pp. 23-26, JSPCB, Ranchi, 5th June 2015.
Kumar M, Sangeeta, Kumar A; ‘Carbon Footprint Measurement –At an Opencast Coal Mine’, pp. 153, Kerala Environment Congress- 2015, 6th to 8th May, 2015, National Workshop on Climate Change and Sustainable Development, available at http://www.cedindia.org/wp-content/uploads/ 2013/08/KEC-2015-full-pages.pdf Kumar, Manoj 2015. “Carbon Footprint Measurement at An
Opencast Project – A Case Study, project work submitted to WWF-India and NLU, Delhi for the partial fulfillment for the award of the certificate of post graduate diploma in environmental law and policy, pp. 1-62.
Lindzen, R.S. 1994. On the scientific basis for global warming scenarios. Environ. Pollut.83:125-134
Padhi, BRK. and Mishra, R. “Energy Conservation & Sustainable development at Baphlimali Bauxite Mine of M/s Utkal Alumina International Ltd.: A journey towards Excellence; National Seminar on Energy Conservation in Mining & Mineral Industries for Sustainable Development; IMEJ: Sep 2015, pp. 14-17
Singh, Sanjay Kumar, “CO2 emission from passenger transport in India 1950-51 to 2020-21”, table 6.
United States Department of Energy (USDOE). 1999. Carbon Sequestration: State of theScience, A working paper for road mapping future carbon sequestration R&D.USDOE, Washington, D.C.
www.unfccc.int/resource/docs/cop2/15a01.pdf (Framework Convention on Climate Change FCCC/CP/1996/15/Add.1, 29 October 1996, Report of the COP on its second session, held at Geneva from 8-19 July 1996)
43319 Manoj Kumar, Planning and developing the resources by carbon footprint assessment