ISSN Online: 2151-1969 ISSN Print: 2151-1950
Investigation of Vegetation Cover Change in
Sudan by Using Modis Data
Yousif Elnour Yagoub
1,2,3*, Zhongqin Li
1, Omer Said Musa
2, Muhammad Naveed Anjum
4,
Feiteng Wang
1, Chunhai Xu
1, Zhang Bo
31State Key Laboratory of Cryospheric Sciences/Tian Shan Glaciological Station, Northwest Institute of Eco-Environment and Resources, CAS, Lanzhou, China
2Department of Forest Protection and Conservation, Faculty of Forestry, University of Khartoum, Shambat, Sudan 3College of Geography and Environmental Science, Northwest Normal University, Lanzhou, China
4Division of Hydrology Water-Land Resources, Northwest Institute of Eco-Environment and Resources, CAS, Lanzhou, China
Abstract
The aim of this research paper is to investigate the land cover changes in Sudan during the period 2001-2013 by using the MODIS data and to identi-fy climatic factors influencing the land cover. SPSS v 17 software was used to investigate the correlation of climatic factors with vegetation cover; also ArcGIS v 10.2 software was used to analyze the NDVI data. The results in-dicate that the monthly average time scale, NDVI value curve distribution during the year, July to October as the center to both sides of decreasing ve-getation cover in other months. In the spatial distribution of mean NDVI in Sudan, a high value was found in the southern part. On the other hand, a low value of vegetation cover was found in northern part. NDVI spaces mean presenting features values: autumn followed by summer then winter. By calculation of average annual and seasonal-NDVI values, it was deduced that the main vegetation cover type was increasing in winter and summer seasons at the rates of 0.014/10a and 0.008/10a, respectively. While win-ter-NDVI was decreasing the rate of 0.001/10a and 0.026/10a in autumn and on the annual scale, respectively. Annual NDVI showed a significant degra-dation (area = 12705.7 km², 0.5% of total area) in the middle and eastern parts and significant improvement (area = 22485.4 km², 0.9 % of the total area) in the southern part of the country due to the increase in precipitation and decrease in temperature. Mean summer and autumn-NDVI showed a significant difference 0.01% significance level with mean summer and au-tumn precipitation (correlation coefficients = 0.955 and 0.953, respectively). While there was a significantly negative relationship between mean summer and autumn-NDVI with mean summer and autumn temperature at 0.01% significance level (correlation coefficients = −0.270 and −0.820, respective-ly).
How to cite this paper: Yagoub, Y.E., Li, Z.Q., Musa, O.S., Anjum, M.N., Wang, F.T., Xu, C.H. and Bo, Z. (2017) Investiga-tion of VegetaInvestiga-tion Cover Change in Sudan by Using Modis Data. Journal of Geo-graphic Information System, 9, 279-292.
https://doi.org/10.4236/jgis.2017.93017
Received: April 18, 2017 Accepted: June 6, 2017 Published: June 9, 2017
Copyright © 2017 by authors and Scientific Research Publishing Inc. This work is licensed under the Creative Commons Attribution-NonCommercial International License (CC BY-NC 4.0).
http://creativecommons.org/licenses/by-nc/4.0/
Keywords
Land Cover Changes, Climate Factors, NDVI, Sudan
1. Introduction
in drought intensity, as some areas became drier in summer and wetter in au-tumn and winter.
The objectives of this research are to investigate the land cover change in Su-dan during the period 2001-2013 by using the MODIS data, in addition, to in-vestigate climatic factors affecting the land cover as recommended by [10], for further research on the use of remote sensing in monitoring LULC changes in Sudan. Particularly these studies not only improve our understanding about LULC changes but also its implications in management and conservation efforts. LULC changes in the eastern part of Sudan by using multi-temporal Landsat da-ta showed that a significant extensive change of natural vegeda-tation patterns has occurred during 1987-2013 [11].
All records of monthly precipitation and temperature on a spatial resolution of 0.5 × 0.5 degree grids containing 845 stations were downloaded from Climatic Research Unit,
https://crudata.uea.ac.uk/cru/data/hrg/cru_ts_3.22/cruts.1406251334.v3.22/. ArcGIS v 10.2 software was used for analyzing and mapping the vegetation cov-er. SPSS software was used to investigate the correlation of climate factor with vegetation cover.
2. Material and Methods
2.1. Study Area
Figure 1 showed the map of Sudan. The country is located in the northeastern part of Africa. The area of the Sudan is 2,501,010 km2 (including both Sudan and South-Sudan), extending from latitude of 2˚40' - 22˚30'N and from longitude 21˚50' - 38˚50'E, altitude varies between 40 and 870 m. According to [12] during the hot summer, the maximum temperature exceeds 40˚C. As many other Sahe-lian African countries, Sudan is a drought prone area. Findings indicate that drought has become more recurrent in recent decades, of which those of the early to mid-1970s, mid-1980s; early 1990s and early 2000s can be noted as common drought years and were among the driest 10 years in the central region of Sudan [13]. Sudan expanded its agricultural production mainly through an increase in rain-fed cropland, 42 percent under large-scale mechanized agricul-ture and the remainder under small-scale traditional cultivation, and kept its per capita total crop area at about 0.49 hectares which is quite high by regional and global standards [14].
2.2. Normalized Difference Vegetation Index (NDVI)
Figure 1. The distribution of meteorological stations in study areas.
used to download the NDVI value. A vegetation index is an indicator that de-scribes the greenness, the relative density and health of vegetation for each pic-ture element (pixel) in a satellite image. Although there are several vegetation indices, one of the most widely used is the Normalized Difference Vegetation Index (NDVI), NDVI values range from 1.0 to −1.0.
2.3. Linear Trend (Slope)
Linear regression trend analysis by using ArcGIS v 10.2 software can simulate trends in each grid [15]; and can reflect different periods of vegetation cover spatial trends characteristics. Formula:
( )
1 1 1
2 2
1 1
Slope
n n n
i i
i i i
n n
i i
n i NDVI i NDVI
n i i
θ = = =
= =
× × −
=
× −
∑
∑ ∑
∑
∑
(1)increasing, otherwise it is decreasing. This study is categorized into a significant increase, slight increase, essentially the same, slightly reduced and a significant reduction, and the statistics of the study area in 2001-2013 vegetation changes and the percentage of each class area.
2.4. Correlation
Correlation between geographical elements, it is possible to explain the closeness of the relationship between geographic features, and closely related to the degree of mutual determination between geographical elements, mainly through the correlation coefficient calculation. In this research, study of NDVI and average annual temperature and annual precipitation by-pixel spatial correlation, the correlation coefficient used to reflect the sequence of climatic factors and NDVI degree of correlation, the correlation coefficient value is between -1and 1. For-mula:
(
)(
)
(
)
(
)
1 2 2 1 1 n i i i xy n n i i i ix x y y
r
x x y y
= = = − − = − −
∑
∑
∑
(2)where: n is the number of time series, x and y are two elements of the correla-tion, and represent the average of the two elements of the sample values, and fi-nally delineated thresholds based on the number of data, the results of the cor-relation level of significant.
3. Result and Discussions
Sudan has complex and diverse climate types, uneven distribution of water re-sources and serious water shortages in the northern part, harsh natural condi-tions and a high frequency of drought. A drought is one of the most important natural disasters in Sudan. Drought disasters in Sudan agricultural production especially for relatively large impact not only affect the stability and security of food production, but also is a one of the main factors restricting the develop-ment of Sudan economy.
3.1. Vegetation Cover of Monthly Time Scale
Figure 2 showed the vegetation variation in Sudan, on monthly average time scale, NDVI value showed a peak curve distribution in the year. July to Octo-ber as the center to both sides of decreasing vegetation cover in descending order of the year, which corresponds to the average monthly vegetation NDVI values were: 0.2, 0.19, 0.19, 0.2, 0.21, 0.26, 0.32, 0.36, 0.36, 0.32, 0.26 and 0.22 for the months from January to December, respectively. Overall, in the grow-ing season (July to October), the highest vegetation cover was recorded in au-tumn.
3.2. Spatial Distribution of Vegetation Cover
Figure 2. The distribution of the mean monthly-NDVI in Sudan during 2001-2013.
Figure 3. Spatial distribution of mean annual and seasonal-NDVI in Sudan during 2001-2013.
0 0.05 0.1 0.15 0.2 0.25 0.3 0.35 0.4
Jan Feb Mar Apr May Jun Jul Aug Sep Oct Nov Dec
NDVI
v
a
lu
e
[image:6.595.99.541.200.713.2]The vegetation cover is high in the south of Sudan due to humid climatic zone near the equator; the vegetation cover is widely distributed in woodland, grass-lands and crops, vegetation in forests, and grassgrass-lands with a high NDVI value. The Northern part has a low value of vegetation cover; NDVI is negative in areas covered by sand, rock and desert due to their location in the biggest desert in the world. Figure 4 showed the distribution of the mean monthly NDVI in Sudan
Figure 4. Trend of different vegetation types, annual and seasonal-NDVI change in Su-dan 2001-2013.
NDVI, y = -0.0001x + 0.2583 R² = 0.0014
0 100 200 300 400 500 0.23 0.24 0.24 0.25 0.25 0.26 0.26 0.27 0.27 0.28
2001 2003 2005 2007 2009 2011 2013
P re cip ita tio n NDVI Precipitation NDVI 线性(NDVI)
Annual-NDVI
y = 0.0014x + 0.2109 R² = 0.1735
0.17 0.18 0.19 0.20 0.21 0.22 0.23 0.24
2001 2003 2005 2007 2009 2011 2013
NDVI
Winter-NDVI
y = 0.0008x + 0.2122 R² = 0.0634
0.17 0.18 0.19 0.20 0.21 0.22 0.23 0.24
2001 2003 2005 2007 2009 2011 2013
NDVI
Summer-NDVI
y = -0.0026x + 0.3518 R² = 0.1624
0.30 0.31 0.32 0.33 0.34 0.35 0.36 0.37
2001 2003 2005 2007 2009 2011 2013
NDVI
during 2001-2013 (showing different trends in autumn follow by summer then winter). The NDVI has different value due to seasonal differences in the degree of green crops and woodland, grassland due to seasonal changes in climatic fac-tors. By calculating the average annual and seasonal-NDVI value, it was found that the main vegetation cover type has an upward trend at a rate of 0.014/10a and 0.008/10a, for winter and summer, respectively. While NDVI has a down-ward trend at a rate of 0.001/10a and 0.026/10a for annual and autumn, respec-tively.
3.3. Spatial Variation of Vegetation Cover
3.3.1. Annual
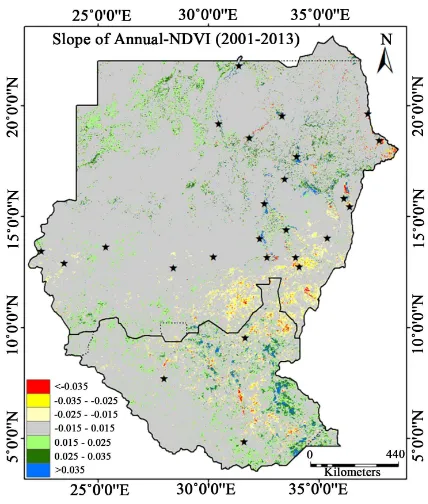
Based on principle slope (calculated by linear regression) value (between −1 and 1) of mean annual-NDVI in Sudan during 2001 - 2013, the land was reclassified from low to high values into seven categories: significant degradation, moderate degradation, mild degradation, no change, mild improvement, moderate im-provement and significant imim-provement. Figure 5 and Table 1 showed the spa-tial variation of vegetation cover: significant degradation area is 12705.7 km² (accounts to 0.5% of the total area) and most of this area is located in the middle and eastern part; moderate degradation area is 28343.4 km² (accounts to 1.1% of the total area); mild degradation area is 94,550.6 km2 (accounts to 3.8% of the total area); no change area is 2,118,701.5 km2 (accounts to 84.7% of the total area); mild improvement area is 150,225.9 km2 (accounts to 6.0% of the total area); moderate improvement area is 73,997.4 km2 (accounts to 3.0% of the total area) and significant improvement area is 22,485.4 km2 (accounts to 0.9% of the total area).
[image:8.595.266.480.455.707.2]Table 1. Statistical result of trend in mean annual-NDVI change simulated in Sudan during 2001-2013.
Category θSlope range
Mean NDVI Area Km² % of total area 1 Significant degradation θ < −0.035 12705.7 0.5 2 Moderate degradation −0.035 < θ > −0.025 28343.4 1.1 3 Mild degradation −0.025 < θ > −0.015 94550.6 3.8 4 No change −0.015 < θ > 0.015 2118701.5 84.7 5 Mild improvement 0.015 < θ > 0.025 150225.9 6.0 6 Moderate improvement 0.025 < θ > 0.035 73997.4 3.0 7 Significant improvement θ > 0.03 22485.4 0.9
Total 2501010 100
3.3.2. Seasonal
The mean vegetation cover in Sudan during 2001-2013 is calculated by using a linear regression analysis. Before the seasonal analysis of vegetation, the reclassi-fied NDVI was further divided into seven categories (from low to high values): significant degradation, moderate degradation, mild degradation, no change, mild improvement, moderate improvement and significant improvement. Fig-ure 6 and Table 2 showed Sudan mean seasonal-NDVI. The spatial variation of significant degradation is 0.9%, 0.9%, and 5.1% of the total area in winter, sum-mer and autumn, respectively. The high change of degradation in autumn is lo-cating in the middle-eastern part of Sudan due to the decrease in precipitation and increase in temperature. While, the significant improvement is 2.2%, 3.3% and 2.0% of the total area in winter, summer and autumn, respectively. The high improvement is located in the southern part of Sudan due to the increase in pre-cipitation and decrease in temperature. No change is 80.8%, 80.5% and 71.3% of the total area in winter, summer and autumn, respectively.
3.4. Relationship between Vegetation Cover and Climatic Factors
[image:9.595.210.540.102.273.2]Table 2. Statistical result of trend of mean seasonal-NDVI change simulated in Sudan during 2001-2013.
Category θSlope range
Winter Summer Autumn Area Km2 % Area Km² % Area Km2 %
1 degradation Significant θ < −0.035 21,307.1 0.9 23439.6 0.9 128506.4 5.1
2 degradation −0.035 < θ > −0.025 24,978.6 1.0 34998.9 Moderate 1.4 112684.1 4.5
3 degradation −0.025 < θ > −0.015 58,275.7 2.3 72830.1 Mild 2.9 192501.9 7.7
4 No change −0.015 < θ > 0.015 2,020,584.8 80.8 2014143.7 80.5 1782067.7 71.3
5 improvement Mild 0.015 < θ > 0.025 210,813.6 8.4 144869.6 5.8 134926.4 5.4
6 improvement Moderate 0.025 < θ > 0.035 110,011.8 4.4 128752.2 5.1 100675.8 4.0
7 improvement Significant θ > 0.03 55,038.6 2.2 81975.8 3.3 49647.8 2.0
[image:10.595.213.538.101.327.2]Total 2,501,010 100 2501010 100 2501010 100
Table 3. Correlation coefficients of NDVI with climate data using SPSS software in Sudan during 2001-2013.
Correlation Pearson correlation P value, Sig. (2-tailed) 1 Winter-NDVI with precipitation 0.735** 0.000 2 Winter-NDVI with temperature 0.739** 0.000 3 Summer-NDVI with precipitation 0.955** 0.000 4 Summer-NDVI with temperature −0.270** 0.000 5 Autumn-NDVI with precipitation 0.953** 0.000 6 Autumn-NDVI with temperature −0.820** 0.000 7 Mean-NDVI with precipitation 0.963** 0.000 8 Mean-NDVI with temperature 0.079* 0.020
**Correlation is significant at the 0.01 level (2-tailed); *Correlation is significant at the 0.05 level (2-tailed).
[image:10.595.210.541.373.539.2]Figure 6. Spatial-temporal change characteristic of mean seasonal-NDVI based on the Slope in Sudan during 2001-2013.
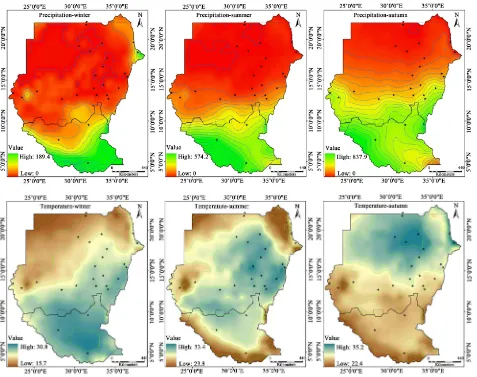
Figure 7. Spatial and temporal distribution of the mean seasonal trend of temperature and precipitation in Sudan during 2001-2013.
3.5. Correlation of NDVI with Climatic Factors
cli-matic factors in Sudan, the mean annual precipitation and temperature data of 845 sites in recent 13 years was used. Using correlation method, grid related calculations are made in ArcGIS v 10.2 software, as shown in Figure 8. Table 3 showed that there is a high significant positive relationship between mean an- nual-NDVI and mean annual precipitation at the 0.01% significance level (cor-relation coefficient 0.963** with p-value 0.00), there is a significant positive rela-tionship between the mean annual-NDVI and mean annual temperature at the 0.05% significance level (correlation coefficient 0.079* with P value 0.02). To test the relationship of vegetation cover with annual precipitation and temperature, eight grades according to the principle of division of significance test at different threshold points were developed. Table 4 showed the statistics of the correlation
Table 4. The statistics of correlation coefficient between mean annual-NDVI and climate data factors in Sudan during 2001-2013.
Category Correlation range Precipitation Temperature Area Km2 % Area Km2 %
1 A significant negative correlation <-0.03 1724.7 0.1 6092.4 0.2 2 High negative correlation −0.03 - −0.02 2811.9 0.1 13,776.8 0.6 3 Moderate negative correlation −0.02 - −0.01 20,583.4 0.8 119,858.2 4.8 4 Low negative correlation −0.01 - 0.00 469,668.1 18.8 1,203,204.6 48.1 5 Low positive correlation 0.00 - 0.01 1,733,614.2 69.3 1,102,266.6 44.1 6 Moderate positive correlation 0.01 - 0.02 240,514.2 9.6 45,983.9 1.8 7 Highly correlated 0.02 - 0.03 22,945.4 0.9 6061.8 0.2 8 A significant positive correlation >0.03 9148.2 0.4 3765.7 0.2 Total 2,501,010 100 2,501,010 100
coefficient between mean annual-NDVI and climate data factor in Sudan during 2001-2013. The correlation coefficient between mean annual-NDVI and preci-pitation is a significant negative correlation, high negative correlation, moderate negative correlation and low negative correlation: 0.1, 0.1, 0.8, and 18.8% of the total area, respectively. While low positive correlation, moderate positive corre-lation, high positive correlation and significant positive correlation is: 69.3%, 9.6%, 0.9% and 0.4% of the total area, respectively. The correlation coefficients between mean annual-NDVI and temperature are significantly negative, high negative, moderate negative and low negative: 0.2%, 0.6%, 4.8% and 48.1% of the total area, respectively. While low positive correlation, moderate positive corre-lation, highly positive correlation and significant positive correlation are: 44.1%, 1.8%, 0.2% and 0.2% of the total area, respectively.
4. Conclusion
Sudan is highly vulnerable to climate change and climate variability. Most drought studies focus on quantifying drought at the regional or global scale. The declination of grassland and palatable forbs resulted in the appearance of invad-er grasses that are unpalatable to livestock and can lead to livestock death and emergency slaughter which can result in economic losses and affect the livestock herders. This research showed successfully contribution of MODIS NDVI 250 m for the detection of the vegetation cover distribution in Sudan. Climatic factors have high effects on land cover. In spatial scale distribution of mean NDVI in Sudan, it is deduced that a high value of vegetation cover is in the southern part and a low value of that in northern part. Precipitation and temperature are the main factors which influence the change of vegetation cover and the impact is not same in different areas. The changes of vegetation cover were primarily in-fluenced by temperature followed by precipitation. This information is of high value for setting up adaptation and mitigation strategies related to forest and natural resources.
Acknowledgments
The present research was supported by the National Natural Science Foundation of China (Grant no. 41471058 and 41641003), the NSFC project (grant number: 91425303), and the SKLCS funding (SKLCS-ZZ-2017).
References
[1] Peter, J.L. (1983) Sub-Saharan Rainfall Update for 1982: Continued Drought. Jour-nal of Climatology, 3, 419-422.
http://onlinelibrary.wiley.com/doi/10.1002/joc.3370030410/full
[2] UNEP (1992) World Atlas of Desertification. Edward Arnold, Sevenoaks, 68 p. [3] Zakieldeen, S.A. (2007) Vulnerability in Sudan. Tiempo Bulletin 62. Online bulletin
at:http://www.tiempocyberclimate.org
[4] El Sammani, M. (1978) Gaps in the Water Provision Map of the Sudan. Sudan Notes and Records, 59, 97-106.
and Maximum Surface Temperatures over Eastern Africa. Journal of Climate, 13, 2876-2886. https://doi.org/10.1175/1520-0442(2000)013<2876:RTOMAM>2.0.CO;2 [6] Eldredge, E. Khalil, S.E., Nicholds, N., Abdalla, A.A. and Rydjeski, D. (1988)
Changing Rainfall Patterns in Western Sudan. Journal of climatology, 8, 45-53. http://onlinelibrary.wiley.com/doi/10.1002/joc.3370080105/full
[7] Walsh, R.P.D., Hulme, M. and Campbell, M.D. (1988) Recent Rainfall Changes and Their Impact on Hydrology and Water Supply in the Semi-Arid Zone of the Sudan, The Geographical Journal, 154, 181-198. https://doi.org/10.2307/633845
[8] Ayoub, A.T., (1998) Extent, Severity and Causative Factors of Land Degradation in the Sudan. Journal of Arid Environments, 38, 397-409.
http://www.sciencedirect.com/science/article/pii/S0140196397903463
[9] Yagoub, Y.E., Li, Z., Musa, O.S., Wang, F., Anjum, .M.N., Bo, Z. and Ding-min, J. (2017) Detection Of Drought Pattern in Sudan Using Standardized Precipita-tion-Evapotranspiration Index (SPEI). International Journal of Recent Advances in Multidisciplinary Research, 4, 2546-2554.
http://www.ijramr.com/sites/default/files/issues-pdf/1348.pdf
[10] Yagoub, Y.E., Bo, Z., Ding-min, J., Jahelnabi, A.E. and Fadoul, S.M. (2015) Land Use and Land Cover Change in Northeast Gadarif State: Case of El Rawashda For-est, Sudan. Journal of Geographic Information System, 7, 140-157.
https://doi.org/10.4236/jgis.2015.72013
[11] Yagoub, Y.E., Musa, O.S., Siddig, A.A., Bo, Z., Li, Z. and Wang, F. (2017) Assessing the Impacts of Land Use Changes on Vegetation Cover in Eastern Sudan. Interna-tional Journal of Research in Agricultural Sciences, 4, 70-75.
https://ijras.org/administrator/components/com_jresearch/files/publications/IJRAS _505__FINAL.pdf
[12] UNESCO (1977) United Nations Educational, Scientific and Cultural Organization. Map of the World Distribution of Arid Regions. MAB Technical Notes 7, Paris. [13] Elagib, N.A. (2009) Assessment of Drought across Central Sudan Using UNEP
Dryness Ratio. Hydrology Research, 40, 481-494. https://doi.org/10.2166/nh.2009.016
[14] Ministry of Environment and Tourism (1996) Towards a National Plan for Envi-ronmental Action in the Sudan (in Arabic). Miniistry of Environment and Tourism, Khartoum.
[15] Stow, D., Petersen, A. and Hope, A. (2007) Greenness Trends of Arctic Tundra Ve-getation in the 1990s: Comparison of Two NDVI Datasets from NOAA AVHRR Systems. International Journal of Remote Sensing, 28, 4807-4822.
Submit or recommend next manuscript to SCIRP and we will provide best service for you:
Accepting pre-submission inquiries through Email, Facebook, LinkedIn, Twitter, etc. A wide selection of journals (inclusive of 9 subjects, more than 200 journals)
Providing 24-hour high-quality service User-friendly online submission system Fair and swift peer-review system
Efficient typesetting and proofreading procedure
Display of the result of downloads and visits, as well as the number of cited articles Maximum dissemination of your research work
Submit your manuscript at: http://papersubmission.scirp.org/