Munich Personal RePEc Archive
A Life-Course Perspective on Gender
Differences in Cognitive Functioning in
India
Velamuri, Malathi and Onur, Ilke
October 2014
A Life-Course Perspective on Gender Differences in Cognitive
Functioning in India
Ilke Onur∗and Malathi Velamuri†‡
October, 2014
∗University of South Australia, Australia; email: [email protected]
†(Corresponding author)Visiting faculty, Chennai Mathematical Institute and Madras School of Economics; email:
‡The authors gratefully acknowledge financial support from the University of South Australia. They thank Petko
Abstract
We examine gender differences in four measures of cognitive function among older individuals
in India, using the 2010 pilot wave of the Longitudinal Aging Study of India (LASI) survey. We use a life-course approach and estimate the impact of circumstances in childhood, choices
in adulthood and current circumstances on current cognitive functioning. Our objective is to
understand the correlates of cognitive functioning in later-life more generally, and of female
dis-advantage in particular. We observe a female disdis-advantage across all cognitive measures in the
raw data. Our estimates indicate that educational attainment and employment status history
can account for the entire female disadvantage in verbal skills, but a sizable and significant gap
remains in the other cognitive measures even after controlling for these variables. Notably, our
estimates indicate that circumstances in childhood have an impact on later-life cognition. A
decomposition analysis reveals that the predicted cognition gap is driven by differences in
char-acteristics between men and women, as well as the asymmetric returns to these charchar-acteristics. We conclude that policies aimed at correcting the gender imbalance in educational outcomes
may not be sufficient to close the gender gaps in cognition. In turn, this has serious implications
for a rapidly aging society like India.
JEL Classification: J16, C21, I12, N350
Keywords: Cognition, Gender differences, Early-life conditions, Education, Oaxaca-Blinder
1
Introduction
The impact of childhood deprivation in food, education and health on later-life cognitive and
non-cognitive skills, educational attainment, health, income and overall quality of life has been
well-documented.1 In a series of papers, Heckman and co-authors characterize the learning process that has implications for the optimum timing of investment in human capital.2 These characteristics
imply that the returns to investing in skill formation early in the life-cycle (in utero and in the first
couple of years) are very high and that the family environment is more important than the school
environment for skill acquisition over the life-cycle.
Gender-based discrimination in the allocation of cognitive resources in childhood adds another
neg-ative dimension to the relationship between poverty and well-being over the life-cycle. Research
from high-income countries shows that women make large gains in health, income and cognition
when living standards improve and they have better access to food, education, employment
oppor-tunities and healthcare (Hoynes et al., 2012; Flynn, 2012). A recent cross-country comparison of
gender differences in cognition over time indicate that cognitive performance of the population
in-creased in Northern Europe as these countries grew richer. Notably, women’s cognitive performance
has surged, causing the gender gap to narrow in tasks that men used to have a distinct advantage
in (numerical skills), and widening the gap in skills where women have always had an advantage
(verbal skills and short-term memory) (Weber et al., 2013). These trends were also evident in the
relatively poorer countries of Southern Europe, but on a more modest scale.
India presents a complex web of inequalities along dimensions of caste, religion, geography and
especially gender.3 Paradoxically, years of stable economic growth have been accompanied by a deterioration in some social development indicators. For instance, despite averaging an annual GDP
growth rate of 6% since 1980 and about 10% for many years in the last decade, India’s sex ratio
(number of girls for every 1000 boys in the 0-6 age range, for example) has declined substantially
1
See Van den Berg et al., 2006; Paxson and Schady, 2007; Zhang et al., 2008; Case and Paxson, 2009; Hoynes et al., 2012; Doblhammer et al., 2013; Layard et al., 2013; Lee et al., 2014
2Cunha et al., 2006; Heckman, 2006; Cunha and Heckman, 2007
between 1990 and 2005 (Jha et al., 2011). There is also evidence of persistent underinvestment in
girls in terms of nutrition, health care and education, all of which are crucial factors for healthy
cognitive functioning over the life-cycle.4
We use the pilot wave of the Longitudinal Survey of Aging in India (LASI) to examine gender
differences in four measures of cognitive functioning among older (45+) Indians. We attempt
to answer the following questions: (1) What is the extent of female disadvantage in cognitive
functioning in India across different measures of cognition?; (2) In addition to current circumstances,
what impact do childhood socioeconomic status and choices made in adulthood have on cognitive
functioning in middle-age and old-age?; and (3) How much of the gender gap in cognition is due
to differences in attributes between men and women, and how much is due to differences in the
returns to these attributes?
We find a sizable female disadvantage across all four measures of cognitive skills in the raw data. We
adjust for various individual and household characteristics, sequentially adding sets of variables that
capture aspects of childhood socioeconomic status (SES), choices made in adulthood and current
socioeconomic circumstances including health status. Adding these controls eliminates the gender
gap in one measure of cognitive functioning; sizable gaps remain for the other three measures.
We find significant geographic variation in cognitive function across states. Consistent with many
other studies for developing countries, we also find that education plays a big role in explaining
the gender cognition gap. However, childhood circumstances continue to affect later-life cognition,
even after we adjust for age, education and a rich array of other characteristics. The decomposition
analysis of the predicted gender gaps in cognition reveals that the relative contributions of gender
differences in attributes on the one hand and gender differences in returns to attributes on the
other, vary across the different measures of cognition.
Our paper adds to the literature on the levels and patterns of cognitive functioning in developing
countries, which has only begun to emerge recently. In contrast to trends in developed countries,
evidence from developing countries shows that men outperform women on every measured aspect
of cognitive functioning. Papers documenting this include Alderman et al.,1996 (Pakistan); Zhang,
2006 (China); Nguyen et al., 2008 (Latin America and the Caribbean); Yount, 2008 (Egypt);
Zunzunegui et al., 2009 (Latin America and the Caribbean); Maurer, 2010 and Maurer, 2011
(Latin America and the Caribbean); Onadja et al., 2013 (Burkina Faso); Lee et. al., 2014 (India).
With the exception of Zunzunegui et al. (2009) and Onadja et al. (2013), all the studies find that
gender differences in educational attainment explain a large portion of the gender gap in cognition.
All except Zhang (2006) and Lee et al. (2014) take a life-course perspective in explaining the gender
cognition gap. Among these papers, other than Zunzunegui et al. (2009), all find evidence that
childhood SES affects later-life cognition.
These findings have important implications for developing countries, which face formidable
chal-lenges in expanding economic opportunities for their working-age populations for achieving strong,
sustained and balanced economic growth in a globalized world (ILO, 2013). Cognitive skills have
become increasingly important for work tasks over time (Broadberry, 1997; Spitz-Oener, 2006;
Skirbekk, 2008). Schmidt and Hunter (1998) show that an individual’s test scores on cognitive
ability are more highly correlated with her labor market productivity than any other observable
characteristic. Education, in addition to increasing cognitive skills and labor-market productivity,
has significant spillover effects on non-market aspects of the individual’s life and on society.
Gross-man (2006) has emphasized the causal role of education in increasing productivity in a number
of non-market outcomes such as consumption, savings, own health, fertility and child health and
cognitive development. Michael (1973) estimates that education raises non-market productivity by
three-fifths as much as it raises market productivity.
Persistent cognition gaps portend deeper challenges for aging economies, as poor cognition is
associ-ated with a higher prevalence of age-relassoci-ated morbidities, functional limitations and mental decline.
Many studies document a higher likelihood of dementia among women in Latin America, Africa and
Asia (Kalaria et al., 2008). While India is currently a young country, it is projected to experience
a dramatic increase in the elderly dependency ratio by 2050 and demonstrate all the symptoms
of an aging society (Scommegna, 2012). Without urgent intervention to redress the systematic
underinvestment of resources in girls and women, the combination of lower cognitive functioning
and a higher life expectancy means a higher disease burden, a greater level of dependency and a
lower quality of life for Indian women in old age.
skills using the same data set (LASI) that they do. However, our paper differs from theirs in many
aspects. We explicitly employ a life-course perspective to understand how gender differences in
access to resources across different stages in life contribute to later-life cognitive differences between
men and women. This allows us to identify specific childhood circumstances that are associated
with later-life cognition. Lee et al. (2014) use two measures of cognitive function - episodic memory
and a global cognitive summary measure that combines numerical skills and orientation functions.
We use four different measures of cognitive function - episodic memory, verbal skills, numerical
skills and orientation. Since evidence from developed countries indicates that men and women
tend to have different cognitive competencies, we choose to study gender differences across various
measures of cognition.5 Moreover, cognitive science tells us that each of these cognitive functions measure different aspects of intelligence. For instance, verbal abilities are classified as crystallized
intelligence while numerical skills and working memory are aspects of fluid intelligence. Crystallized
intelligence increases cumulatively with experience while fluid intelligence peaks at adolescence and
then declines, though the rate of decline varies across individuals (Nisbett et al., 2012). Lee et al.
(2014) examine the variation of gender differences by region (North versus South). Their results
indicate a regional disadvantage in cognition; they find that the two Northern states (Punjab and
Rajasthan) do worse on their two chosen measures of cognitive skills, compared to the Southern
states (Kerala and Karnataka). We estimate state-specific effects for the four states in the data,
and do not find a regional divide. The Northern state of Punjab outscores the other states on
episodic memory while Kerala in the South outperforms the other three states in verbal skills. A
notable difference is that we decompose the predicted gender cognition gap, to understand the
importance of differences in attributes among men and women, relative to gender differences in
the returns to these attributes. Lee et al. (2014) use the biometric module of the data, to include
well-documented risk factors such as under-nutrition and emotional distress in their analysis. We
are constrained in this respect by lack of access to data in the biometric module. Nevertheless, we
see our paper as complementing Lee et al. (2014). To our knowledge, ours is only the second paper
to use the LASI data set to examine gender gaps in cognitive skills in India.
All the papers cited above that use data from developing countries, including ours, use
sectional methods, and the findings cannot therefore be interpreted as causal. Importantly, selection
into education based on childhood cognitive ability may impart an upward bias to the
education-cognition gradient. Nevertheless, the weight of the combined evidence from all the research points
to the existence of a pathway linking early life conditions to later-life cognitive abilities, often
operating through education.
The rest of the article is organized as follows: Section 2 describes the data and presents some
descriptive statistics. We present the empirical strategy in Section 3 and results in Section 4.
Section 5 concludes.
2
Data and Descriptives
We use the 2010 pilot wave of the Longitudinal Aging Study of India (LASI) survey. The LASI
is modeled on the Health and Retirement Survey (HRS) of the United States that was launched
in 1992, and is designed for similar objectives - to understand the challenges and opportunities
of an aging population, with a particular focus on changes in labor force participation and health
transitions of older individuals.6 LASI is designed to be a nationally representative longitudinal survey of India’s aging population 45 years or older and their spouses.7 LASI covers demographic,
health, economic, and psychosocial topics relevant to studies on aging. The first wave was conducted
in 2012 but the data has not yet been released for public use.
We use the pilot wave of LASI that was conducted in 2010 in four states - Punjab and Rajasthan
in the North and Kerala and Karnataka in the South. A representative sample was drawn from
the four states (using the 2001 Indian Census). In addition to geographic variation, these states
capture socioeconomic and cultural differences in India as well (Lee et al., 2014; Pal and Palacios,
2008). In order to capture a number of socioeconomic conditions, primary sampling units (PSUs)
were stratified across urban and rural districts within each state. The survey randomly sampled
1,546 households from these stratified PSUs, and among them, households with a member at least
6
Sister surveys to the HRS were launched in many other countries - England, Ireland, Mexico, Korea, China, Japan and a number of countries in continental Europe.
7
45 years old were interviewed. Data were collected from 1,683 individuals during October through
December of 2010. Our analysis accounts for the complex survey design features of the data.
The LASI questionnaire consists of two main sections: the household interview and the individual
interview. The household module asks about household finances, expenditure, consumption, and
assets and can be answered by any knowledgeable household member 18 years of age or older. The
household response rate was 88.6%. The individual interview is only for age-eligible household
members and their spouses, and can be answered by a proxy respondent if necessary (we exclude
proxy respondents in this analysis). The individual response rate was 91.7%. We further restricted
the analysis in this paper to 1,486 respondents who are at least 45 years or age; spouses under age
45 were excluded.8
As part of a comprehensive health module, the LASI administered a cognitive function exam to
respondents that included tests of episodic memory, verbal fluency, numerical skills and orientation.
These tests are based on the mini-mental state examination (MMSE) or Folstein test, which is now
an internationally accepted standard for studying cognitive impairment. It is commonly used to
screen for dementia and to document individuals’ response to treatment over time.9 These tests
have been validated for use among low-literacy populations like those in India (Arokiasamy et al.,
2012).
Episodic memory refers to our ability to consciously recall specific events and situations from the
past.10 The LASI pilot survey administered a test of episodic memory to respondents, including
both immediate and delayed word recall tests. Survey staff read aloud ten words to respondents and
asked them to recall these words when the interviewer finished (immediate recall). Respondents
were given a score between 0 and 10, depending on how many words they recalled. They were again
asked to recall these words at the conclusion of the cognitive functioning tests (delayed recall),
8
The survey questions were translated into the languages common in these states (i.e., Hindi, Malayalam, Kannada, Punjabi), and the interview was done in the language of respondents choice.
9
See Folstein et al., 1975. 10
with the same scoring pattern. Following Lee et al. (2014), we added the scores for immediate and
delayed recall, to create a summary score for episodic memory, ranging from 0 to 20.
Verbal fluency test is one in which participants have to say as many words as possible from a
category in a given time. This category can be semantic, such as animals or fruits, or phonemic,
such as words that begin with a specific letter. The LASI tested verbal fluency based on how many
unique animals (including birds) the respondents could name in 1 minute.11 The scores on this test ranged from 0 to 50. Numerical ability tests among older populations include the ability to count
backwards and to do simple computation problems. The LASI tested for numerical ability by asking
respondents (1) to count backwards from 20, and if they got this right, (2) to count backwards
again from 100; (3) to subtract 7 from 100 and then again from 93 for a total of five iterations
(popularly referred to as serial 7s); and (4) 2 simple computation problems.12 Respondents earned
a score of 1 for each correct answer and a 0 for wrong answers, giving a range on this measure of a
minimum of 0 and a maximum of 9. Orientation refers to the cognitive ability of an individual to
know who they are, where they are, and what day and year it is. Disorientation is also, typically,
an indicator of early stage Alzheimer’s disease. LASI respondents were asked to name the current
date (date of month, day of week, month, year) with reference to either the English calendar or the
vernacular calendar. They were also asked to name the prime minister. We created an indicator
variable that equals 1 if respondents answered either the current date or the name of the prime
minister correctly, and 0 if they got both wrong.
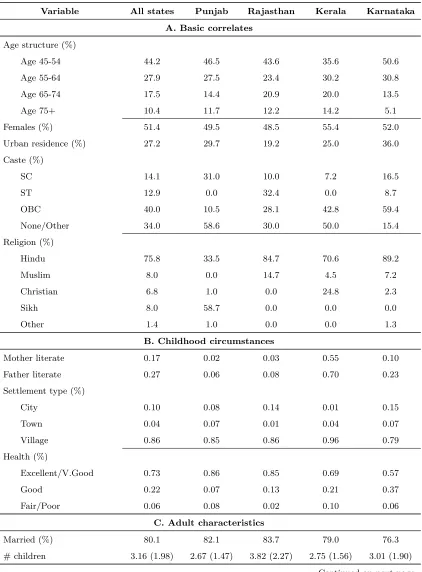
Table 1 presents the demographic profile of our sample of LASI respondents who are at least 45
years of age. We classify variables according to (i) basic correlates; (ii) childhood circumstances; (iii)
adult characteristics; and (iv) current circumstances, in keeping with our decision to use a life-course
approach to study cognitive functioning. Variables in Panel A represent the basic characteristics
11
The surveyor gave the following instruction to the respondents: “Now we are going to ask you to think of animals and name as many as you can. If you wish you may also include birds along with animals. Count categories of animals (e.g., dogs), as well as specific types (e.g., collie, terrier) as correct. Any members of the animal kingdom, real or mythical, are scored as correct, except repetitions and proper nouns (e.g., Mickey Mouse). I am going to give you one minute and I want to see how many animals you can name.”
12
of the sample. The age distribution reflects the fact that India is still a young nation. Kerala has
the highest proportion of older individuals, and this follows from the fact that the state entered
into the second phase of demographic transition - marked by a declining birth rate and falling
levels of mortality - in the late 1960s (Kumar, 1994), well ahead of other states in India. Women
are over-represented in the Southern states, and this is presumably a consequence of the favorable
sex-ratios in South India, relative to the North. The sample is drawn largely from rural areas, but
here again, there is variance across states - Karnataka is considerably more urbanized compared
to Rajasthan, for instance. The distribution of caste and religious groups also varies across states.
Punjab has a notably higher proportion of Scheduled Castes (SCs) while the Scheduled Tribes
(STs) are over-represented in Rajasthan.13 Sikhs represent nearly 60% of the population in Punjab but they have negligible presence in other states. Christians are a dominant group in Kerala but
not in the other states. The predominant religious group in Rajasthan and Karnataka is Hindu.
These differences in demographic profiles across states provide rich variation for the relationships
of interest in this paper.
Variables in Panel B in Table 1 reflect some of the childhood circumstances of the respondents.
Kerala is an outlier in terms of both mother’s and father’s literacy status. In all states, mother’s
literacy rates are considerably smaller than the father’s, reflecting the historic underinvestment in
girls’ education. The predominant share of the sample spent their childhood in rural areas, as is
evident from the distribution of the type of settlement in childhood. There is some heterogeneity
in self-reported health in childhood, though most of the sample appear to have been healthy as
children.
Panel C reveals that over three-fourths of the sample is married in all states. Both Punjab and
Kerala are among the states with the lowest fertility rates in India, and this is reflected in the
average number of children per married respondent. There is significant heterogeneity in literacy
levels and educational attainment. Kerala stands apart, with 88% literacy and a sizably bigger
proportion of people with above primary school education. In contrast, in the Northern states,
well above 50% of the sample has no formal schooling. Just over one-fifth of the sample from the
13
Southern states (Kerala and Karnataka) have ever worked for pay for at least 6 months in the past.
The corresponding shares are much lower for the Northern states.
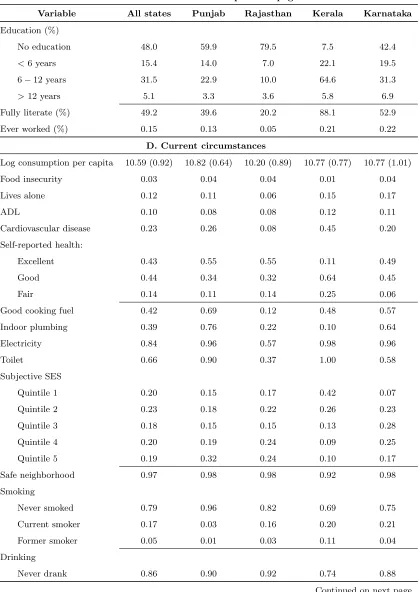
Variables in Panel D reflect some aspects of current living conditions of households in our sample
that reveal both the socioeconomic status as well as the quality of life of the average household.
Descriptive statistics on some lifestyle variables are also presented. Large inter-state variation
in per capita consumption reflects significant differences in economic prosperity across states.14 Despite the variance in household consumption across states, a very small proportion of households
report experiencing food insecurity.15 A significantly higher fraction of respondents live alone (by themselves) in Kerala and Karnataka, compared to Rajasthan and Punjab.
ADL is a binary indicator reflecting limitations in activities of daily living.16 About 10% of the sample report having difficulty with an ADL, with the fraction being slightly over 10% in the
Southern states and lower than 10% in the 2 Northern states. There is much higher variation in
reported rates of CVD (cardiovascular disease - coded as 1 if respondent was diagnosed with any
of the following: hypertension, diabetes, congestive heart disease, angina, coronary heart disease,
or has had a stroke). Kerala reports a significantly higher rate of CVD (45%), compared to the
other states. While some of this difference might reflect a relatively older population in the state,
it is also likely that people in Kerala visit the doctor more regularly. Perhaps as a consequence of
this, a notably higher fraction of people in other states report being in excellent health, compared
to Kerala.
14
LASI uses the OECD modified equivalency scale to derive the household per capita consumption measure. This scaling assigns different weights to household members by age: household heads are given a weight of 1, additional adults are given 0.7, and children (under 16) are given 0.3. See http://www.oecd.org/eco/growth/OECD-Note-EquivalenceScales.pdf
15
The food insecurity variable was coded as 1 if the response was affirmative for at least one of the following 4 questions: (1) In the last 12 months, did you (or other adults in your household) ever reduce the size of your meals or skip meals because there wasn’t enough money to buy food to eat?; (2) In the last 12 months, were you ever hungry but didn’t eat because you couldn’t afford enough food to eat?; (3) In the last 12 months, did you lose weight because you didn’t have enough money to buy food to eat?; (4) In the last 12 months, did you ever not eat for a whole day because there wasn’t enough money to buy food to eat?. It is coded as 0 otherwise.
16
About 58% of the sample live in households that use poor quality cooking fuel.17 Indoor air pollution
caused by using such fuels inside the house dramatically increase the risk of CVD. According to the
World Health Organization (WHO), 4.3 millions deaths across the globe (nearly 7% of all deaths)
in 2012 were caused by indoor air pollution that is generated by cooking with fuels like wood, coal
and cow dung inside the house (WHO, 2014). While all states have a large share of households
using such fuels, Rajasthan is an outlier. Over 60% of households have no indoor plumbing. Kerala
and Rajasthan are the biggest contributors to this number.18 Over 15% of households do not have electricity, with Rajasthan contributing disproportionately to this statistic. Over one-third of
households have no private toilet and use public spaces for their toilet needs. This practice is much
more common in Rajasthan and Karnataka than in Punjab or Kerala.
Respondents were asked about their perceived (relative) socioeconomic status (SES) in society.19
For the overall sample, households are quite evenly distributed across the different strata.
Inter-estingly, over two-fifths of the sample in Kerala placed themselves in the lowest SES quintile and
only 10% thought they belonged to the highest stratum in society. Neighborhood safety is not a
concern for most of the respondents.
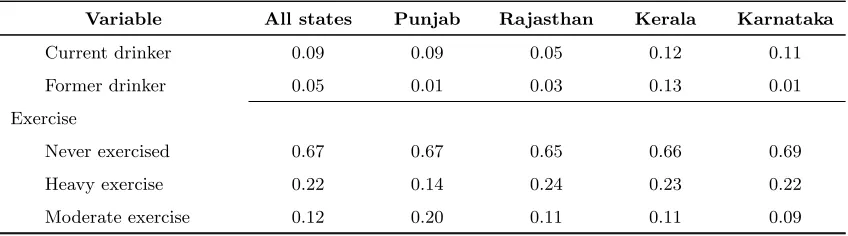
There is not much variation across states with regard to the lifestyle variables. Over two-thirds
of the sample have never smoked, had alcohol or exercised. There is a higher share of current
smokers and drinkers in Kerala and Karnataka, compared to the Northern states, and over 20% of
the sample report doing heavy exercise in all states except Punjab.
17
Good quality cooking fuel is defined as 1 if the household uses coal, charcoal, natural gas, LPG, kerosene or electricity for cooking, and 0 otherwise. Bad cooking fuel includes dung cakes, crop residue and firewood (See Arokiasamy et al., 2012.)
18The statistic that the predominant share of households in Kerala having no piped water inside the house is consistent with findings from other data sources. See Arokiasamy et al. (2012) and references therein.
19
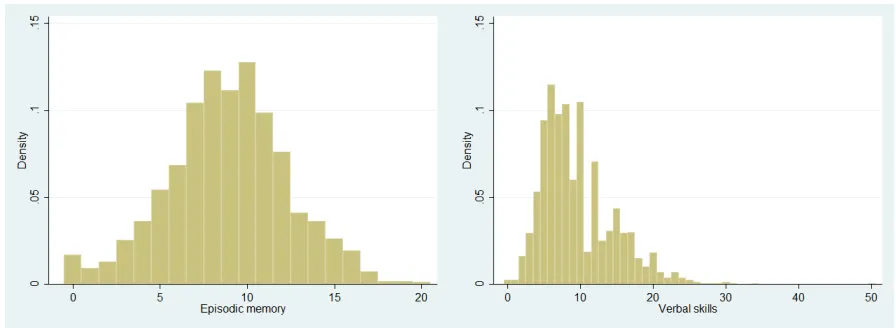
Figure 1 plots the distribution of scores for episodic memory and verbal skills for the entire sample.
‘Ceiling effects’ are common in the measurement of cognitive functioning. Since these measures
are generally designed to detect cognitive decline, individuals with good cognitive functioning often
score the maximum points on these tests. If this is the case, then the econometric analysis will
have to take such censoring into account (Yount, 2008; Maurer, 2010; Maurer, 2011). In our case,
[image:14.612.81.529.217.381.2]this would apply specifically to the episodic memory and verbal skills measures. As is evident from
Figure 1, the distributions do not indicate the presence of any ceiling effects in either measure.
Figure 1: Density of Scores on Episodic Memory and Verbal Skills
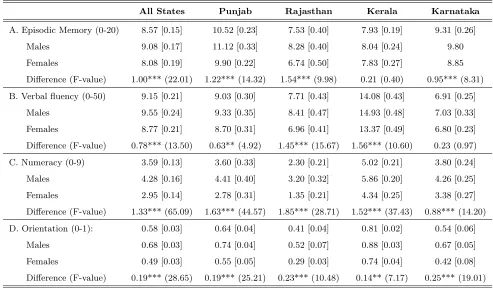
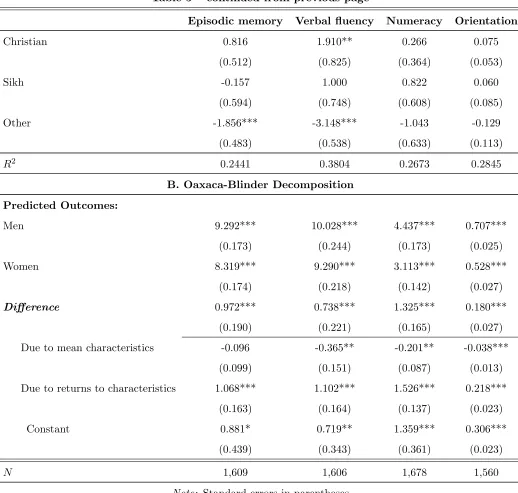
Table 2 reports summary measures of our 4 measures of cognitive function disaggregated by state
and by gender. It reveals that men outperform women in every cognitive measure, on average. These
differences are significant, except in the case of episodic memory in Kerala and verbal fluency in
Karnataka. Punjab outranks the other states in episodic memory while Kerala ranks first on all
other measures. Rajasthan scores poorly on the numerical skills measure but outranks Karnataka
on verbal fluency. Thus, there is no clear-cut North-South divide in cognitive skills, based on
average performance indicators. This suggests that not only are the risk factors for poor cognitive
performance likely to differ across states but that they are also likely to affect the various cognitive
measures differently. Thus, analyzing cognitive performance by combining states and/or combining
different cognitive measures is likely to conceal a number of interesting relationships.
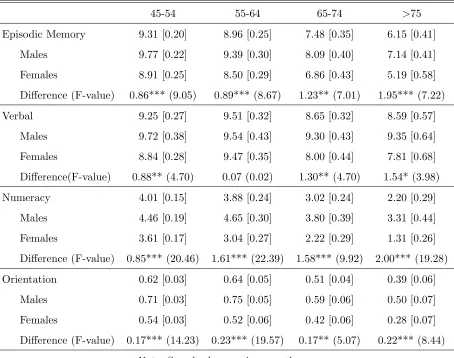
All individuals experience a decline in cognitive capacity as they age, though the point in the
cognitive function (Finkel et al., 1998). There is little evidence of decline in crystallized abilities (for
example, verbal skills), that depend on knowledge accumulated over time while fluid abilities that
relate to the ability to learn new things and to solving novel problems, show evidence of decline from
early adulthood (Skirbekk, 2008). Table 3 reports our measures of cognitive function, decomposed
by age and gender. Episodic memory and numerical skills appear to decline monotonically with age,
while for verbal skills and orientation, the decline is apparent only from the mid-50s. Consistent
with the literature, the decline is much steeper in numerical skills than in verbal skills. With the
exception of orientation, the decline is much sharper for women between 55 and 74 years of age,
compared to men in the same age range. We note that these statistics cannot be interpreted as
pure aging trends; they reveal a combination of cohort and age effects.
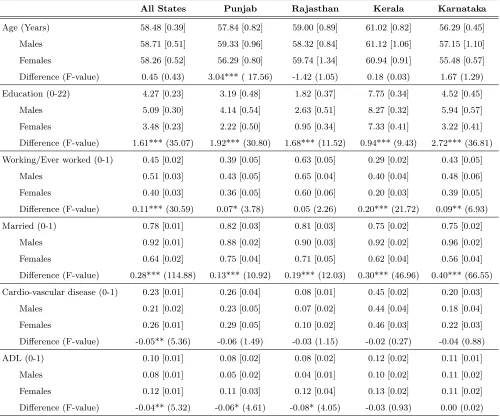
In Table 4, we report gender differences in some of the risk factors as well as characteristics, that
are known to affect cognitive functioning. There is little evidence of significant differences in risk
factors between the genders. The age difference is significant only in Punjab. Women are more
likely to report difficulties with ADL and diagnosed CVD. However, these gender differences are
either not significant, or only marginally so. In contrast, gender differences in characteristics are
all positive in men’s favor - men are more educated, more likely to have worked and more likely to
be married - and also statistically significant. Differences in education are notable for all states,
but especially in Rajasthan.
3
Empirical Strategy
We estimate the following linear regression:
Ci=α+βF emalei+Xijγj+ǫi (1)
whereCis one of our four measures of cognitive functioning for individuali, ‘Female’ is the gender
dummy, ǫ is the error term and X is a vector of individual and household characteristics and j
indexes different specifications. Since we use a life-course approach, we are interested in estimating
cognition outcome variables. We operationalize this by sequentially adding variables representing
different life stages into the regressions. We estimate Equation 1 using the ordinary least squares
(OLS) method.
In our first specification (j = 0), X0 comprises variables that are exogenous to the outcomes, as well as geographic indicators (state of residence and urban status) (Panel A variables in Table 1).
We refer to this specification as Model 1. These variables appear in all our specifications. Our
second specification (j= 1) introduces variables representing the individual’s SES in childhood, in
addition to those in X0 (variables in Panel A and Panel B in Table 1). In the third specification, we add characteristics decided in adulthood to the basic model (variables in Panel A and Panel
C in Table 1). We next examine the impact of variables that represent the current socioeconomic
situation of the individual (variables in Panel A and Panel D in Table 1). In the last specification
(j = 4), we add variables from all stages and estimate the full model (variables in Panels A, B,
C and D in Table 1). Our coefficient of interest is β, which captures gender differences in the
particular measure of cognitive functioning.
We also decompose the predicted gender difference in cognitive functioning based on the method
proposed by Oaxaca and Blinder (Blinder, 1973; Oaxaca, 1973). The Oaxaca-Blinder decomposition
analysis complements the conventional regression analyses by summarizing the shares of the
male-female gap in mean cognition scores that are attributable to gender differences in mean attributes
on the one hand, and to gender differences in the returns to these attributes on the other.
The decomposition analysis is based on running the regressions specified in Equation 1 separately
for men and women and obtaining parameter estimates ˆγM and ˆγF respectively.20 The predicted
levels of cognitive functioning for the 2 genders are now ˆCM =XMγˆM and ˆCF =XFγˆF. We can
now decompose the mean male-female difference in predicted levels of cognition as:
ˆ
CM −CˆF =XMγˆM−XFγˆF
= (XM −XF)(WγˆM−(I−W) ˆγF) + (XM(I−W) +XFW)( ˆγM −γˆF), (2)
where the first component in Equation 2 is attributable to differences in mean characteristics (the
‘explained’ component), and the second component is attributable to differences in their effects (the
‘unexplained’ component). ¯Xs denote subpopulation means,I denotes the identity matrix andW
is the weighting matrix proposed by Neumark (1988) and Oaxaca and Ransom (1994), which uses
the coefficients from a pooled model over both sexes (and includes a dummy variable for gender as
a control variable) as the reference coefficients.21 W is calculated as follows:
W = (XM′ XM+XF′ XF)−1(XM′ XM) (3)
In addition to reporting the summary measures of the explained and unexplained differences in
later-life cognition for each measure, we also present the specific contributions of variables that
significantly contribute to these differences.
4
Results
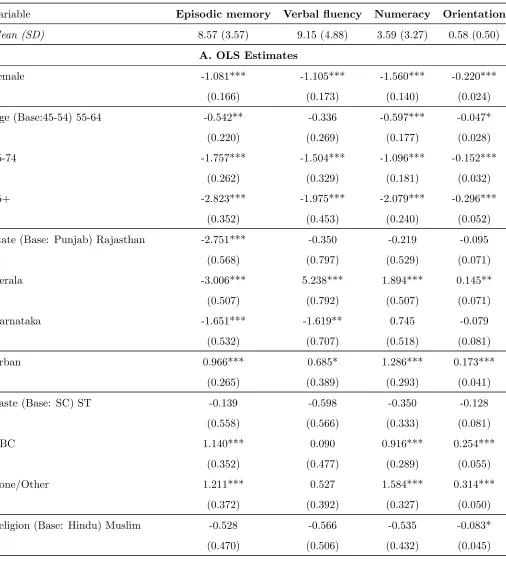
Panel A in Table 5 presents estimates for each of the 4 measures of cognitive function, from ordinary
least squares (OLS) models adjusted for age, state of residence, urban status, caste and religious
identity. The first row reports the mean and standard deviations of the corresponding measure,
for ease of comparison with the coefficients. Female disadvantage is evident across all cognitive
measures; the coefficient of the female indicator variable is negative and significant for all measures
of cognition. The magnitude of disadvantage varies, representing nearly one-third of the standard
deviation (SD) for episodic memory, over one-fifth of the SD for verbal fluency, nearly 50% of the
SD for numerical skills and over two-fifths of the SD for orientation. All cognitive functions decline
with age. Consistent with the literature, the decline in verbal fluency appears to begin at a later
age, compared to the other functions (Finkel et al., 1998; Skirbekk, 2008).
21
The summary statistics in Table 2 revealed that Punjab ranked highest with respect to episodic
memory. The regression results reflect this as well; relative to Punjab, the other 3 states have
a sizable disadvantage in episodic memory. Notably, Kerala’s deficit is about four-fifths of a SD
relative to Punjab. On all other measures, Kerala does considerably better while Rajasthan is
statistically no different from Punjab. Karnataka does worse than Punjab on verbal fluency but
is statistically indistinguishable on the other measures. Thus, there is considerable heterogeneity
among states across the different measures of cognition and no clear-cut North-South divide in
performance. Living in urban areas positively affects all cognitive measures. In terms of differences
by caste, scheduled tribes (ST) do just as well as scheduled castes (SC) across all measures. Other
backward castes (OBC) and the residual category (None/Other) perform significantly better than
the SCs in all measures except verbal fluency. Verbal fluency is the only cognitive measure that
is unaffected by caste status. Religion does not appear to have a strong influence on cognitive
performance in general though Christians do much better than Hindus (over one-third of a SD)
in verbal fluency, and there is evidence of some negative self-selection into the residual (Other)
category.
In Panel B, we present the decomposition of the predicted male-female differences in cognitive
function based on the specification in Panel A.22 For all measures, the predicted cognition gap is marginally smaller than the actual gaps in Table 2. Across all measures, the returns to
character-istics (the coefficient effect) not only explain the entire gender gap in cognitive abilities but are in
fact bigger than the gap, largely driven by the intercept coefficient (the constant term). As a
conse-quence, the differences in characteristics (the ‘explained’ component) are negative and significant,
except in the case of episodic memory. This implies that women are in fact better endowed than
men in the specified characteristics that favor cognition at later ages, and that these endowment
effects act to mitigate some of the difference arising from bigger returns to characteristics for men
relative to women.
22
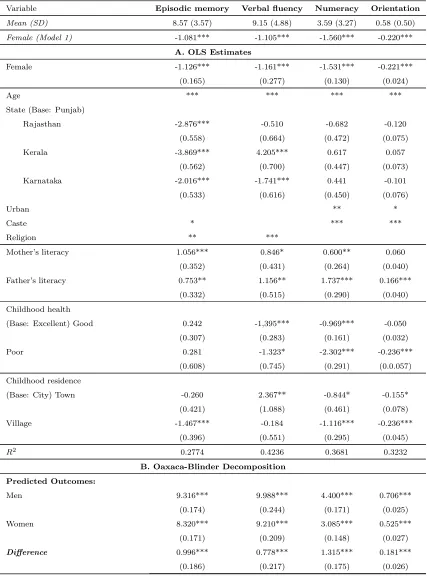
4.1 Childhood Influences
We now augment the specification in Table 5, by including controls for earlylife circumstances
-specifically, mother’s and father’s literacy, type of settlement that respondent resided in during
childhood (village/town/city) and self-reported health status in childhood (excellent/good/fair).
In our view, these variables reflect the extent of cognitive stimulation as well as socio-economic
status in childhood, both of which are established predictors of cognitive function in adulthood
(Heckman, 2006b). Table 6 reports the estimates from this specification. For some of the variables
used in the first specification (Table 5), we only indicate whether the variable is significant (jointly
significant in the case of variables with more than 1 indicator variable) in order to conserve space.
Estimates from Panel A suggest that introducing variables that reflect early-life circumstances
increases female disadvantage in episodic memory and verbal fluency, decreases it marginally in
numerical skills while leaving the deficit essentially unchanged in orientation. Mother’s literacy
is positively and strongly associated with episodic memory (nearly 30% of 1 SD) while father’s
literacy exerts a positive influence on all measures of cognition but especially on numerical skills
(53% of a SD) and orientation (one-third of a SD). Self-reported health in childhood has no effect
on episodic memory but is associated with all other measures of cognition. Relative to having
been in excellent health during childhood, having been in poorer health negatively affects current
verbal, numerical and orientation skills. These effects are particularly substantial for numerical
skills and orientation when respondents report poor childhood health. Similarly, childhood spent
in a village, as compared to a city, is detrimental to all cognitive skills except verbal fluency. Again,
these effects are large and significant. In summary, not controlling for circumstances in childhood
understates the extent of female disadvantage in episodic memory and verbal skills and overstates
this disadvantage in numerical skills. Note that the inclusion of these variables increases the R2
values in Table 6, compared to those in Table 5, indicating that these variables are important
correlates of cognitive skills (Oster, 2014).
Age continues to influence the outcome variables even after the introduction of the additional control
variables. State effects are now much weaker. Notably, Kerala now has the advantage over other
states only in verbal skills; it is statistically no different from Punjab in numeracy and orientation.
status and caste status no longer affect episodic memory and verbal fluency. This is possibly due
to the fact that educational attainment, especially among older cohorts, is unequally distributed
across caste groups in India (Chauhan, 2008). In our sample, SC and ST status was negatively
correlated with both mother’s and father’s literacy while OBC and Other castes displayed a positive
correlation with parents’ literacy. Urban status was correlated with rural/urban residence status
in childhood; respondents who spent their childhood in a village are less likely to be living in urban
areas. All these correlations were significant at the 5% level. Thus, inclusion of parents’ literacy
status and type of settlement in childhood weakens the association between our outcome measures
and the caste and urban status variables.
The decomposition of the predicted cognition gap in Panel B of Table 6 reveals the same trends
as those in Table 5. Again, the predicted cognition gaps are only marginally smaller than the
corresponding raw gaps in Table 2. Differences in the mean values of the control variables - the
explained component - are negative for all measures and significant for orientation and verbal
fluency, and marginally significant for numerical skills. The unexplained component - the returns
to characteristics - is bigger than the cognition gap for each measure and statistically significant at
the 1% level. However, the constant term is now positive and significant only for orientation.
4.2 Influence of Adulthood Choices
We now examine the impact of choices made in adulthood on the 4 cognitive measures and the
gender gap in these measures. To our first specification (Model 1), we add the following variables
as controls: indicator variables for educational attainment levels, literacy, marital status indicator,
number of children and past employment status (ever worked versus never worked).23 We report these estimates in Table 7. We again report the mean and standard deviations of the corresponding
measure in the first row, and estimates of the female indicator variable from Model 1 (Table 5) in
the second row, for ease of comparison.
23
We first note, from estimates in Panel A of Table 7, that controlling for educational attainment,
literacy, marital status, number of children and work status history wipes out the female
disadvan-tage in verbal skills and reduces it considerably in the other 3 measures - by 62%, 71% and 67% in
episodic memory, numerical skills and orientation respectively - relative to the estimates in Table
5. Education appears to be the key variable driving this sharp reduction, with large gains beyond
primary school levels. The education-cognition gradient is particularly steep for the highest level of
education (over 12 years of schooling) relative to having no formal schooling, increasing cognition
scores on episodic memory and numerical skills by over 1 SD, by nearly 1 SD for orientation and
by over three-fourths of a SD for numerical skills. Even a few years of schooling increase numerical
skills and orientation considerably, as does literacy. Thus, even basic education appears to have big
impacts on these two cognitive measures. The positive and sizable effect of education on cognition
is consistent with the findings of other studies (Maurer, 2011; Lee et al., 2014). Employment status
history (whether the respondent ever worked for pay for over 6 months in her lifetime) impacts
ver-bal fluency and numerical skills, increasing the former by about one-third of a SD and the latter by
about 30% of a SD. Number of children appear to have no significant effect on cognitive skills. Age
and state dummies continue to be significant. Caste indicators are jointly significant for orientation
but only weakly so for episodic memory and numerical skills, while the religion indicators are only
significant for verbal fluency. Thus, it appears that some of the effects of childhood circumstances
that contribute to female cognitive disadvantage disproportionately, can be reversed with
educa-tional attainment, employment and marital status. In the case of verbal skills, the reversal appears
to be complete. In other cognitive measures, sizable cognitive gaps remain.
Panel B of Table 7 reports the decomposition of the predicted cognition gap based on the
spec-ification in Panel A, and is notably different from the estimates in Table 5 and Table 6. The
predicted cognition gap for episodic memory is now bigger than the corresponding summary
mea-sure in Table 2, while those for verbal skills, numeracy and orientation are considerably smaller;
there is no statistical difference between men and women in verbal skills. Thus, the control
vari-ables in this specification go a long way in explaining the cognitive gender gap in verbal skills
and numeracy.24 Now, the ‘explained’ component is positive and bigger than the ‘unexplained’
component for all measures, and statistically significant for all outcome measures except verbal
24
skills. On average, men’s higher educational attainment explains around 30% of the gender gap in
all 3 measures where there is a statistically significant gender gap in predicted cognition. Higher
employment rates contribute around 16% to the male advantage in numerical skills. Moreover,
men also enjoy significantly higher returns to characteristics. The only exception is for episodic
memory, where women enjoy higher returns to living in urban areas compared to men. However,
the intercept difference is positive and significant for this cognition measure. These estimates imply
that even if women are given the same education levels and employment rates as men, they would
still under-perform in cognitive functions.
4.3 Influence of Later-Life Circumstances
We next examine the influence of current circumstances - household living conditions, financial
circumstances and self-reported health status - on the 4 cognitive measures. We add the following
variables to those in our first specification (Model 1): logarithm of per capita household expenditure,
indicator for whether household faces food insecurity, indicators for household living conditions
(whether household has electricity, indoor plumbing, indoor toilet, type of fuel used for cooking),
indicators for whether respondent lives alone, has difficulty with activities of daily living (ADL),
has been diagnosed with CVD, self-rated health, indicators for past and current life-style habits
(smoking, alcohol consumption and exercise), perception of relative socio-economic status (SES)
and neighborhood safety. A number of these variables - household expenditure, food insecurity
status, perception of neighborhood safety and household living conditions - capture the household’s
SES which is hypothesized to have a direct as well as indirect impact on cognition, as noted in
the introduction.25 Lifestyle variables affect the risk of morbidity, which in turns impairs cognitive functioning (Yount, 2008; S´everine et al., 2012). Subjective perception of relative SES is a proxy
for life satisfaction, which is a measure of cognitive well-being.26 We report the estimates in Panel A of Table 8.
The array of variables introduced to control for current life circumstances causes female
disad-25See for instance, Mani et al., 2013; Maurer, 2011.
vantage in episodic memory to increase marginally, but reduces the gender gap by about 11% in
verbal fluency, by nearly 20% in numerical skills and by about 12% in orientation. People living
in Punjab continue to have an advantage in episodic memory compared to those living in other
states. Kerala continues to do better than Punjab in verbal fluency and orientation. Living alone
is considered a risk factor for dementia (Kalaria et al., 2008). However, this variable appears to
have no impact on cognition in this specification. Limitations in activities of daily living (ADL)
reflect some form of disability, and this variable has a big, negative effect on all cognition measures
except numerical skills.27 The positive and significant impact of CVD status on numeracy, though puzzling, is consistent with the evidence in Langa et al. (2009) and Lee et al. (2014). Relative to
being in self-assessed excellent health, being in poor health adversely impacts cognitive
function-ing, especially for verbal skills and numeracy. Increases in per capita household expenditure, as
expected, are positively associated with cognitive skills.
Consistent with the findings of the World Health Organization (WHO, 2014), using good fuel
for cooking increases cognitive skills - around 23% of the corresponding SD for episodic memory
and numerical skills, and about 15% of a SD for orientation. Having a toilet inside the house is
associated with increases in episodic memory (26% of a SD) and orientation skills (45% of a SD).
The perception of living in a safe neighborhood also has a sizable effect (nearly a third of the
corresponding SD) for episodic memory and numerical skills. As noted earlier, these characteristics
reflect the SES of the household and their impact is best interpreted in that light. Subjective
assessment of relative SES of the household also tells us a qualitatively similar story, though there is
some evidence of non-linear effects. Thus, relative to the lowest quintile, those in the second quintile
of subjective SES appear to have higher levels of cognition in all measures except orientation while
those in the third quintile do better on numerical skills (about 18% of a SD) but are statistically
no different from those in the bottom quintile on other measures. We see the biggest effects for
the fourth (except for orientation) and fifth quintiles. Numerical skills, in particular, appear to
respond very strongly and consistently to increases in self-assessed SES.
With respect to lifestyle choices, current smokers have lower scores on episodic memory and
orienta-tion relative to non-smokers, and those who exercise regularly have better orientaorienta-tion skills (about
18% of a SD) compared to those who never exercise. We find a positive association between current
alcohol consumption and numerical skills, which is in line with the findings of other studies (Anstey
et al., 2009; Virta et al., 2010). In summary, while a number of variables included to control for
current circumstances have sizable effects on cognition, the net effect of these variables does little
to reduce the female disadvantage except in numerical skills. The decomposition analysis based on
this specification is reported in Panel B of Table 8. As with the other specifications, the predicted
cognition gap is positive and significant for all cognition measures. However, predicted gaps are now
bigger for numeracy and verbal skills, relative to the actual gaps in Table 2. In line with the first
two specifications (Models 1 and 2) and unlike the estimates for the third specification (Model 3),
on average, women appear to do better in terms of characteristics that increase cognition (except
for numerical skills), though these effects are not significant. However, returns to characteristics
disproportionately favor men.
4.4 Influence of the Life-Course
We now examine the effects of cognitive resources over various life stages on cognitive outcomes in
later-life. We estimate our model with the full set of control variables, comprising the basic, largely
exogenous set of controls (Model 1), controls for childhood circumstances, controls for adult life
choices and controls for current life circumstances. Panel A of Table 9 presents the results.
The inclusion of the full set of life-course variables eliminates the gender gap in verbal skills and
reduces it by 51% in episodic memory, 74% in numeracy and by 61% in orientation. For episodic
memory and orientation, this decline is smaller than the decline induced by the inclusion of controls
for choices made in adulthood alone (Table 7). This is largely due to the importance of influences
in childhood on later-life cognition. Notably, mother’s literacy status increases episodic memory
by about 22% of a SD even after controlling for circumstances and choices in different stages of
life. Similarly, the type of settlement in childhood that the respondent resided in continues to have
a significant impact on episodic memory, verbal skills and orientation. The respondent’s health in
childhood is correlated with verbal skills and numerical skills late in life, despite the addition of
various other controls. Father’s literacy status has a big (28% of a SD) and significant impact on an
environment is crucial for the development of skills and that cognitive resources acquired later
may not completely reverse the deficit from lack of resources in childhood (Cunha et al., 2006).
Nevertheless, education is a vital channel for cognitive skills in later years.
The returns to high educational attainment (more than 12 years of education) are bigger for verbal
skills after controlling for childhood and later-life circumstances, compared to the specification
without these controls (the corresponding coefficients are smaller in Table 7), suggesting that high
levels of education can offset some of detrimental effects of childhood and current life circumstances
on cognitive functioning. In general, the education-cognition gradients are steep for all cognition
measures, though for verbal skills, the coefficient is statistically significant only for the highest
educational attainment indicator. As in Table 7, relative to no formal schooling, even a few years
of schooling increase numerical skills considerably - by 37% of a SD. Literacy has a big impact on
numerical skills (29% of a SD) even after controlling for education. Marital status and number
of children now affect only episodic memory. Controlling for childhood and current circumstances
attenuates the positive effect of employment status history on verbal and numerical skills but only
slightly; the coefficients continue to be sizable and significant.
The positive effect of CVD on numerical skills, found earlier, survives the additional controls.
Per capita household expenditure also has a positive effect on numerical skills but the coefficient
is much smaller relative to the corresponding coefficient in Table 8. Using good cooking fuel is
now positively and significantly associated only with episodic memory; the effect of this variable
on numerical skills and orientation is no longer statistically significant. Similarly, subjective SES
significantly affects verbal skills but no other cognition measure. Household amenities - availability
of electricity, piped water and indoor toilet - matters significantly for orientation but for no other
cognition measure. Notably, the effect of living in a safe neighborhood on episodic memory is now
bigger (40% of a SD) relative to the corresponding estimate in Table 8. Smoking continues to have a
negative but marginally significant effect while exercising has a positive effect on episodic memory.
The positive effect of drinking on numerical skills endures the addition of childhood circumstances
and life cycle choices.
Panel B of Table 9 presents the decomposition of the predicted gender gaps in cognition. The
episodic memory, the predicted gap is marginally bigger than the corresponding mean difference in
Table 2. As with Model 3 (Table 7), differences in attributes between men and women are positive
and contribute significantly to the gender gaps. Thus, men are better equipped in attributes
that positively affect cognition. In particular, they have higher educational attainment and are
more likely to have worked, compared to women. While the addition of other controls lowers the
magnitude of these effects (education and work history status) on the cognition gender gaps, they
nevertheless continue to be sizable. Yount (2008), Maurer (2010) and Maurer (2011) also highlight
the importance of education in explaining the gender cognitive gap. Unlike Alderman et al. (1996)
and Maurer (2011), we do not find evidence of bigger returns to education for women compared to
men. Overall, returns to characteristics also favor men, contributing nearly 50%, 33% and 63% of
the gap in episodic memory, numerical skills and orientation respectively. There is, however, some
evidence that women benefit disproportionately from living in urban areas.
Table 10 summarizes the results from the various specifications. We first note that relative to
Model 1, the coefficients of the female indicator variable are considerably smaller in the fully
detailed model (Model 5) for all cognition measures. However, the predicted gender gap in episodic
memory is bigger than the actual gap. The explained component of basic characteristics (age,
state of residence, urban status, caste and religion indicators) is negative and significant in all
models for verbal skills; for women, some of these characteristics work towards mitigating the
overall disadvantage in verbal skills. For episodic memory, numerical skills and orientation, the
unexplained component of the predicted cognition gap is positive and significant in all models,
indicating that men enjoy better cognitive returns to characteristics in all stages of life. Estimates
for the fully detailed model (Model 5) indicate that characteristics capturing adult circumstances
-educational attainment, work history, marital status and number of children - jointly favor men for
all measures. For episodic memory alone, the joint returns to these characteristics appear to favor
women. A comparison of Model 3 with Model 5 indicates that for episodic memory and orientation,
we would be underestimating the extent of female disadvantage by not controlling for circumstances
in childhood and current circumstances. Literacy, education and employment matter significantly
for numeracy (Model 3). Adding controls for childhood and current circumstances reduces female
disadvantage in numeracy only marginally. However, childhood circumstances matter considerably
bigger with the inclusion of childhood influences. However, controlling for the full set of life-course
variables eliminates the cognitive gap in verbal skills. This is not the case for the other 3 cognition
measures. A significant gender gap remains - measuring 15% if an SD in episodic memory, 12% of
an SD in numeracy and 17% of an SD in orientation - even in the fully detailed model. Notably,
there is significant heterogeneity in the contribution of the explained and unexplained components
of the predicted cognition gap across these 3 measures in the detailed model - for episodic memory,
the two components explain roughly one half of the predicted gap while the explained component is
twice the magnitude of the unexplained component for numeracy and about 60% of the unexplained
component for orientation.28
5
Conclusions
We examine gender differences in four cognitive skill measures among individuals aged 45 and over,
using the 2010 pilot survey of the Longitudinal Aging Survey of India (LASI), that surveyed
rep-resentative populations across 4 different states in India. We find a persistent female disadvantage
across all 4 measures of cognitive skills in the raw data. We adjust for various individual and
household characteristics, sequentially adding sets of variables that capture aspects of childhood
SES, choices made in adulthood and current socio economic circumstances, including health status.
We find significant and sizable effects of state of residence; Punjab’s supremacy in episodic memory
is robust to various specifications, as is Kerala’s in verbal skills. The decomposition of the predicted
cognition gap in the detailed model (Table 9) also indicate that women would benefit significantly
in terms of episodic memory and verbal skills, from moving to urban areas. Thus, there is robust
evidence that ‘geography’ matters for everyone and that women may be particularly disadvantaged
28
by being confined to rural areas. Being married is positively associated with episodic memory
but with no other cognitive skill. Similarly, there is evidence of a negative association between
number of children and episodic memory. Different aspects of current socioeconomic status matter
for different cognitive skills, to varying degrees. Thus, living in a safe neighborhood and using good
cooking fuel appears to matter for episodic memory while higher household consumption matters for
numeracy. Lifestyle variables affect episodic memory and numeracy. Understanding how much of
these effects is due to reverse causation, how much is due to correlations with unobserved variables,
and how much of the effects, if any, are causal is beyond the scope of this paper. As the various
waves of LASI data become available, it may be possible to address these questions.
Consistent with many other papers cited in the literature review, we also find that education plays
a big role in explaining the gender cognition gap. In the richest model specification incorporating
characteristics from various life stages (Model 5), differences in educational attainment between men
and women explain 26%, 25% and 27% of the predicted cognition gap in episodic memory, numeracy
and orientation respectively (Table 9). These big effects are not always mitigated by bigger returns
to education for women, as other papers find (Maurer (2011), for instance). Moreover, childhood
circumstances continue to affect later-life cognition, even after we control for a rich array of other
characteristics. Thus, mother’s literary status has a continued influence on episodic memory while
father’s literacy has a strong and significant effect on numeracy. Similarly, health status in childhood
affects verbal and numerical skills while the type of settlement that the respondent resided in during
childhood has a significant impact on later-life episodic memory.
Our results suggest that while the female disadvantage in cognition can be alleviated to some
extent by closing the male-female education gap, it is unlikely to disappear completely as long as
other cognitive resources are unequally distributed to girls and boys in childhood. Moreover, poor
cognitive function is both a risk factor for, and a consequence of many chronic health conditions
associated with the elderly, such as dementia (Lee et al., 2014). Thus, investments which work
towards closing the cognition gap, beyond creating a healthy and skilled work force, would increase
women’s mobility, independence, well-being and overall quality of life at all ages (Hatch et al.,
2007). More importantly, such investments have intergenerational spillover effects working through
increasing outlays and coverage of government prenatal programs, and of cash and food transfers
References
Alderman, H., J. R. Behrman, S. Khan, D. R. Ross, and R. Sabot(1997): “The Income Gap in Cognitive Skills in Rural Pakistan,” Economic Development and Cultural Change, 46,
97–122.
Alderman, H., J. R. Behrman, D. R. Ross,andR. Sabot(1996): “Decomposing the Gender Gap in Cognitive Skills in a Poor Rural Economy,” Journal of Human Resources, 31, 229–254.
Andersen-Ranberg, K., J.-M. Robine, M. Thinggaard, and K. Christensen (2008): “What Has Happened to the Oldest Old SHARE Participants After Two Years?,” in First
Results from the Survey of Health, Ageing and Retirement in Europe (2004-2007): Starting the
Longitudinal Dimension, pp. 66–73. Mannheim Research Institute for the Economics of Aging.
Anstey, K., H. A. Mack, and N. Cherbuin (2009): “Alcohol Consumption as a Risk Factor for Dementia and Cognitive Decline: Meta-Analysis of Prospective Studies,” American Journal
of Geriatric Psychiatry, 17(7), 542–555.
Arokiasamy, P., D. Bloom, J. Lee, K. Feeney, and M. Ozolins (2012): “Longitudinal Aging Study in India: Vision, Design, Implementation, and Preliminary Findings,” in Aging in
Asia, pp. 36–74. National Academy of Sciences.
Blinder, A. (1973): “Wage Discrimination: Reduced Form and Structural Estimates,” Journal of Human Resources, 8(4), 436–455.
Bonnal, L., R. Boumahdi, and P. Favard(2013): “The Easiest Way to Estimate the Oaxaca-Blinder Decomposition,” Applied Economics Letters, 20(1), 96–101.
Boo, F. L.,andM. E. Canon(2014): “Reversal of Gender Gaps in Child Development: Evidence from Young Children in India,”Economics Letters, 124, 55–59.
Broadberry, S. (1997): “Forging Up, Falling Behind and Catching Up: A Sectoral Analysis of Anglo-American Productivity Differences 1870-1990,” Research in Economic History, 17, 1–37.
Case, A., and C. Paxson (2009): “Early Life Health and Cognitive Function in Old Age,”
Chauhan, C. P. S. (2008): “Education and Caste in India,” Asia Pacific Journal of Education, 28(3), 217–234.
Cunha, F., and J. J. Heckman (2007): “The Technology of Skill Formation,” American Eco-nomic Review, 97(2), 31–47.
Cunha, F., J. J. Heckman, L. Lochner, and D. V. Masterov (2006): “Interpreting the Evidence on Life Cycle Skill Formation,” in Handbook of the Economics of Education, Volume
1, pp. 697–812. Elsevier.
de Jager, C. (2010): “Memory in the Elderly,” in International Encyclopedia of Rehabilitation. Center for International Rehabilitation Research Information and Exchange (CIRRIE).
Doblhammer, G., G. J. van den Berg, and T. Fritze (2013): “Economic Conditions at the Time of Birth and Cognitive Abilities Late in Life: Evidence from Ten European Countries,”
PLoS ONE, 8(9).
Dr`eze, J., and A. Sen (1996): India: Economic Development and Social Opportunity. Oxford University Press.
Finkel, D., N. L. Pedersen, R. Plomin, and G. E. McClearn (1998): “Longitudinal and Cross-Sectional Twin Data on Cognitive Abilities in Adulthood: The Swedish Adoption/Twin
Study of Aging,” Developmental Psychology, 34(6), 1400–1413.
Flynn, J.(2012): Are We Getting Smarter?: Rising IQ in the Twenty-First Century. Cambridge University Press.
Folstein, M., S. E. Folstein, and P. R.McHugh (1975): “Mini-Mental State: A practical method for grading the cognitive state of patients for the clinician,” Journal of Psychiatric
Research, 12(3), 189–198.
GOI (2010): “Addressing India’s Nutrition Challenges,” Report, Planning Commission, Govern-ment of India.
Hatch, S., L. Feinstein, B. G. Link, M. E. J. Wadsworth, andM. Richards(2007): “The Continuing Benefits of Education: Adult Education and Midlife Cognitive Ability in the British
1946 Birth Cohort,” Journal of Gerontology: Social Sciences, 62B(6), S404–S414.
Heckman, J. J. (2006): “Skill Formation and the Economics of Investing in Disadvantaged Chil-dren,”Science, 312, 1900–1902.
Hoynes, H., D. W. Schanzenbach,andD. Almond(2012): “Long Run Impacts of Childhood Access to the Safety Net,” NBER Working Paper No. 18535.
ILO(2013): “Global Employment Trends,” Report, International Labour Organization.
Jann, B. (2008): “A Stata Implementation of the Blinder-Oaxaca Decomposition,” The Stata Journal, 8(4), 453–479.
Jha, P., M. A. Kesler, R. Kumar, F. Ram, U. Ram, L. Aleksandrowicz, D. G. Bassani,
S. Chandra, and J. K. Banthia (2011): “Trends in Selective Abortions of Girls in India: Analysis of Nationally Representative Birth Histories from 1990 to 2005 and Census Data from
1991 to 2011,”The Lancet, 377(9781), 1921–1928.
Kahneman, D., A. Krueger, D. Schkade, N. Schwarz, andA. Stone(2006): “Would You be Happier if You were Richer? A Focusing Illusion,” Science, 312(5782), 1908–1910.
Kalaria, R., G. E. Maestre, R. Arizaga, R. P. Friedland, D. Galasko, K. Hall, J. A. Luchsinger, A. Ogunniyi, andE. K. Perry (2008): “Alzheimer’s Disease and Vascular De-mentia in Developing Countries: Prevalence, Management, and Risk Factors,”Lancet Neurology,
7(9), 812–826.
Kumar, R. (1994): “Development and Women’s Work in Kerala: Interactions and Paradoxes,”
Economic and Political Weekly, 29(51/52), 3249–3254.
Langa, K., D. Llewellyn, I. Lang, D.R.Weir, R. Wallace, M. .Kabeto,andF. Huppert
(2009): “Cognitive Health Among Older Adults in the United States and in England,” BMC
Layard, R., A. Clark, F. Cornaglia, N. Powdthavee, and J. Vernoit (2013): “What Predicts a Successful Life? A Life-Course Model of Well-Being,” IZA Discussion Paper, No.
7682.
Lee, J., R. Shih, K. Feeney, and K. Langa (2014): “Gender Disparity in Late-life Cogni-tive Functioning in India: Findings From the Longitudinal Aging Study in India,” Journals of
Gerontology, Series B: Psychological Sciences and Social Sciences, 69(4), 603–611.
Maitland, S., R. C. Intrieri, K. W. Schaie, and S. L. Willis(2000): “Gender Differences and Changes in Cognitive Abilities Across the Adult Life Span,” Journal of Aging,
Neuropsy-chology, and Cognition, 7(1), 32–53.
Mammen, K.,andC. Paxson(2000): “Women’s Work and Economic Development,”The Journal of Economic Perspectives, 14(4), 141–164.
Manly, J., N. Schupf, M.-X. Tang, and Y. Stern (2005): “Cognitive Decline and Literacy Among Ethnically Diverse Elders,” Journal of Geriatric Psychiatry and Neurology, 18(4), 213–
217.
Maurer, J. (2010): “Height, Education and Later-Life Cognition in Latin America and the Caribbean,” Economics and Human Biology, 8, 168–176.
(2011): “Education and Male-Female Differences in Later-Life Cognition: International
Evidence From Latin America and the Caribbean,”Demography, 48, 915–930.
Michael, R. T. (1973): “Education in Nonmarket Production,” Journal of Political Economy, 81(2), 306–327.
Mishra, V., T. Roy, and R. Retherford (2004): “Sex Differential in Childhood Feeding, Health Care, and Nutritional Status in India,” Population and Development Review, 30(2), 269–
295.
Murthi, M., A.-C. Guio, andJ. Dr´eze (1995): “Mortality, Fertility, and Gender Bias in India: A District-Level Analysis,”Population and Development Review, 21(4), 745–782.