Effect of Heavy Metals Pollution on Protein
Biosynthesis in Catfish
S. A. Habib1, A. M. Abou Shehatta Samah2
1Biochemistry Division, Damietta Faculty of Science, Mansoura University, Mansoura, Egypt 2Food Inspection Laboratory, Damietta Port, Damietta, Egypt
Email: [email protected]
Received January 24, 2013; revised February 26, 2013; accepted March 20,2013
Copyright © 2013 S. A. Habib, A. M. Abou Shehatta Samah. This is an open access article distributed under the Creative Commons Attribution License, which permits unrestricted use, distribution, and reproduction in any medium, provided the original work is properly cited.
ABSTRACT
The present study was carried out to evaluate the pollution and its effect on the quality of catfish. Four sites in Eygpt were chosen for the research, Ras El-Bar (Site 1) as control, Shatta (Site 2), Kafr El-Bateekh (Site 3), and Talkha (Site 4). The research was carried out on water, sediments and catfish (serum and muscles). Nitrite, nitrate and ammonia were determined in water and sediment. Also, RNA and DNA were determined in serum samples and the muscles of the catfish. In addition, the concentrations of heavy metals (Pb, Cd, Fe, Zn and Cu) were estimated in water, sediments and the muscles of catfish. Also, hepatosomatic index, liver water content, condition factor, lipid and protein contents were determined in the fish. The concentrations of nitrite, nitrate and ammonia in water and sediment of Site 4 and the levels of heavy metals especially Pb and Cd in water, sediment and muscle of catfish from Sites 3 and 4 were highly elevated compared to those of the control. On the other hand, DNA, RNA and protein contents in the catfish of Sites 3 and 4 decreased. The results illustrated that, Cd and Pb levels in the muscle of catfish were negatively correlated with DNA, RNA and with the protein contents. In conclusion, the accumulation of heavy metals in catfish tissues therefore, can cause health problems in human after catfish intake.
Keywords: Catfish; Protein Biosynthesis; Heavy Metals; Pollution
1. Introduction
The world suffers from deficiency of protein sources. Fish are considered as an important source of high qual- ity animal protein as they contain large amounts of es- sential amino acids. Also, fish contain crude lipids, which supply the body with energy and essential fatty acids that are necessary for life and play an important role in regu- lation of the cardio-vascular system and for reducing cholestrol level in the blood. Moreover, fish are rich in fat-soluble vitamins, iodine and phosphorous [1].
Humans now have a strong influence on almost every major aquatic ecosystem, and their activities have dra- matically altered the quality of receiving waters world- wide. Thus, there is a continuous need to develop and apply novel and effective technologies to detect, manage, and correct human-induced degradation of aquatic sys- tems [2].
Pollution is the changes that occur in chemical, physic- cal and biological characters of the environmental system. Environmental contamination of air, water, soil and food
have been still the most important subject in recent years because it causes threat extend to many plants and ani- mals and may ultimately threaten the survival of human- ity, and results from direct and indirect human activities [3]. Since intensive farming practices are essential to pro- duce enough food for the increasing population, farmers have been using more inorganic fertilizers, pesticides and herbicides [4].
Many of heavy metals such as lead and cadmium have no nutritional importance, and their presence in relatively high concentration in body tissues can result in health problems in human as well as in animals [5]. The over accumulation of these heavy metals in tissues of animals has received considerable attention, partly because lethal and sub-lethal effect of such accumulation [6]. The levels of these metals in water may not be lethal to these organ- isms but the concentration of such metals in their tissues creates hazards when used as food for human consump- tion [7].
mainly due to the industrial and municipal effluents [8]. Some heavy metals such as Zn, Pb, Cd, Hg, Fe and Cu when discharged into the water can enter the food chain and bioaccumulate in fish and hence became a threat source to man [9]. The concentration of these metals in muscles is much higher ten times in some cases, than that found in the surrounding water [10]. Some metals are essential for life, and others have an unknown biological function and the increase in such heavy metals more than the allowable limit cause toxicity [11]. Also, Ayyat et al.,
reported that Pb can be absorbed by the body and takes the place of Ca or Zn [12]. Chronic poisoning is more dangerous as it is very difficult to revert back to normal conditions after chronic exposure to this insidious metal present in our life [13].
Hayes, reported that chronic inhalation and oral expo- sure to Cd can be accumulated in the kidney and there- fore, he stated that kidneys were susceptible to Cd toxic- ity [14]. In addition, Mohan and Hosetti stated that the catalase and protease activities were significantly de- creased in the presence of Cd, with a simultaneous in- crease in peroxidase and superoxide dismutase activities, and decreases in the levels of protein and carbohydrate [15].
Damietta area is a region in Egypt that heavily ex- posed to pollution. Domestic and agricultural sewage coming from surrounding villages, and industrial wastes from factories enter the environment. The ship building industry in the village of Ezbit El-burg, together with the building of Damietta harbor, led to increase shipping activities that contribute in water pollution of the area [16]. So, the present work aims at evaluation of the levels of some pollutants in the River Nile and their effects on the quality of catfish via measurements of physical, chemical and biochemical changes of water, sediment and fish (clarias lazera). Also, heavy metals (Pb, Fe, Cu,
Zn, and Cd) have to be determined in the same samples.
2. Materials and Methods
Four sites were chosen for the research, Ras El-Bar (Site 1) as control, as it lies far from the sources of pollution, Shatta (Site 2) located in Port Saied-Damietta road, its water source is the Manzala lake, Kafr El-Bateekh (Site 3) it lies in Damietta Governorate and receives the dis- charge of Electric Power Station, and Talkha (Site 4) it lies directly closed to Talkha Fertilizer Factory and re- ceives the main outlets of factory drainage. The research was carried out on water, sediments and catfish (serum and muscles). Nitrite, nitrate and ammonia were deter- mined in water and sediment. RNA and DNA were de- termined in serum and muscles. The concentrations of heavy metals (Pb, Cd, Fe, Zn and Cu) were estimated in muscles, sediments and water. Hepatosomatic index, li- ver water content, condition factor, lipid content and
protein content were determined in the fish.
3. Methods
Nitrite was determined according to the method of Blaek [17], and nitrate as described by [18]. Ammonia was de- termined as described by Merck [19]. Heavy metals were determined by Atomic Absorption Spectrophotometery [20]. Water content was determined according to the me- thod of Sidwell et al., [21]. Hepatosomatic index was
calculated according to the method of Kohla [22]. Total lipids were determined according to AOAC [23]. Protein content of homogenized samples was performed accord- ing to the method described by Peters [24]. Protein elec- trophoresis was carried out using polyacrylamide gel elec- trophoresis [25]. Determination of nucleic acids accord-ing to the method of Schnieder et al. [26].
The Statistical analysis of the results was carried out using Instate software computer program, version 2.03 (Graph pad, USA), Origin software computer program, Inc. version 6.0 (Northampton, Ma 01060 USA), and Gel Pro Analyzer program (Media Cybernetices, Georgia, USA).
4. Results
The results were illustrated in Tables 1-6 and Figures1
and 2(a)-(c).
In Table 1, the levels of nitrite, nitrate and ammonia in
water and sediment of site 4 are highly significant in- creased compared to those of the control. Similar results are observed in the concentration of nitrite and nitrate in water and sediment of Site 2 and ammonia in water of Sites 2 and 3. Moreover, the concentration of ammonia in water and sediment of Site 4 was nearly 900 and 60 times respectively more than that of the control.
[image:2.595.309.539.558.707.2]No detectable amount of Pb is observed in water of Sites 1 and 2 but its levels in water of Sites 3 and 4 were 0.223 and 1.12 ppm respectively. However, the concen-
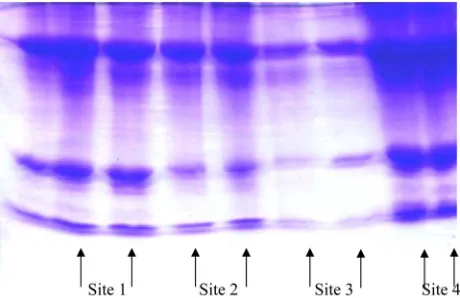
Figure 1. The electropherograph of different proteins of atfish from Sites 1, 2, 3, and 4.
Table 1. Concentrations of nitrite, nitrate and ammonia in water and sediment from locations 1, 2, 3 and 4.
Nitrite (mg/L) Nitrate (mg/L) Ammonia (mg/L) Nitrite (mg/kg) Nitrate (mg/kg) Ammonia (mg/kg)
Parameter
Sites In water In sediment
Site 1 0.01 ± 0.001 0.023 ± 0.006 0.221 ± 0.056 0.03 ± 0.01 0.03 ± 0.01 0.35 ± 0.05
Site 2 0.03 ± 0.004* 0.035 ± 0.013* 0.336 ± 0.111* 0.04 ± 0.01** 0.04 ± 0.01** 0.42 ± 0.11
Site 3 0.02 ± 0.005* 0.018 ± 0.005 0.323 ± 0.108* 0.030 ± 0.004 0.03 ± 0.01 0.32 ± 0.1
Site 4 0.04 ± 0.003** 0.23 ± 0.066** 188.33 ± 15.9** 0.058 ± 0.006** 0.92 ± 0.11** 19.38 ± 5.91**
[image:3.595.55.539.241.328.2]Number of samples = 10, *Significant P<0.05; **Highly significant P < 0.001, Site 1: Ras EL-Bar, Site 2: Shatta, Site 3: Kafr EL-Bateekh and Site 4: Talkha.
Table 2. Concentrations of heavy metals (Pb, Cd, Fe, Zn and Cu) in water from sites 1, 2, 3 and 4.
Cu ppm Zn ppm
Fe ppm Cd ppm
Pb ppm Sites
0.063 ± 0.008 0.003 ± 0.0004
0.13 ± 0.034 0.01 ± 0.001
0
Site 1
0.073 ± 0.016 0.043 ± 0.009
0.20 ± 0.02*
0.012 ± 0.004 0
Site 2
0.115 ± 0.040*
0.086 ± 0.018**
0.182 ± 0.037 0.071 ± 0.009**
0.22 ± 0.08
Site 3
0.062 ± 0.018 0.436 ± 0.070**
0.269 ± 0.055*
0.013 ± 0.004 1.12 ± 0.11
Site 4
[image:3.595.57.539.366.455.2]Number of samples = 10, *significant P<0.05, ** highly significant P < 0.001, site 1-Ras EL-Bar, site 2-Shatta, site 3-Kafr EL-Bateekh and site 4-Talkha.
Table 3. Concentrations of heavy metals (Pb, Cd, Fe, Zn and Cu) in sediments from Sites 1, 2, 3 and 4.
Cu ppm Zn ppm
Fe ppm Cd ppm
Pb ppm Sites
9.65 ± 0.73 9.93 ± 1.12
487.03 ± 51.78 0.54 ± 0.14
1.78 ± 0.76
Site 1
11.87 ± 2.37*
10.16 ± 1.2 651.70 ± 11. 90**
0.86 ± 0.27*
2.86 ± 0.67*
Site 2
74.29 ± 6.82**
18.06 ± 2.28**
645.90 ± 55.04**
5.43 ± 1.19**
31.06 ± 5.52**
Site 3
51.32 ± 6.16**
34.49 ± 5.94**
696.70 ± 25.37**
0.75 ± 0.09*
26.47 ± 4.39**
Site 4
Number of samples = 10, *Significant P < 0.05, **Highly significant P < 0.001, Site 1: Ras EL-Bar, Site 2: Shatta, Site 3: Kafr EL-Bateekh and Site 4: Talkha.
Table 4. Heavy metals concentrations (Pb, Cd, Fe, Zn and Cu) in muscles of catfish from Sites 1, 2, 3 and 4.
Cu ppm Zn ppm
Fe ppm Cd ppm
Pb ppm Sites
0.23 ± 0.079 1.33 ± 0.43
11.57 ± 1.89 0.07 ± 0.02
1.22 ± 0.33
Site 1
0.23 ± 0.03 1.34 ± 0.22
11.60 ± 1.20 0.07 ± 0.01
1.19 ± 0.36
Site 2
1.05 ± 0.04**
5.78 ± 0.69**
27.80 ± 4.50**
0.17 ± 0.05**
11.90 ± 1.92**
Site 3
1.04 ± 0.05**
8.092 ± 1.47**
42.70 ± 5.90**
0.07 ± 0.01 11.24 ± 1.36**
Site 4
Number of samples = 10, *Significant P < 0.05, **Highly significant P < 0.001, Site 1: Ras EL-Bar, Site 2: Shatta, Site 3: Kafr EL-Bateekh and Site 4: Talkha.
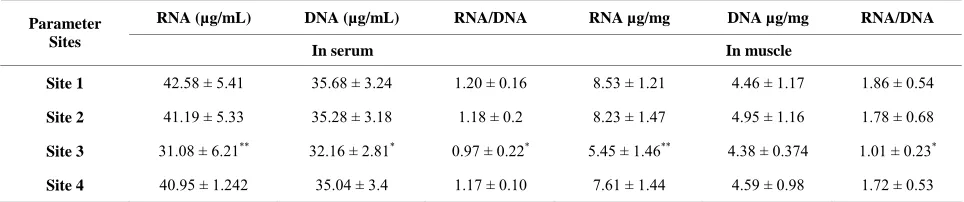
Table 5. RNA, DNA and RNA/DNA ratio in serum and muscle of catfish of Sites 1, 2, 3 and 4.
RNA (µg/mL) DNA (µg/mL) RNA/DNA RNA µg/mg DNA µg/mg RNA/DNA
Parameter Sites
In serum In muscle
Site 1 42.58 ± 5.41 35.68 ± 3.24 1.20 ± 0.16 8.53 ± 1.21 4.46 ± 1.17 1.86 ± 0.54
Site 2 41.19 ± 5.33 35.28 ± 3.18 1.18 ± 0.2 8.23 ± 1.47 4.95 ± 1.16 1.78 ± 0.68
Site 3 31.08 ± 6.21** 32.16 ± 2.81* 0.97 ± 0.22* 5.45 ± 1.46** 4.38 ± 0.374 1.01 ± 0.23*
Site 4 40.95 ± 1.242 35.04 ± 3.4 1.17 ± 0.10 7.61 ± 1.44 4.59 ± 0.98 1.72 ± 0.53
[image:3.595.54.539.494.582.2] [image:3.595.57.539.622.723.2]tration of Cd in water of Site 3 is higher (nearly 6 times) than that of the control. In addition, the levels of Zn in water of Sites 3 and 4 and Cu in water of Site 3 are highly significant increased compared to that of the con- trol. Also, Fe levels in water of Sites 2 and 4 are signifi- cantly increased compared to that of the control Table 2.
The concentration of Pb, Cd , Fe, Zn and Cu in sedi-ments of Sites 3 and 4 and Pb, Cd and Fe in sediment of Site 2 are highly significant increased compared to those of the control. Moreover, the levels of Cd in Sites 3 and 4 were 18 and 14 times, respectively more than that of the control Table 3.
In Table 4, the concentrations of Pb, Fe, Zn and Cu in
muscles of catfish from both Site 3 and Site 4 are highly significant increased compared to control. Also, the lev- els of Cd in muscles of catfish from Site 3 are highly sig- nificant increased compared to that of the control.
RNA and RNA / DNA ratio is highly significant de- crease in both serum and muscles of catfish from Site 3 and significantly decreased in Site 3 compared to that of the control.
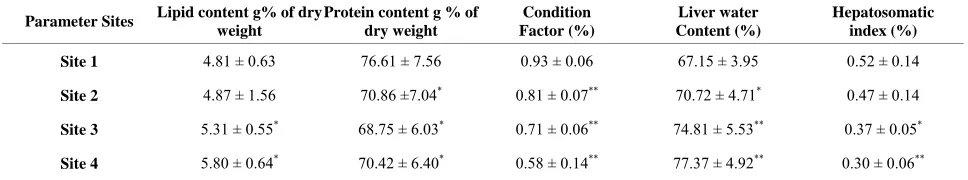
In Table 6, there is a highly significant decrease in
muscles protein content, condition factor and Hepatoso- matic index of catfish from Sites 3 and 4 compared to those of the control. Also, there is a highly significant decrease in protein content and condition factor of catfish from Site 2 compared to that of the control. On the other hand, there is a highly significant increase in lipid and liver water contents in catfish of Sites 3 and 4 compared to those of the control.
The correlations between the levels and contents of protein, RNA and DNA are illustrated in Table 7. The
Table shows negative correlation between both Pb and Cd levels and DNA, RNA and protein contents.
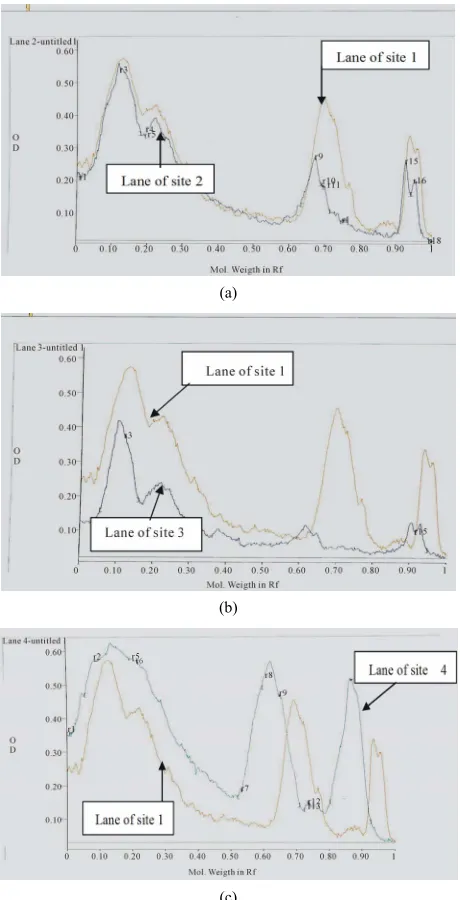
The electrophoresis and Gel pro-analysis of protein in serum of catfish from the different sites is illustrated in
Figures 1 and 2(a)-(c). It is appeared from Figure 2(b)
(Gel pro-analysis of protein of catfish from Site 3 that, two protein peaks disappeared.
5. Discussion
The present study is mainly concerned with the effect of pollution on catfish quality. The obtained results illus- trate highly significant increases in levels of nitrite, ni- trate and ammonia in water and sediment of Site 4 com- pared to that of the control. Similar results were also ob served in the concentration of nitrite and nitrate in water and sediment of Site 2 and ammonia in water of Sites 2 and 3. Wang et al., showed that, NO3 was mainly associ-
ated with agriculture activities [27] and nitrites are in- termediate products in the nitrification process of ammo- nia to nitrates and they are toxic to fish [28]. The toxicity of nitrite may be due to the reaction of nitrite with sec ondary amines to produce the carcinogenic nitrosamine [29]. These results agree with that recorded by other in- vistigators [30] including Mohammed et al., who re
corded a high level of nitrite (0.30 - 0.32 mg /L) in water of Qarun Lake [31].
The concentration of ammonia in both water and se- diment of Site 4 is nearly 900 and 60 times, respectively more than that of the control. This can lead one to con- clude that, the outlets of Talkha Fertilizers Factory is the source of ammonia elevation in Site 4 (188.3 mg/1). Ab- delhamid, recorded that the toxic level of NH3 for fish is
[image:4.595.56.540.533.623.2]0.6 - 2.0 mg/1 [32]. Taking together one can expect mus- cle and nuclear damage of the catfish living in such area which was already the case in this study.
Table 6. Lipid and protein content, condition factor, liver water content and hepatosomatic index of catfish from Sites 1, 2, 3 and 4.
Parameter Sites Lipid content g% of dry weight
Protein content g % of dry weight
Condition Factor (%)
Liver water Content (%)
Hepatosomatic index (%)
Site 1 4.81 ± 0.63 76.61 ± 7.56 0.93 ± 0.06 67.15 ± 3.95 0.52 ± 0.14
Site 2 4.87 ± 1.56 70.86 ±7.04* 0.81 ± 0.07** 70.72 ± 4.71* 0.47 ± 0.14
Site 3 5.31 ± 0.55* 68.75 ± 6.03* 0.71 ± 0.06** 74.81 ± 5.53** 0.37 ± 0.05*
[image:4.595.83.540.652.737.2]Site 4 5.80 ± 0.64* 70.42 ± 6.40* 0.58 ± 0.14** 77.37 ± 4.92** 0.30 ± 0.06**
Table 7. Correlations between Pb and Cd, and DNA, RNA and protein.
P value R value
Correlation between
0.02
−0.709 Pb (ppm) and protein percentage in muscles of catfish of Site 4
0.003
−0.828 Pb (ppm) and RNA content (µg/mg) in muscle of catfish of Site 3
0.017
−0.797 Cd (ppm) and RNA content (µg/mg) in muscle of catfish of Site 3
0.004
(a)
(b)
(c)
Figure 2. (a) A comparison between Pro analysis of elec- tropherograph of protein patterns in serum of catfish from Sites 2 and 1; (b) A comparison between Pro analysis of electropherograph of protein patterns in serum of catfish from Sites 3 and 1; (c) A comparison between Pro analysis of electropherograph of protein patterns in serum of catfish from Sites 4 and 1(control).
The concentrations of Pb in water of Sites 3 and 4, were 2.23 and 1.12 ppm, respectively these levels were above the permissible limit according to Mance, who reported that the critical concentration of Pb in fresh and salt wa-ters may range from 0.005 to 0.02 ppm [33]. In addition the concentration of Cd in water of Site 3 (0.071 ppm) was higher elevated than that of the permissible limit (0.05 ppm) as reported by FAO/WHO [34] and similar to that reported by Zaghloul [35] (0.063 and 0.097 ppm) in
water samples from different zones at Hel- wan city. Also, Fe level was significantly increased in water of Sites 2 and 4 compared to that of the control (Site 1). Zyadah, found high levels of Fe in the sediment and fish, which exceed the allowable limit in River Nile Estu-ary-Damietta branch, Egypt [36]. In addition, there were highly significant increases in zinc in water of Sites 3 and 4 and copper in Site 3 when compared to that of the control. Copper is an essential trace metal for physio- logical functions, while, copper overload causes cytotox- icity in living organisms including human [37]. Mo- hammed et al., recorded 0.096 - 0.12 ppm for zinc and
1.25 - 2.59 ppm for Cu in water of Qarun Lak’e [31]. The latter results lead one to conclude that the distribution patterns of Cu and Zn in the Lake water increased in hot seasons where the heavy metals will be released from sediments to the overlying water under the effect of both high temperature and decomposition of organic matter by fermentation [38]. On the contrary, the values of Cu and Zn decrease in the water during cold period due to pre- cipitation of heavy metals from water to the sediments under slightly high pH and the adsorption of heavy met- als onto organic matter as was reported by Goher [39].
The present findings of Cd level in sediment (5.4 ppm) and muscle of catfish (0.174 ppm) from site 3 were more than that of the control. Mohammed, recorded 0.05 - 6.14 ppm for Cd in sediments from different locations of Egypt [1]. Abdelhamid, mentioned that cadmium level in foods must not exceed 0.135 ppm and fish not exceed than 0.05 ppm in wet weight [28].
Moreover, the obtained data showed high elevation in the concentrations of Pb (9 times), Fe, Zn (5 times), and Cu (4 times) was more than that of the control in muscles of catfish of Sites 3 and 4. Similar results were reported by Sorensen, who stated that, the Pb uptake by aquatic organisms depend upon exposure time, aqueous Pb con- centration, pH, temperature and diet [40]. These expecta- tion is based on the finding of Somero et al., who stated
that, fish live at 20 - 25 C for 24 days accumulate Pb from two to twenty times more than fish live at 10 C [41]. In the present study, iron concentration in fish muscle is nearly similar to that reported by Zaghloul [35] (10.7 - 30.6 and 8.6 - 21.3 mg/kg wet weight).
[image:5.595.58.288.84.534.2]Nucleic acids play a major role on growth and devel- opment of the organism. The amount of DNA, the ge- netic information carrier, reflect the cell numbers [45,46]. The amount of RNA in the cell is directly proportional to the amount of protein synthesis occurring. The relation- ship between RNA and DNA is an index of the cell’s metabolic intensity and has been used to measure recent growth in fishes [47].
The decrease in RNA in muscle and serum of catfish of Site 3 in the present study may be due to the effect of heavy metals overload which was reported in this study especially in Sites 3 and 4. These increases in heavy met- als can disturb the biological activity of catfish, as well as nucleic acids and ribosomal activity [48]. The latter decreases can in turn cause decreases in protein biosyn- thesis including those of the muscle content of catfish which were collected from these sites. The results of the present study confirm those reported by Muhammad et al., who concluded that the decreased in RNA/DNA ratio
could be due to decreases in the ribosomal activity [49] and also that of Buckley and Bulow, who reported that the heavy metals have an inhibitory effect on protein biosynthesis via its effect on RNA and ribosomal activity [50].
Gel Pro analysis of the protein electrophoresis of dif- ferent sites revealed the disappearance of two protein peaks from serum of catfish of Site 3 and the appearance of new protein peaks in serum of catfish from Site 4. In addition, El-Demerdash and Elagamy, showed differ- ences in electrophoretic patterns of proteins prepared from Maryout and Nozha fish samples. The nutritional quality of Maryout fish proteins was lower than that of Nozha samples this may be due to lowering in the essen- tial amino acids contents as a result of the presence of high concentrations of Hg and Cd in Maryout samples than Nozha samples [51].
These findings were confirmed by the inverse rela- tionship between heavy metals concentration and protein content in muscles of catfish. In the same line Salem, concluded that Cd and Pb negatively affected fish body gain, protein efficiency ratio, chemical composition and muscles area [3]. These two metals were found to be re- sponsible for different types of chromosomal aberrations and lower mitotic index in the fish [52]. Demuynck add- ed that cadmium-binding protein level in the cells of in- testine was increased after exposure to Cd, so it appears that this protein will be synthesized as a response to Cd over exposure [52]. Abdelhamid and El-Ayouty, [11] men- tioned that the muscles protein content was decreased while that of fat and Pb contents in the fish muscles were increased in proportion to the pollution levels.
Condition factor is the percentage of whole live body weight divided by cubic length of fish. It is one of the most important growth condition of fish because it gives
an idea about the fish health and subsequently, the water quality [42]. A highly significant decrease in condition factor was found in Site 3 and Site 4. The lower percent- age in condition factor of fish which more collected from Sites 3 and 4 indicated that the pollution affects the water quality and subsequently, the growth of fish. As reported by Weatherley and Gill, the condition factor changes may reflect fairly and faithfully the changes in body pro- tein and lipid content [53]. It was appeared from the pre- sent study that, there was an inverse correlation between the hepatosomatic index and pollution. Therefore, a si- milar effect may occur in human intake such fish. These results are similar to that obtained by Abbas, who report- ed that, there was a significant decrease in the hepatoso- matic index of lead exposed fish [9]. This decrease may be attributed to the decomposition of liver tissues by the heavy metal overload. Finally, it can be concluded that the protein content and catfish quality are markedly af- fected by water pollution. Also, the heavy metal overload of such fish can cause sever health problems in man es- pecially kidney and liver.
REFERENCES
[1] A. H. I. Mohammed, “Biochemical Studies on the Effect of Pollution on the Fish Production in Dakhlia and Dami- etta,” Master Thesis, Fac., Agric. Man., University, Egypt, 1999.
[2] V. Rodríguez, D. A. de Cárcer, V. Loza, E. Perona and P. Mateo, “A Molecular Fingerprint Technique to Detect Pollution-Related Changes in River Cyanobacterial Di- versity,” Journal of Environmental Quality, Vol. 36, No. 2, 2007, pp. 464-468. doi:10.2134/jeq2006.0190SC [3] M. F. I. Salem, “Effect of Cadmium, Copper and Lead
Contamination on Growth Performance and Chemical Composition of Nile Tilapia,” Mansoura University Jour- nal of Agricultural Sciences, Vol. 28, 2003, pp. 7209- 7222.
[4] S. T. Tong and S. Naramngam, “Modeling the Impacts of Farming Practices on Water Quality in the Little Miami River Basin,” Journal of Environmental Management, Vol. 39, No. 6, 2007, pp. 853-866.
doi:10.1007/s00267-006-0307-6
[5] L. Goldfrank, N. Fomenbaum, N. Lewin, R. Weisman and M. Howland, “Toxicological Emergencies,” 5th Edition, Prentice Hall International, Inc., Upper Saddle River, 2001. [6] J. F. Klaverkamp, W. A. Macdonald, D. A. Duncan and R.
Wagmann, “Metallothionein and Acclimination to Heavy metals in Fish,” In: V. W. Cairs, P. V. Hodson and J. O. Nriogu, Eds., Contaminants Effects on Fisheries. A re- view. John Wiley & Sons, Hoboken, 1984, p. 99.
[7] G. Carbonell, C. Ramos and J. V. Tarazona, “Metals in Shrimp from Gulf of Fonseca Central America,” Bulletin of Environmental Contamination and Toxicology, Vol. 60, No. 2, 1998, pp. 252-259.
doi:10.1007/s001289900618
tion of Water Due to Major Industries and Open Refuse Dumping in the Steel City of Orissa a Case Study,” Jour- nal of Environmental Science and Engineering, Vol. 47, No. 2, 2005, pp. 141-154.
[9] H. H. Abbas, “Effect of Lead on Some Physiological Aspects of Nile Tilapia; Oreochromis niloticus,” M.Sc. Thesis, Cairo University, Cairo, 1994.
[10] A. S. Abou-El-Ezz and S. Abdel-Razeq, “Heavy Metals Ac- cumulation in the Tilapia Nilotica L., and in the Water of Lake EL-Manzalah,” Egyptian Journal of Applied Sci-ence, Vol. 6, No. 6, 1991, pp. 37-52.
[11] A. M. Abdelhamid and S. A. El-Ayouty, “Effect on Cat- fish (Clarias lazera) Composition of Ingestion Rearing Water Contaminated with Lead or Aluminum Com- pounds,” Archiv für Tierernähr, Vol. 41, No. 7-8, 1991, pp. 757-763.
[12] M. S. Ayyat, M. S. Safaa, S. A. Fayza and H. I. El-Ma- rakby, “Reduction of Dietary Lead Toxicity in Nile Tila- pia,” Egyptian Journal of Nutrition and Feeds, Vol. 6, 2004, pp. 419-431.
[13] S. J. Flora, G. Flora, G. Saxena and M. Mishra, “Arsenic and Lead Induced Free Radical Generation and Their Reversibility Following Chelating,” Cell and Molecular Biology, Vol. 53, No. 1, 2007, pp. 26-47.
[14] A. W. Hayes, “Priciples and Methods of Toxicology,” 3rd Edition, Raven Press Ltd., New York, 1994.
[15] B. S. Mohan and B. B. Hosetti, “Phytotoxicity of Cad-mium on the Physiological Dynamics of Salvinia natans L. Grown in Macrophyte Ponds,” Journal of Environ- mental Biology, Vol. 27, No. 4, 2006, pp. 701-704. [16] R. I. El Fayoumi, “Studies on physiological changes
In-duced in Some Egyptian Fishes by Some Ecological Fac-tors and the Gill Parasites,” Ph.D. Thesis, Mansoura Un- versity, Mansoura, 2000.
[17] C. A. Black, “Methods of Soil Analysis,” Soil Science Society of America, Medison, 1965.
[18] D. L. Heans, “Determination of Nitrite in Soil and Water by Adoption of the Orange,” Method Analyst (London), Vol. 100, 1975, pp. 316-321.
[19] A. Merck, “Medico-Chemical Investigation Methods,” 11thEdition, Dormstadt, 1974.
[20] F. Rosner and P. C. Gorfien, “Erythrocytes and Plasma Zinc and Magnesium Levels in Health and,” 1968. [21] V. D. Sidwell, B. R. Stillings and G. M. Knobel, “The
Fish Protein Concentration. Nutritional Quality and Use in Foods,” Journal of Food Technology, Vol. 14, No. 8, 1970, pp. 40-46.
[22] V. Kohla, “Hepatologische Veranerungen Bei Jumgen Colossoma Macropmum in Abhngigkeit Unerschiedicher. Fattermittel and Wahrend Einer Mehr Wochigen Hun-gerphase,” Diplomarbit unv. Hamburg, 1988, pp. 320- 324.
[23] AOAC (Association of Official Analytical Chemists), “Official Methods of Analysis of the Association of Offi- cial Analytical,” 13th Edition, Association of Official Ana- lytical Chemists, Inc., 1984.
[24] T. Peters, “Determination of Total Serum Protein,” Cli-
nical Chemistry, Vol. 14, 1968, pp. 1147-1152.
[25] W. Keith and W. John, “Principles and Techniques,” In: Practical Biochemistry, Cambridge University, Cam- bridge, 1994, p. 425.
[26] W. C. Schneider, G. N. Hogeboom and H. E. Ross, “The Distribution of Nucleic Acids and Adenosine Triphos-phatase in Normal Mouse Liver and Mouse Hepatoma,” J. Inc. Cancer Inst., Vol. 10, 1950, pp. 977-980.
[27] L. Wang, Y. Wang, C. Xu, Z. An and S. Wang, “Analysis and Evaluation of the Source of Heavy Metals in Water of the River Changjiang,” Environmental Monitoring and Assessment, Vol. 173, No. 1-4, 2011, pp. 301-313. [28] A. M. Abdellhamid, “Field and Laboratory Analysis Ani-
mal Production,” Egyptian University, Cairo, 1996. [29] O. M. Ali, “Study on the Pollution in EL-Manzalah Lake,”
National Conference of the Environment of Lake EL- Manzalah, Posrsaid, 27-29 October 1991, pp. 14-17. [30] S. Nayar, D. J. Miller, A. Hunt, B. P. Goh and L. M.
Chou, “Environmental Effects of Dredging on Sediment Nutrients, Carbon and Granulometry in a Tropical Estu- ary,” Environmental Monitoring and Assessment, Vol. 127, No. 1-3, 2007, pp. 1-13.
doi:10.1007/s10661-006-9253-2
[31] M. A. Mohamed, M. M. Abd-Elaty, W. I. El-Shall, A. B. Ramadan and M. S. Tawfik, “Environmental Impacts of Cooling System on Abou Qir Bay,” The Journal of the Egyptian Public Health Association, Vol. 80, No. 5-6, 2005, pp. 585-605.
[32] A. M. Abdelhamid, “Scientific Fundamentals of Fish Pro- duction and Husbandry,” 2nd Edition, Mansoura Univer-sity Press, 2003.
[33] G. Mance, “Pollution Threat of Heavy Metals in Aquatic Environments,” Elsevier Applied Science Publishers LTD, London and New York, 1987.
doi:10.1007/978-94-009-3421-4
[34] FAO/WHO, “Codex Alimentarius Commission, Standard Programme Codex Committee on Food Additives and Contaminates,” 24th Session, Hague, 23-28 March 1992. [35] K. H. Zaghloul, “Studies on the Effect of Water Pollution
along Different Sites of the River Nile on the Survival and Production of Some Freshwater Fishes,” M.Sc. The- sis, Cairo University, Cairo, 1997.
[36] M. A. Zyadah, “A Study on Levels of Some Heavy Met- als in River Nile Estuary—Damietta Branch,” Egypt. J. Egypt. Ger. Soc. Zool., Vol. 23, 1997, pp. 149-160. [37] H. R. Chen, H. C. Yang, D. J. Hsieh, Z. Liu and K. J. Tsai,
“Zebrafish sod1 and sp1 Expression Are Modulated by the Copper ATPase Gene atp7a in Response to Intracel- lular Copper Status,” Chemico-Biological Interactions, Vol. 189, No. 3, 2011, pp.
192-7doi:10.1016/j.cbi.2010.12.003
[38] A. A. Elewa, M. B. Shehata, A. M. Abdel Satar, M. H. H. Ali and M. E. Gohar, “Effect of the Drainage Water on Lake Qarun Ecosystem, Egypt,” 9th international Con- ference on the Conservation and Management of Lakes, 11-16 November 2001, pp. 108-125.
Ph.D. Thesis, Al-Azhar University, Cairo, 2002.
[40] E. M. B. Sorensen, “Metal Poisoning in Fish,” Oxford and I. B. H Publishing Co. Bombay, 1991.
[41] G. N. Somero, T. J. Chow, P. H. Yancey and C. B. Sny- der, “Lead Accumulation Rates in Tissues of the Estua- rine Teleost Fish, Gillichthys Mirabilis: Salinity and Tem- perature Effects,” Archives of Environmental Contamina- tion and Toxicology, Vol. 6, No. 2-3, 1977, pp. 337-348.
doi:10.1007/BF02097774
[42] E. R. Clark and J. A. L. Fraser, “The Survival and Growth of Six Species of Freshwater Fish, in Tap Water and Di-luted and UndiDi-luted Effluents from Sewage Percolating Filters,” Journal of Fish Biology, Vol. 22, No. 4, 1983, pp. 431-445. doi:10.1111/j.1095-8649.1983.tb04765.x [43] A. M. Abdellhamid, “Scientific Fundamentals for Fish Pro-
duction and Management,” Egyptian University, Cairo. [44] A. M. Abdel Moneim, A. A. M. Khaled and M. F. Is-
kander, “A Study on the Levels of Some Heavy Metals in EL-Mex, West Alexandria, Egypt,” Proceedings of the 4th Conference of the Environment Protection, 10-12 May 1994, pp. 155-174.
[45] WHO (World Health Organization), “Guide Lines for Drinking Water Quality,” 3rd Edition, Geneva, 1984. [46] Q. T. L. Dortch, J. R. Roberts, J. R. Clayton and S. I.
Ahmed, “RNA/DNA Ratios and DNA Concentrations as Indicators of Growth Rate and Biomass in Planktonic Marine Organisms,” Marine Ecology Progress Series, Vol. 13, 1983, pp. 61-71.
doi:10.3354/meps013061
[47] F. J. Bulow, “RNA-DNA Ratios as Indicators of Growth in Fish: A Review,” In: R. C. Summerfelt and G. E. Hall, Eds., Age and Growth in Fish, Iowa State University
Press, Ames, 1987, pp. 45-64.
[48] E. M. Mathers, D. F. Houlihan, I. D. McCarthy and L. J. Burren, “Rates of Growth and Protein Synthesis Corre- lated with Nucleic Acid Content in Fry of Rainbow Trout, Oncorhynchus mykiss: Effects of Age (Burchell 1822), Fed Diets with Varying Protein Concentrations,” Journal of Animal Physiology and Animal Nutrition, Vol. 88, No. 7-8, 1993, pp. 275-287.
[49] A. Muhammad, R. Iqbal, S. A. Rana, M. Athar and F. Iqbal, “Effect of Feed Cycling on Specific Growth Rate, Condition Factor and RNA/DNA Ratio of Labeo rohita,” African Journal of Biotechnology, Vol. 5, No. 17, 2006, pp. 1551-1556.
[50] L. J. Buckley and F. J. Bulow, “Techniques for the esti-mation of RNA, DNA, and Protein in Fish,” In: R. C. Summerfelt and G. E. Hall, Eds., The Age and Growth of Fish, The Iowa State University Press, Ames, 1987, pp. 345-354.
[51] F. M. El-Demerdash and E. I. Elagamy, “Cadmium and Mercury,” International Journal of Environmental Health Research, Vol. 9, No. 3, 1999, pp. 173-186.
doi:10.1080/09603129973146
[52] S. Demuynck, B. B. Muchembled, L. Delaffre, F. Gru- miaux and A. Lepretre, “Stimulation by Cadmium of Myohemerythrin-Like Cells in the Gut of the Annelid Nereis Diversicolor,” The Journal of Experimental Biol- ogy, Vol. 207, No. 7, 2004, pp. 1101-1111.
doi:10.1242/jeb.00858
[53] A. H. Weatherey and H. S. Gill, “Relative Growth of Tissues at Different Somatic Growth Rates in Rainbow Trout, salmo gairdneri Richardson,”Journal of Fish Bi- ology, Vol. 22, No. 1, 1983, pp. 43-60.