ISSN Print: 2331-4222
The Impact of Poverty Alleviation Policy on
Urban Household Demand
Wen Yu
1,2, Muhammad Yaseen
3, Yu Wang
1,2, Shiwei Xu
1,2*, Jiajia Liu
1,2, Liwei Gao
1,2, Peng Li
41Agricultural Information Institute, Chinese Academy of Agricultural Sciences, Beijing, China
2Key Laboratory of Digital Agricultural Early-Warning Technology, Ministry of Agriculture, Beijing, China 3University College of Agriculture, University of Sargodha, Sargodha, Pakistan
4School of Accounting, Zhejiang Gongshang University, Hangzhou, China
Abstract
Many policies and measures for poverty alleviation have been undertaken by the Chinese government, but few researchers have explored its experience and lessons. This research focuses on household needs like food, clothing, hous-ing, household equipment and supplies, transportation and communication, education and entertainment, healthcare; and also focuses on food items such as grains, meat, eggs, milk, vegetables, fruits and others in urban China. In poor households, the average disposable income per capita is less than or near per capita expenditure; and the Engels coefficient is often over 40%. The data from 1997-2012 in this research is in the provincial level from the Information Website of Development Research Center of the State Council (or “DRCnet”). The authors used the two stage ELES-AIDS (Almost Ideal Demand System) to estimate the price elasticity and expenditure elasticity of the household’s ex-penditures. According to the results, it is recommended that the government should follow economic law and improves policy efficiency, especially its food policy to alleviate the poverty of low income residents.
Keywords
Poverty Alleviation, Urban Household, Two Stage ELES-AIDS, China
1. Introduction
After economic reform since 1980s in China, more and more people choose to work and live in city, especially for rural, off-farm job providing opportunity for a great number of the surplus rural labor force; in the meantime, which maybe make poverty transfer from rural to urban.
How to cite this paper: Yu, W., Yaseen, M., Wang, Y., Xu, S.W., Liu, J.J., Gao, L.W. and Li,P. (2017) The Impact of Poverty Alleviation Policy on Urban Household Demand. World Journal of Engineering and Technology, 5, 40-46.
https://doi.org/10.4236/wjet.2017.52B005
Up till now, more authors focus on rural poverty, but pay less attention to the low-income group in urban. Thought many researchers focus on household consumption, they just focus on the food security, rarely considering about the policy implication [1].
This paper will use the two stage ELES-AIDS (Almost Ideal Demand System) to estimate the price elasticity and expenditure elasticity including food, cloth-ing, houscloth-ing, family equipment, communication and transformation, education, health care, and others etc. According to the results, it is recommended that the government should follow economic law and improve policy efficiency, espe-cially its food policy to alleviate the poverty of low income residents.
The frame of the paper is arranged in the following: except for the introduc-tion, the next part is Data and its expression, A Two-Stage ELES-AIDS Model, results, conclusions and policy implication.
2. Data and Its Expression
All data in this research is from the Information Website of Development Re-search Center of the State Council (or “DRCnet”, http://www.drcnet.com.cn).
The urban household data is collected from 1997 to 2012 grouped by disposa-ble income, including the lowest (among which, also separated half for the diffi-cult group), the lower, the middle-lower, the middle, the middle-higher, the higher and the highest; their proportion of the group accounts for 10% (includ-ing 5% of difficult group), 10%, 20%, 20%, 20%, 10% and 10%, respectively. And these groups denotes Lowest, difficult, lower, mid-lower, middle, mid-higher, higher, highest in the table in the following.
3. Two-Stage ELES-AIDS Model
Due to weakly separable utility over broad groups of goods, usually we allocate broad group of goods over total expenditure at first; then allocate group expend-iture over individual commodities.
3.1. ELES Model
Define abbreviations and acronyms the first time they are used in the text, even after they have been defined in the abstract. Abbreviations such as IEEE, SI, MKS, CGS, sc, dc, and rms do not have to be defined. Do not use abbreviations in the title or heads unless they are unavoidable.
Due to weakly separable utility over broad groups of goods, usually we allo-cate broad group of goods over total expenditure at first; then alloallo-cate group ex-penditure over individual commodities. The extended linear exex-penditure system (ELES) is based on the basis of the linear expenditure system [2].
The ELES model expression is as follows:
i i i
V a bY= + (1) Here, Vi is the annual expenditure of a household spending on goods or
i
b could be calculated, is the marginal propensity to consume (MPC).
In economics, the marginal propensity to consume (MPC) is the concept that the increase in personal consumer spending (consumption) occurs with an in-crease in disposable income. The proportion of disposable income which indi-viduals spend on consumption is called as propensity to consume.
Mathematically, the definition of MPC function is expressed in the following: MPC = ΔC/ΔY, ΔC-the change in consumption; ΔY-the change in disposable income that produced the consumption. Usually, we use the OLS to estimate the MPC like b in function (1).
3.2. AIDS Model
Deaton and Muellbauer [3] have developed the linear approximate almost ideal demand system (LA/AIDS), which was used to estimate price and income elas-ticities. The AIDS model only illustrates the axioms of choice, but does reflect preferences and other social and economic factors.
The AIDS demand function used in this study is in the following:
where the wi is the expenditure share of the ith food or food group, X is living
expenditure and Zs are social and demographic variables (preference, household size, coefficient of family burden, income source, region, and so on.), x is the to-tal expenditure, Pj are prices of food group items, and lnP* is a Stone price index.
αi, βi, γij, α is are parameters to be estimated.
Stone Price Index, that is:
lnP=
∑
kw Piln (2)The model must meet the following restrictions:
1, 0, 0, 0,
i i ij ij ij ji
i i r j r r r
α = β = = = =
∑
∑
∑
∑
In practice, the LA-AIDS model is used more frequently than the non-linear AIDS model [4]. The estimates from an LA-AIDS model would approach the es-timates for AIDS except for an intercept term.
Expenditure elasticities and Marshallian (compensated) elasticities were com- puted from the estimated parameters of the LA-AIDS model using the close ap-proximation of the exact formulas are given in Equations (3)–(4).
Expenditure elasticities:
1 i
i i
w β
η = + (3)
Marshallian (uncomensated) price elasticities:
j ij i j
i
ij ij
j i i i
p w
q
p q w w
γ β
ε = ∂ = − +δ −
∂ (4)
while i = j, δ = 1, or δ = 0.
4. Results
estimation of demand elasticities show in the following:
4.1. Marginal Propensity to Consume
There are eight commodity groups for the stage of the demand system: food, clothing, housing, family equipment, transportation, education, health care, and other commodities.
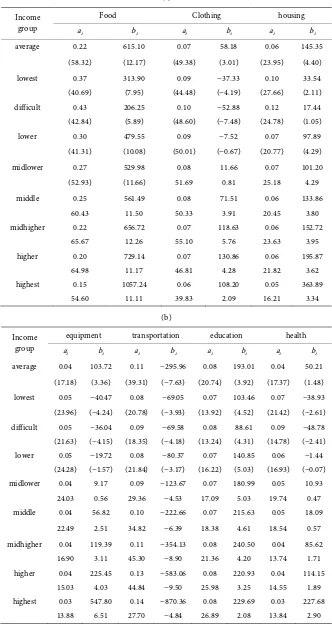
From ELES model, the results for the first-stage commodity groups are pre-sented in Table 1. All parameters are significant at the 1% level. Here we just focus on marginal propensity to consume, neglecting the expenditure elasticities and price elastic.
Food: In the urban household, averagely 22% of income is used for food con-sumption, but for difficult group, the proportion reaches 43%; while the highest income group the proportion is only 15%; from absolute value, the difficult group has less expenditure for food.
Clothing: about 10% of income is used for clothing, and in the lowest group, its proportion is 10%, the proportion for other groups ranges from 6% - 8%.
Housing: comparing with the average level, the difficult group spends 12% income for housing, as is the double times to average level; except the lowest group, its housing proportion is 10%, and the others range 5% to 7%.
Health: the average proportion of health care expenditure is 4%, but difficult group account for 9% from income share.
There is no more different in the consumption tendency of family equipment, transportation, education, and others between different income groups.
Generally, for the lowest group, especially difficult group, lower group have higher share in food, clothing, health and housing expenditure.
4.2. Estimation of Demand Elasticities
The diagonal number in each group of Table 2 indicates the own-price elastici-ties. The own-price elasticities are negative sign, as show that food demand structure is related to the market price; and the group for low income is more sensitive than other groups, for almost all own-price elasticities are higher than other two groups.
From the cross-price elasticities within the food group have positive signs, implying that major food items have substitute relationship; and the negative cross-price elasticities means the complement relationship.
The second stage consists of six commodities within the food group: grain, meat (pork, lamb, beef, chicken, etc.), egg, aquatic, milk and other food items.
Considering the sample number in the model, the samples are separated into 3 kinds: low group, middle group and high group.
Table 1. The Estimation of Elasticities from ELES model. (a)
Income group
Food Clothing housing
ai bi ai bi ai bi
average 0.22 615.10 0.07 58.18 0.06 145.35
(58.32) (12.17) (49.38) (3.01) (23.95) (4.40)
lowest 0.37 313.90 0.09 −37.33 0.10 33.54
(40.69) (7.95) (44.48) (−4.19) (27.66) (2.11)
difficult 0.43 206.25 0.10 −52.88 0.12 17.44
(42.84) (5.89) (48.60) (−7.48) (24.78) (1.05)
lower 0.30 479.55 0.09 −7.52 0.07 97.89
(41.31) (10.08) (50.01) (−0.67) (20.77) (4.29)
midlower 0.27 529.98 0.08 11.66 0.07 101.20
(52.93) (11.66) 51.69 0.81 25.18 4.29
middle 0.25 561.49 0.08 71.51 0.06 133.86
60.43 11.50 50.33 3.91 20.45 3.80
midhigher 0.22 656.72 0.07 118.63 0.06 152.72
65.67 12.26 55.10 5.76 23.63 3.95
higher 0.20 729.14 0.07 130.86 0.06 195.87
64.98 11.17 46.81 4.28 21.82 3.62
highest 0.15 1057.24 0.06 108.20 0.05 363.89
54.60 11.11 39.83 2.09 16.21 3.34
(b)
Income group
equipment transportation education health
ai bi ai bi ai bi ai bi
average 0.04 103.72 0.11 −295.96 0.08 193.01 0.04 50.21 (17.18) (3.36) (39.31) (−7.63) (20.74) (3.92) (17.37) (1.48) lowest 0.05 −40.47 0.08 −69.05 0.07 103.46 0.07 −38.93 (23.96) (−4.24) (20.78) (−3.93) (13.92) (4.52) (21.42) (−2.61) difficult 0.05 −36.04 0.09 −69.58 0.08 88.61 0.09 −48.78 (21.63) (−4.15) (18.35) (−4.18) (13.24) (4.31) (14.78) (−2.41) lower 0.05 −19.72 0.08 −80.37 0.07 140.85 0.06 −1.44
(24.28) (−1.57) (21.84) (−3.17) (16.22) (5.03) (16.93) (−0.07) midlower 0.04 9.17 0.09 −123.67 0.07 180.99 0.05 10.93
24.03 0.56 29.36 −4.53 17.09 5.03 19.74 0.47 middle 0.04 56.82 0.10 −222.66 0.07 215.63 0.05 18.09
22.49 2.51 34.82 −6.39 18.38 4.61 18.54 0.57 midhigher 0.04 119.39 0.11 −354.13 0.08 240.50 0.04 85.62
16.90 3.11 45.30 −8.90 21.36 4.20 13.74 1.71 higher 0.04 225.45 0.13 −583.06 0.08 220.93 0.04 114.15
15.03 4.03 44.84 −9.50 25.98 3.25 14.55 1.89 highest 0.03 547.80 0.14 −870.36 0.08 229.69 0.03 227.68
13.88 6.51 27.70 −4.84 26.89 2.08 13.84 2.90
Table 2. Estimated price and expenditure elasticities within the food group.
Price Elasticities Expenditure
Elasticities group item grain meat egg aquatic milks others
low grain −0.543 −0.218 0.046 −0.088 −0.145 −0.101 0.384 meat −0.408 −0.996 −0.044 −0.061 0.098 0.014 1.457 egg 0.124 −0.069 −0.723 −0.116 0.029 −0.066 0.796 aquatic −0.279 −0.068 −0.075 −0.620 −0.056 0.011 1.100 milks −0.739 0.232 −0.012 −0.150 −1.362 0.345 2.014 others −0.110 0.042 −0.013 0.003 0.042 −1.034 0.996 middle grain −0.473 0.042 0.012 −0.066 −0.100 −0.119 0.659 meat 0.043 −0.556 0.028 −0.054 −0.110 −0.115 0.728 egg 0.034 0.078 −0.614 −0.112 −0.061 −0.107 0.750 aquatic −0.125 −0.087 −0.053 −0.770 −0.040 0.017 1.067 milks −0.296 −0.266 −0.060 −0.097 −0.868 0.147 1.507 others −0.054 −0.040 −0.013 0.004 0.030 −1.082 1.059 high grain −0.283 −0.103 0.004 0.033 0.011 0.172 0.040 meat −0.153 −0.623 0.017 −0.065 0.130 0.332 0.268 egg −0.025 0.037 −0.691 0.086 −0.214 0.316 0.415 aquatic −0.076 −0.174 0.015 −0.739 −0.217 −0.029 1.252 milks −0.139 0.182 −0.205 −0.392 −1.065 0.075 1.624 others −0.074 −0.014 −0.001 0.010 0.027 −1.063 1.268
Source: the authors calculate through models.
5. Conclusions and Policy Implication
From the MPC results, local government should pay more attention to food, clothing, and health care and housing for lowest group, because these expendi-tures take more money from their limited disposable income.
From expenditure elasticities, aquatic and milk at more than 1, urban demand for aquatic and milk will increase, and meat will also rise, because the low groups (accounting for 20% in total group) have strong demand if they have higher in-come. So a better policy for poor residents is to increase their chance to earn money, so as to raise their payment power.
Acknowledgements
This paper was supported by the CAAS Science and Technology Innovation Project (number: CAAS-ASTIP-2016-AII), funded by Chinese Academy of Agricultural Sciences; by NSFC (Number: 71233007) and by MOST (Number: 2016YFE0113100).
References
[2] Chen, J. and Wu, L.P. (2009) An Analysis on Change of Consumer Demand and Consumer Structure of Chinese Urban Residents—Based on ELES Model. Journal of Shihezi University (Philosophy and Social Sciences), 23, 49-53.
[3] Deaton, A. and Muellbauer, J. (1980) An Almost Ideal Demand System. The Amer-ican Economic Review, 70, 312-326.
[4] Fan, S., Eric, J.W. and Cramer, G.L. (1995) Household Demand in Rural China: A Two-Stage LES-AIDS Model. American Journal of Agricultural Economics, 77, 847- 858. https://doi.org/10.2307/1243888
Submit or recommend next manuscript to SCIRP and we will provide best service for you:
Accepting pre-submission inquiries through Email, Facebook, LinkedIn, Twitter, etc. A wide selection of journals (inclusive of 9 subjects, more than 200 journals)
Providing 24-hour high-quality service User-friendly online submission system Fair and swift peer-review system
Efficient typesetting and proofreading procedure
Display of the result of downloads and visits, as well as the number of cited articles Maximum dissemination of your research work
Submit your manuscript at: http://papersubmission.scirp.org/