Munich Personal RePEc Archive
Strategic Decision-Making in Hollywood
Release Gaps
Dalton, John and Leung, Tin Cheuk
December 2013
Strategic Decision-Making in Hollywood
Release Gaps
∗
John T. Dalton
†Wake Forest University
Tin Cheuk Leung
‡Chinese University of Hong Kong
December 2013
Abstract
Hollywood blockbusters are usually released in the U.S. before other foreign markets. The release gaps have declined significantly over time and varied greatly across countries. While movie piracy has been suggested as an important determinant for the release gap de-cision of distributors, theory and evidence suggest there are other important determinants. In this paper, we use a discrete choice release gap decision game model to disentangle the impacts of the i) release gap effect, which includes factors that provide incentives for a distributor to shorten the release gap; ii) word-of-mouth effect, which provides incentives for a distributor to lengthen the release gap; and iii) strategic effect, which accounts for the incentives blockbusters have to avoid each other. We obtain box office and release gap data from the private industry source Boxofficemojo.com. Our results suggest all three factors have an economically significant impact on distributors’ release gap decision.
JEL Classification: F14, L82, 034
Keywords: Hollywood, movie exports, release gap, intellectual property rights
∗We thank Caitlin Dourney for valuable research assistance. We also thank seminar participants at Peking U
HSBC School for their many suggestions and comments. Financial support from the Farr Funds at Wake Forest University is gratefully acknowledged. The usual disclaimer applies.
†Contact: Department of Economics, Carswell Hall, Wake Forest University, Box 7505, Winston-Salem, NC
27109. Email: [email protected]
‡Contact: Department of Economics, Chinese University of Hong Kong, 914, Esther Lee Building, Chung Chi
1
Introduction
Movie executives fear the collapse of Hollywood exports in the face of rising worldwide piracy rates. Yet box office sales growth remains stable. According to the Motion Picture Association of America (MPAA), U.S./Canadian and international box office sales grew 12% and 32% between 2008 and 2012.1 The movie industry must be doing something right.
One characteristic of the movie industry often mentioned in connection with piracy is the release gap between when a movie appears in the U.S. and a foreign market. Hollywood studios try to preempt piracy by releasing movies as quickly as possible. Industry observers often note the decline in movie release gaps worldwide, a point made by Eliashberg, Elberse, and Leenders (2006). Looking at the years 1980, 1990, 2000, and 2010, for example, we observe this trend when comparing the average release gap for those top ten box office hits from the U.S. which were also released in Hong Kong. The average release gap declines from 168 days in 1980, a year which saw the hits Star Wars: Episode V - The Empire Strikes Back (1980) and The Blues Brothers (1980), to 149 days in 1990 to 43 days in 2000 to 20 days in 2010. Out of the top ten movies in 2010, two were released first in Hong Kong, one was released on the same day in both the U.S. and Hong Kong, and one was released less than a week later in Hong Kong.2 McCalman
(2005) provides evidence that the release gap has a non-linear relation to the level of intellectual property rights in a country: either very weak or very strong protection of intellectual property rights is associated with a longer release gap.
Although piracy affects release gaps, it is only one of many possible factors contributing to the release gap decisions made by Hollywood studios. We categorize the factors contributing to release gap variation observed in the data into three main effects: the release gap effect, word-of-mouth effect, and strategic effect.
The release gap effect refers to factors that provide incentives for a distributor to shorten the release gap. These include i) the prevalence of digital cinema, which can significantly reduce the duplication and delivery cost of a movie, estimated to be approximately 3.5% of the total cost to create and distribute a movie (Husak (2004)), and ii) movie piracy, which has become
1
We use the MPAA’s Theatrical Market Statistics 2012 for various statistics throughout the paper. This
report currently resides athttp://www.mpaa.org/policy/industry
2
more important after the spread of Peer-to-Peer (P2P) file sharing technology.
The word-of-mouth effect refers to the positive effect of longer release gaps on box office performance. In particular, a longer release gap allows a movie more time to accumulate box office revenue in the U.S. market and, thus, more positive word-of-mouth in the foreign market. Moul (2007) shows word-of-mouth has a positive impact on domestic box office performance. Elberse and Eliashberg (2003) argues that U.S releases act as a filter which selects the more successful movies to be released abroad.
The strategic effect refers to the interactions among Hollywood distributors. Distributors want to release movies on popular movie-going weekends, like the Fourth of July in the U.S., but also want to avoid competition from other blockbusters. Krider and Weinberg (1998) cites, for example, a Vice President of Warner Brothers:
...all studios, including Warner Brothers, are constantly moving their opening dates, and we shift the pictures around the calendar in an effort to find the ideal release date for each picture on our schedule. Because the opening weekend is so critical, it is even more critical that we find exactly the right date for each movie.
This same Vice President cites the primary concern about the release date as being competition from other movies with a similar target audience. Krider and Weinberg (1998) relates an example of a studio adjusting its release date in the face of competition during the Christmas season of 1992. Columbia Pictures moved its release date of A Few Good Men (1992) from December 18 to December 11, which coincided with the release date of Twentieth Century Fox’s Hoffa (1992). Both movies star the actor Jack Nicholson. Twentieth Century Fox feared losing ticket sales and moved the release of Hoffa (1992) to December 25. Strategy regarding release dates may also apply to foreign markets.
re-parameterize the movie’s quality as a function of the length of release gap and the expected accumulated U.S. box office to account for the release gap effect and word-of-mouth effect. We then take the season in which a movie is released as given and focus on the strategic decision of the release gap within the season.
We estimate the model using data on box office performance and release dates from the U.S. and 17 other countries between 2008 and 2012. For computational concerns, we choose four annual release seasons (President’s Day, Memorial Day, Fourth of July, and Thanksgiving), all at around a dominant U.S. release date, to test our empirical model. We also only consider the strategic interaction between the top two Hollywood movies in each season. Our results suggest three things. First, word-of-mouth has a positive impact on the length of the release gap. In particular, we conduct a counterfactual in which a movie would receive all its box office revenue from its entire run in the first week in the U.S., which would reduce the incentive for the distributor to have a longer release gap. Our counterfactual results suggest the release gap would indeed decrease by almost 0.27 weeks (5.39%) on average across the 17 countries. Second, the release gap effect has a negative impact on the length of the release gap. When the release gap effect disappears, the average release gap across 17 countries would increase by 0.54 weeks (10.79%). Third, the dominant movie in the season is less responsive to changes in the release gap effect and word-of-mouth effect.
The remaining sections of our paper are organized as follows: Section 2 reviews the extensive and growing literature on box office revenues, piracy, and international trade in movies. Section 3 briefly discusses the movie industry in general and in the context of movie piracy and release gap trends. Section 4 describes our model of the release gap decision. Section 5 describes our data set we use in our analysis, while sections 6 and 7 present our estimates and counterfactuals. Section 8 concludes.
2
Literature Review
Zhang, and Awad (2007), Duan, Gu, and Whinston (2008) , and Moul (2007) evaluate the effects of user reviews and word-of-mouth on box office revenues. A few papers have analyzed other factors, such as a movie’s script (Eliashberg, Hui, and Zhang (2007)), advertising (Rennhoff and Wilbur (2011)), and the presence of big stars (Elberse (2007)).
On top of these factors, there is a growing literature that attempts to evaluate the impact of piracy on box office revenues. Rob and Waldfogel (2007) collect survey data from 500 students from the University of Pennsylvania and find the displacement effect to be approximately 0.2. Zentner (2010) uses a panel of country-level data on movie consumption and broadband penetra-tion to evaluate the effect of P2P file sharing on retail purchases as well as on box office revenue. He finds P2P file sharing has a large and negative impact on retail purchases but no statistically significant impact on box office revenue. DeVany and Walls (2007) finds a single widely-released movie lost $40 million in revenue due to pre-release and contemporaneous Internet downloads of the movie. Ma, Montgomery, Singh, and Smith (2013) use U.S. box office data together with unique Internet file-sharing data and find pre-release piracy can lead to a 20% decrease in box office revenue compared to piracy that occurs post-release. Danaher and Waldfogel (2012) make use of the variation in international release gaps and box office performances in 17 countries, together with time breaks for the adoption of BitTorrent, to identify the effect of release gaps on box office performances. Their results indicate international box office returns were at least 7% lower than they would have been in the absence of pre-release piracy. Danaher, Smith, and Telang (2014) provide a review of the recent literature.
movies. This variation across the intensive margin, not the extensive margin, differs from trade in manufacturing, since most studies find the extensive margin plays an important role in trade in manufacturing.3 Bridgman (2012) finds results consistent with Hanson and Xiang (2011)
but for the case of a particular company, United Artists, during the period 1935 to 1949, thus, providing a look at the historical data on trade in services. Ferreira, Petrin, and Waldfogel (2012) employs a structural econometric model of the global movie industry to quantify the gains from trade from importing U.S. movies. Half of these gains from trade result from access to higher quality movies.
3
Industry Background
This section provides a brief overview of the relevant aspects of the movie industry for our study. We first describe some of the key features of box office performance in general. We then discuss movie piracy as motivation for our discussion on release gap trends.
3.1
Box Office Performance
DeVany (2004) argues one of the defining features of the movie industry is the “wild” uncertainty producers face regarding the performance of their products. This uncertainty remains after a movie’s initial release. DeVany (2004) reports the median box office revenue of a movie is better predicted by week five or week eight revenues than by week one revenues. Even the presence of super star celebrities, like Julia Roberts or Brad Pitt, do not guarantee success. Super stars only impact the minimum box office revenue, not the maximum, a movie earns.
There appears to be large amounts of heterogeneity across production costs and box office performance in the industry as well. DeVany (2004) finds the distributions of costs and box office revenue have large right tails. The world of movies is Pareto, not Normal. The top 20% of movies earn 80% of the revenue. A movie dropping from the number one weekly box office rank to the number two rank experiences a decline in weekly revenue of $2.4 million, whereas a movie dropping from four to five loses $235,000.
3
Movies’ box office lives also vary. DeVany (2004) reports the average movie life as being close to six weeks. If a movie debuts in the top 50 box office list, it has less than a 25% chance of remaining there for more than seven weeks.
3.2
Movie Piracy
Piracy has long been an issue in the movie industry. In the past, movie piracy mostly occurred in developing countries. This piracy usually takes the form of people purchasing counterfeit VHS/VCD/DVD through street vendors at lower monetary cost than the legal options.
With the advent of the Internet, piracy becomes a more severe concern in developed countries. Anyone with a computer and internet connection can now download pirated movie files from anywhere in the world. As internet download speeds increase, sharing a movie file becomes quicker. Today, sharing a movie file of, say, 2 GB in size takes only a matter of minutes. The ability to trade larger file sizes also means higher quality movie files can be traded more easily. This drastically reduces the cost of pirating a movie. As a result of these technological changes, movie piracy no longer occurs exclusively in developing countries but is rather a worldwide phenomenon, including in countries such as the U.S. and U.K. According to a 2011 report put out by Envisional, an Internet intelligence company, approximately 25% of all internet traffic in the world is related to P2P usage.4 Almost all of this traffic is used in sharing copyrighted
files. Envisional estimated that 11.5 million peers were sharing movie content through PublicBT tracker, the largest P2P tracker worldwide, in December 2010.
According to the Motion Picture Association, the major U.S. motion picture studios lost $6.1 billion in 2005 to piracy worldwide, with 62% of the losses coming from pirated goods like DVDs and 38% of the losses coming from Internet piracy. In the U.K. alone, the Motion Picture Association estimates that $406 million worth of revenue was lost due to movie piracy in 2005. This is the second highest number among international markets, only second to Mexico ($483 million). The potential for internet piracy continues to grow with technological advances in the computer industry and with rising internet penetration rates throughout the world.
4
3.3
Release Gap
Hollywood studios do not sit by idly in the face of piracy. Instead, many different strategies have been used to combat piracy, from public awareness campaigns and lobbying for government action to adaptation in the types of movies produced and how movies are distributed worldwide. The MPAA, for example, maintains a library of resources regarding its activities at its website, currentlyhttp://www.mpaa.org/contentprotection. A perusal of the MPAA’s efforts to com-bat piracy finds a public awareness campaign in New York City (http://stoppiracyinnyc.com) in which advertisements are placed in buses, taxis, theaters, and other locations alerting con-sumers to the costs of piracy. Aimed at college students, a group typically associated with piracy, the Higher Education Opportunity Act of 2008 requires U.S. educational institutions receiving federal student financial aid to develop plans for combating piracy on their campuses. Movies showing in theaters in the U.S. now appear with federal warnings threatening fines and impris-onment for customers engaged in piracy. The information efforts by the MPAA not only stress the illegality of piracy and the losses suffered by producers. The public awareness campaign in New York City, for example, urges consumers to “Get the Real Picture,” a slogan designed to emphasize the inferior quality of pirated goods. Indeed, emphasizing audiovisual quality may be a way in which Hollywood studios have adapted to the pressures from piracy. Action and adventure movies with lots of special effects, including 3D, provide a better experience when viewed in a theater. According to the MPAA, 3D movie screens have increased by 16 times worldwide since 2008.
To combat piracy in foreign countries, Hollywood studios can also shorten the gap between when a movie is released in the U.S. and a foreign market to preempt global piracy. Long gone are the days when global blockbusters like Star Wars: Episode IV - A New Hope (1977) appeared in markets like Hong Kong 8 months after its U.S. release: Iron Man 3 (2013) was released in Hong Kong 1 week before its U.S. release.5
To show shrinking release gaps are a general trend, we obtain release gap data from Boxof-ficemojo.com and IMDb.com for the top ten U.S. box office hits appearing in seven countries,
5
Table 1: Cross-Country Release Gap (Days) since the 1980s
Country 1980 1990 2000 2010 Argentina 131 77 48 11 Australia 169 69 31 13 Brazil 177 101 47 18 France 144 132 54 19 Germany 193 110 44 20 Hong Kong 168 149 43 20 Japan 178 183 71 80 Source: Boxofficemojo.com and IMDb.com
including Argentina, Australia, Brazil, France, Germany, Hong Kong, and Japan. These coun-tries are some of the major exporting councoun-tries of Hollywood blockbusters. Table 1 shows that the trend of declining movie release gaps has been clear. In 1980, the average release gap for Hollywood blockbusters was more than 4 months, ranging from 131 days (Argentina) to 193 days (Germany). But, the average release gaps have dropped approximately 90% in 2010. One thing to note is that the drop in release gaps started before the emergence of widespread Internet piracy. From 1990 to 2000, before BitTorrent technology, the release gaps had already dropped more than 50% across the seven countries.
4
Model of Strategic Choice of Release Gap
4.1
Discrete Choice Demand Model for Movies
We follow Einav (2007) to build a discrete choice model of demand for movies in countryk. For notational simplicity, we suppress the country subscript in the exposition of the demand model. We assume the utility of consumer i from going to moviej in week t is
uijt=θj −λ(t−rj) +τt+ξjt+ζit+ (1−σ)εijt, (1)
whereθj is a moviej fixed effect,rj is the release time of moviej,λis the movie decay parameter,
τtis a week fixed effect that captures seasonality,ξjtis an unobserved preference shock (assumed
the same for every consumer) for movie j in week t, and ζit+ (1−σ)εijt is an individual error
term.
an outside good (good 0). Utility from the outside good is
ui0t=ζ
′
it+ (1−σ)εi0t.
We follow Berry (1994) in the nested logit demand setting by assuming εijt (and εi0t) is
dis-tributed i.i.d. extreme value andζit (and ζit′) has a distribution that depends onσ ∈[0,1]. The
sum ζit+ (1−σ)εijt (and ζit′ + (1−σ)εi0t) is also distributed extreme value.
The parameter σ captures the market-expansion effect. It captures whether a new movie draws consumers from other movies or from people who would otherwise not go to movies at all. Whenσapproaches one, there is no substitution between the outside good and inside goods, and hence no market-expansion effect. When σ approaches zero, the model boils down to a simple logit model in which more observed seasonality can be attributed to variation in the number and quality of movies across the year.
The market share for movie j is
sjt =
expθj−λ(t−rj)+τt+ξjt
1−σ
Dσ t +Dt
, (2)
where
Dt=
X
j′∈Jt
exp
θ′
j−λ(t−rj) +τt+ξj′t
1−σ
(3)
and Jt is the set of all movies shown in theaters in week t. Rearranging equation (2) gives us
log(sjt)−log(s0t) = θj −λ(t−rj) +τt+σlog
sjt
1−s0t
+ξjt. (4)
The within-industry market share, sjt
1−s0t, is endogenous and requires an instrumental variable.
One candidate for the instrument is the number of movies shown in a given week. As Einav (2007) argues, the number of movies is negatively related to the within-industry share. The key assumption is that the instrument is not correlated with the error term, ξjt.
We separately estimate the relevant parameters, θj, λ, τt, σ, for each countries. We then take
λ andτt as exogenous and re-estimateθj in the release gap decision game, which we describe in
4.2
Release Gap Decision Game
We follow Einav (2010) to model the release gap decision game as a private information sequential game. Let the set of players in an international market k be i= 1,2, . . . , Nk. Then, the payoffs
for player i are given by
πi(rj, r−j;α, σ) = ˆπj(rj, r−j;α, σ) +ǫjrj
=
rj+H X
t=rj
ˆ
sjt(rj, r−j;α, σ) +ǫjrj
=
rj+H X
t=rj
exp((ˆθj(rj)−λ(t−rj) +τt)/(1−σ))
ˆ
Dσ t + ˆDt
+ǫjrj, (5)
where
ˆ
Dt=
X
l∈Jt(rj,r−j)
exp θˆl(rl)−λ(t−rl) +τt 1−σ
!
(6)
and ˆθl(rl) is a movie fixed effect which is a function of the time that the movie is released
(defined below in equation (7)). H is the total number of periods that distributors would take into account in making their release decision, which is guided by computational limitations.6
Jt(rj, r−j) is the set of movies showing in theaters during week t. The profit shock, ǫjrj, is
assumed to be an i.i.d. draw from a type I extreme value distribution and is assumed to be private information of distributor j.
In the profit function, we make use of the market share function in equation (2) with some modifications. First, we assume ξjt = 0 for any j and t. Second, we modify the movie fixed
effect, θj, with ˆθj(rj) to capture two effects: i) the negative effect of the release gap between
U.S. release and local release and ii) the positive effect of the word-of-mouth effect of the box office revenue of moviej in the U.S. market.
To capture the negative effect of the release gap, we would have to model that the movie fixed effect, ˆθj(rj), decreases with the release gap. We first define δ(rj) as the release gap if the
distributor decides to release movie j in countryk atrj. We let δ(¯rj) be the actual release date
observed in the data. We then assume the movie fixed effect, ˆθj(rj), decreases with (δ(rj)−δ(¯rj)).
6
To capture the word-of-mouth effect, we would have to model that the movie fixed effect, ˆ
θj(rj), increases with the box office revenue in the U.S. But, since we cannot assume a distributor
to perfectly foresee the U.S. box office revenue before its release in either the U.S. or foreign market, we replace the actual U.S. box office of movie j with expected U.S. market share of moviej using the movie demand estimates in the U.S. market. In particular, the expected U.S. market share of movie j released on rU S
j at week t is
κt=
exp((θU S
j −λU S(t−rjU S) +τtU S)/(1−σU S))
(DU S t )σ
U S
+DU S t
.
The cumulative U.S. market share of moviej at weektisPt s=rU S
j κs. We then assume the movie
fixed effect to increase with Prj
s=rU S j κs
The movie fixed effect is thus
ˆ
θj(rj) = θj−α(δ(rj)−δ(¯rj)) +βlog
Prj
s=rU S j κs P¯rj
s=rU S j κs
, (7)
where θj is the estimate of movie j’s fixed effect from the estimation of the discrete choice
demand model.
The second part of equation (7) captures the effect of the release gap on the movie’s fixed effect. We expect a longer release gap would reduce consumers’ interest in the movie, and, thus, we expect α >0. The last part of equation (7) captures the word-of-mouth effect of U.S. box office performance of the movie. If a movie performs well in the U.S. market, consumers’ interest in the movie in country k will also increase. We, thus, expect β >0.
Let us define Rj as the set of weeks in which distributor j can choose to release the movie.
Conditional on other distributors’ release choices, r−j, distributorj chooses to release the movie
onrj with the following probability:
Pr(rj|r−j) =
exp(ˆπj(rj, r−j;α, σ))
P
r′j∈Rjexp(ˆπj(r
′
j, r−j;α, σ))
. (8)
players, but not on their profit shocks, ǫ−j
r−j, each distributor’s strategy would only depend on
the actions chosen by distributors who moved previously.
We use pseudo-backward induction to solve the equilibrium. Let N be the total number of players, and the order of play specified as a permutation o ∈ PN, such that o(m) = j implies
that the mth player to move in the game is distributor j. Let prev(j) = {k :o−1(k) < o−1(j)}
be the set of distributors who decide their release dates before j. We solve the game backwards by solving the release date problem of the last distributor, o(N), conditional on the other distributors’ decisions. Using equation (8), distributor o(N) chooses to release on ro(N) with
probability
Pr(ro(N)|r−o(N)) =
exp(ˆπj(ro(N), r−o(N);α, σ))
P
r′o(N)∈Ro(N)exp(ˆπj(r
′
o(N), r−o(N);α, σ))
. (9)
We then make use of equation (9) to update the continuation values for other players. In particular,
ˆ
πN−1
j (r−o(N);α, σ) =
X
ro(N)∈Ro(N)
Pr(ro(N)|r−o(N))ˆπj(ro(N), r−o(N);α, σ)∀j ∈prev(o(N)) (10)
and
πN−1
j (r−o(N);α, σ) = ˆπNj −1(r−o(N);α, σ) +ǫjrj ∀j ∈prev(o(N)). (11)
The conditional release choice probability can then be updated using the continuation values specified in equation (10):
Pr(rj|rprev(j)) =
exp(ˆπjo−1(j)(rj|rprev(j)))
P
r′j∈Rjexp(ˆπ
o−1(j)
j (r′j|rprev(j)))
(12)
This procedure enables us to obtain an equilibrium with a positive probability over each possible outcome of the game. Given a pre-specified order o, the likelihood of a particular outcome r is
Pr(r|o) =
N
Y
j=1
Pr(rj|rprev(j),o). (13)
choose to release its movie (Rj) in each season.
We restrict the number of players in each season window to be 2 by choosing the top two U.S. movies in terms of their movie fixed effects (θj) in the U.S. market. In some cases, only one
of the two movies was released in a foreign country. The game would then be boiled down to a release gap decision of only the one player in the season, who only has to weigh between the release gap effect and word-of-mouth effect without considering the strategic interaction with another distributor.
As in Einav (2010), we choose four annual release seasons, all at around a dominant U.S. release date, to test our empirical model. The four seasons are President’s Day, Memorial Day, Fourth of July, and Thanksgiving. Each season includes the holiday week, 2 weeks before, and 8 weeks after, adding up to 11 weeks in total (that is, the number of weeks in Rj is always 11).
We, thus, have a total of 20 seasons of observation for each of the 17 countries on which the estimates are based.
5
Data
Our data sample consists of all movie titles showing in theaters in a given country in each weekend over the period 2008 to 2012. Naturally, for any given country and week, the total list of movies contains U.S. and non-U.S. titles. For each movie title in a given country and weekend, the data include the movie’s weekend box office revenue, box office revenue to date, release date in the U.S., box office revenue in the U.S., and other summary details. The sample contains movie data for 17 different countries, a list of which appears below in Table 2. The countries were chosen to create the largest possible set of countries with data available on a weekly basis for all years 2008 to 2012. Data on movies from publicly funded sources are limited and of low quality. Instead, we build our movie sample by collecting data from the private industry source Boxofficemojo.com.
the price from Numbeo.com constructs the remaining prices in 2010 and 2011. Each country’s population is taken from the World Bank’s World Development Indicators.
We follow Einav (2007) to restrict our attention to movies which reached a wide release at some point during the whole period that they are on screen. In particular, we only include movies which reached 5% of the total number of screens in the country during some week.7 We
also drop observations of limited release and define the actual release date to be the first week in which the number of screens is high enough.8
Because the box office data set only has weekend box office revenue and box office revenue to date, we use the following procedures to back out the weekly box office. First, for weeks that a movie appears in consecutive weeks in the data set, we use the difference between the cumulative box office revenue to the current week and the cumulative box office revenue to the previous week as the weekly box office revenue in the current week. Second, because there are some missing weeks in the data set, there are some weeks that we cannot use the difference of box office revenue to date to back out the weekly box office. Instead, we calculate the average ratio of weekend box office revenue and weekly box office revenue for each movie and then use the ratio to extrapolate the weekly box office for the weeks whose previous week’s data is missing.
We use the average ticket price, the weekly box office revenue, and the population in a country (which we take as the total market size in the country) to calculate the market share of movies in the country. We interpolate weekly ticket prices and weekly population from the annual ticket price schedule and annual population by assuming prices and population change linearly throughout the year. We then calculate weekly market shares for each movie by dividing weekly box office revenues by weekly ticket price and weekly population size.
5.1
Summary Statistics
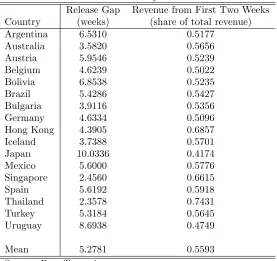
We present two summary statistics from our data in Table 2. The first column of Table 2 shows that release gaps across all countries in our sample are around 5 weeks. The release gaps display
7
Einav (2007) used a threshold of 600 screens, which is roughly 3-4% of the total number of screens in his data sample period.
8
huge variation across countries. Developed countries such as Japan can have an average release gap of 10 weeks, while developing countries such as Thailand can have a very short release gap of just above 2 weeks. We regressed the release gaps on Park (2008)’s patent protection index. An increase in the index by 1 (out of a maximum of 5, with a higher index indicating better protection) is associated with a 0.6 week increase in the release gap in the country. But, the R-square is only 0.03.
Table 2: Summary Statistics
Release Gap Revenue from First Two Weeks Country (weeks) (share of total revenue) Argentina 6.5310 0.5177
Australia 3.5820 0.5656 Austria 5.9546 0.5239 Belgium 4.6239 0.5022 Bolivia 6.8538 0.5235
Brazil 5.4286 0.5427
Bulgaria 3.9116 0.5356 Germany 4.6334 0.5096 Hong Kong 4.3905 0.6857 Iceland 3.7388 0.5701
Japan 10.0336 0.4174
Mexico 5.6000 0.5776
Singapore 2.4560 0.6615
Spain 5.6192 0.5918
Thailand 2.3578 0.7431
Turkey 5.3184 0.5645
Uruguay 8.6938 0.4749
Mean 5.2781 0.5593
Source: Boxofficemojo.com
6
Estimates
6.1
Movie Demand Estimates
[image:18.612.113.484.317.589.2]We first report the estimates from the discrete choice demand model for movies. Because the demand estimates, which are λ, τ, and σ, are not directly comparable across countries, we do not report them here. We instead calculate the mean decay elasticities (weighted by box office revenue) implied by the demand estimates for each country. We define decay elasticity as the percentage change of market share when the movie stays in the market for one more week. We then use the estimated decay elasticities to estimate the box office of first two weeks as a portion of total box office revenue, which can be compared with actual data.
Table 3: Estimated Decay of Box Office Revenue
Estimated Estimated Revenue Actual Revenue Decay Elasticity from First Two Weeks from First Two Weeks Country (share of total revenue) (share of total revenue)
Argentina -0.4481 0.6950 0.5177
Australia -0.3762 0.6178 0.5656
Austria -0.3809 0.6167 0.5239
Belgium -0.3527 0.5810 0.5022
Bolivia -0.3716 0.6050 0.5235
Brazil -0.4943 0.7113 0.5427
Bulgaria -0.3992 0.6383 0.5356
Germany -0.3959 0.6350 0.5096
Hong Kong -0.6812 0.8958 0.6857
Iceland -0.4344 0.6801 0.5701
Japan -0.3336 0.5559 0.4174
Mexico -0.3474 0.5740 0.5776
Singapore -0.7553 0.9401 0.6615
Spain -0.5275 0.7766 0.5918
Thailand -0.8550 0.9789 0.7431
Turkey -0.5022 0.7518 0.5645
Uruguay -0.3043 0.5159 0.4749
Mean -0.4682 0.6923 0.5593
-0.4.
Because movies decay fairly fast on average, most of the box office revenue of a movie comes from the first two weeks of its release. The second column of Table 3 reports our demand estimates imply almost 70% of box office revenue comes from the first two weeks of a movie’s release on average across the 17 countries in our data. While the estimated movie decays are consistently higher than the actual movie decays across countries (column 3), most of them are fairly close.
6.2
Release Gap Decision Game Estimates
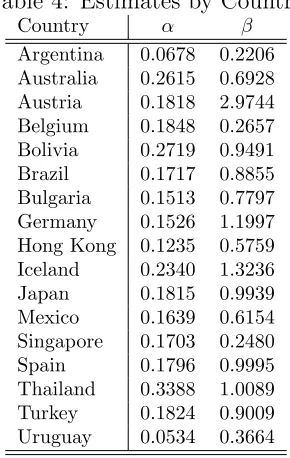
[image:19.612.224.369.404.633.2]Table 4 reports the estimates from the release gap decision game. All estimates have the expected sign. The estimates for the release gap effect, α, are positive in all countries, meaning that a longer release gap would lead to a decrease in the movie fixed effect. Also, the estimates for word-of-mouth effect, β, are also positive in all countries, meaning that a higher expected cumulative market share in the U.S. would lead to a higher movie fixed effect.
Table 4: Estimates by Country
Country α β
7
Counterfactuals
We conduct counterfactuals to evaluate i) the word-of-mouth effect and ii) the release gap effect on the release gap decision of movie distributors. From equation (7), the movie fixed effect of movie j released on week rj is
ˆ
θj(rj) = θj−α(δ(rj)−δ(¯rj)) +βlog
Prj
s=rU S j κs P¯rj
s=rU S j κs
,
where ¯rj is the actual release week of movie j in the data, δ(rj) is the release gap if movie is
released on week rj, and
Prj
s=rU S
j κs is the expected cumulative U.S. market share of movie j on
week rj.
7.1
Word-of-mouth Effect
We first conduct counterfactuals to evaluate the effect of word-of-mouth on the choices of release gap. In particular, we ask the question: how would a distributor’s decision about the release gap be different if the movie is always released in a foreign country after its release ends in the U.S. market? To answer that, we assume a distributor would expect to accumulate the maximum market shares in the U.S., and, thus, maximum word-of-mouth in the foreign country, at the beginning of the season it is released and rewrite the movie fixed effect of movie j released on week rj as
ˆ
θj(rj) = θj−α(δ(rj)−δ(¯rj)) +βlog
Prendj
s=rU S j κs P¯rj
s=rU S j κs
,
where rend
j is the end week of the season window in which movie j is released. Table 5 shows
release gaps would be shorter when the need to accumulate word-of-mouth disappears.
Table 5: Release Gap Shortened when Incentives for Word-of-Mouth Disappear
Two Blockbusters Two Blockbusters Overall One Blockbuster First Mover Second Mover Country Weeks Percentage Weeks Percentage Weeks Percentage Weeks Percentage Argentina -0.1124 -2.1416 -0.1571 -3.0145 -0.0844 -1.5842 -0.0599 -1.1276 Australia -0.2072 -4.2510 -0.2307 -4.4994 -0.1292 -2.8239 -0.2694 -5.5125 Austria -0.4572 -8.4023 -0.6273 -11.5240 -0.3321 -6.1522 -0.3878 -7.0849 Belgium -0.1759 -3.6679 -0.2312 -4.8045 -0.0659 -1.3193 -0.1475 -3.1748 Bolivia -0.3624 -7.2815 -0.3786 -7.6333 -0.3690 -7.2790 -0.2907 -5.8770 Brazil -0.4305 -8.5876 -0.5673 -11.1540 -0.2265 -4.5410 -0.2585 -5.5766 Bulgaria -0.3449 -6.6175 -0.4138 -7.9552 -0.1725 -3.3438 -0.3968 -7.5503 Germany -0.2643 -4.9046 -0.4539 -8.4272 -0.2023 -3.7501 -0.1603 -2.9769 Hong Kong -0.2569 -4.8831 -0.2746 -5.2657 -0.3367 -6.2336 -0.0974 -1.8111 Iceland -0.3028 -5.8987 -0.3538 -6.8999 -0.2928 -5.5956 -0.2313 -4.5999 Japan -0.2305 -4.5565 -0.2305 -4.5565 N.A. N.A. N.A. N.A. Mexico -0.3816 -7.5342 -0.4471 -8.8283 -0.2404 -4.7426 -0.4248 -8.3845 Singapore -0.0861 -1.6992 -0.0958 -1.8948 -0.0680 -1.3490 -0.0510 -0.9737 Spain -0.3282 -6.3449 -0.3980 -7.8973 -0.3176 -5.9717 -0.2790 -5.3874 Thailand -0.3637 -7.9272 -0.4328 -9.4924 -0.2844 -6.1593 -0.1320 -2.6513 Turkey -0.1968 -3.7559 -0.2628 -5.0656 -0.0689 -1.2815 -0.1764 -3.2833 Uruguay -0.1703 -3.2108 -0.1774 -3.3852 -0.1223 -2.3049 -0.2024 -3.7242
Mean -0.2748 -5.3920 -0.3372 -6.6058 -0.2071 -4.0270 -0.2223 -4.3560
17 countries when the incentive to accumulate word-of-mouth disappears.
Columns 3 and 4 report the drop in average release gap (in weeks and in percentage) for season windows with only one blockbuster. Columns 5 to 8 report the results for season windows with two blockbusters, with columns 5 and 6 reporting the release gap decreases for first movers and columns 7 and 8 reporting the release gap decreases for the second movers.
One thing to note is that the drop in release gap is higher in season windows with only one blockbuster. When the need to accumulate word-of-mouth disappears in these windows, the release gaps are, on average, 0.34 weeks (or 6.61%) shorter, while the release gaps would only drop by approximately 0.21 weeks (4.19%) in season windows with two blockbusters.
7.2
Release Gap Effect
To evaluate the release gap effect, we setδ(rj) = 0 for allrj and leave δ(¯rj) as it is. Essentially,
we assume a longer release gap has no effect on the movie fixed effect, ˆθj(rj). We then
fixed effect.
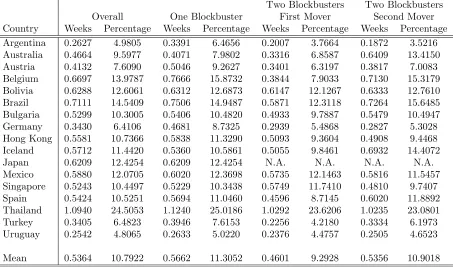
Table 6: Delays of Movie Release When Release Gap Has No Effect
Two Blockbusters Two Blockbusters Overall One Blockbuster First Mover Second Mover Country Weeks Percentage Weeks Percentage Weeks Percentage Weeks Percentage Argentina 0.2627 4.9805 0.3391 6.4656 0.2007 3.7664 0.1872 3.5216 Australia 0.4664 9.5977 0.4071 7.9802 0.3316 6.8587 0.6409 13.4150 Austria 0.4132 7.6090 0.5046 9.2627 0.3401 6.3197 0.3817 7.0083 Belgium 0.6697 13.9787 0.7666 15.8732 0.3844 7.9033 0.7130 15.3179 Bolivia 0.6288 12.6061 0.6312 12.6873 0.6147 12.1267 0.6333 12.7610 Brazil 0.7111 14.5409 0.7506 14.9487 0.5871 12.3118 0.7264 15.6485 Bulgaria 0.5299 10.3005 0.5406 10.4820 0.4933 9.7887 0.5479 10.4947 Germany 0.3430 6.4106 0.4681 8.7325 0.2939 5.4868 0.2827 5.3028 Hong Kong 0.5581 10.7366 0.5838 11.3290 0.5093 9.3604 0.4908 9.4468 Iceland 0.5712 11.4420 0.5360 10.5861 0.5055 9.8461 0.6932 14.4072 Japan 0.6209 12.4254 0.6209 12.4254 N.A. N.A. N.A. N.A. Mexico 0.5880 12.0705 0.6020 12.3698 0.5735 12.1463 0.5816 11.5457 Singapore 0.5243 10.4497 0.5229 10.3438 0.5749 11.7410 0.4810 9.7407 Spain 0.5424 10.5251 0.5694 11.0460 0.4596 8.7145 0.6020 11.8892 Thailand 1.0940 24.5053 1.1240 25.0186 1.0292 23.6206 1.0235 23.0801 Turkey 0.3405 6.4823 0.3946 7.6153 0.2256 4.2180 0.3334 6.1973 Uruguay 0.2542 4.8065 0.2633 5.0220 0.2376 4.4757 0.2505 4.6523
Mean 0.5364 10.7922 0.5662 11.3052 0.4601 9.2928 0.5356 10.9018
The first two columns of Table 6 report the overall increase in weeks and percentage of the release gaps across countries. When we include both the one-blockbuster and two-blockbusters season windows, the average release gap will increase by 0.54 weeks (10.79%) on average across the 17 countries when the release gap effect disappears. The magnitude of the increase in release gap does not appear to have a strong correlation with the countries’ piracy rates. While some countries with high piracy rates, such as Thailand and Brazil, have a bigger increase in average release gaps (24.51% and 14.54%, respectively), and countries with low piracy rates, such as Austria and Germany, have a smaller increase in average release gaps (7.61% and 6.41%, respectively), we also see countries with high piracy rates, such as Uruguay, that have a small increase in average release gaps (4.81%).
windows with only one blockbuster. The increase in release gap in one-blockbuster windows is approximately 0.57 weeks (11.31%), while the increase in release gap in two-blockbusters windows is approximately 0.50 weeks (10.10%) on average. Second, the impacts of the release gap effect are different between first movers and second movers in season windows with two blockbusters. In particular, first movers are less affected by the disappearance of release gap effects. In the absence of release gap effects, first movers (which are also the movies with higher movie fixed effects) would delay their releases in foreign countries by 0.46 weeks (or an increase in delay by 9.29%), while the second movers would delay their releases by 0.54 weeks (or an increase in delay by 10.90%).
8
Conclusion
Our paper sheds further light on the decision of Hollywood studios to enter foreign markets, which is a major source of U.S. exports in services. Our structural approach allows us to disentangle the role played by the release gap, word-of-mouth, and strategic effects on the release gap decision. Using international box office data from Boxofficemojo.com, we show all three factors are important.
References
Berry, S. T. (1994): “Estimating Discrete-Choice Models of Product Differentiation,” Rand Journal of Economics, 25(2), 242–262.
Bridgman, B.(2012): “Market Entry Costs: Evidence from Motion Picture Exports,” working
paper.
Danaher, B., M. D. Smith, and R. Telang (2014): “Piracy and Copyright Enforcement
Mechanisms,” in Innovation Policy and the Economy, Volume 14, ed. by J. Lerner, and
S. Stern. University of Chicago Press.
Danaher, B., and J. Waldfogel (2012): “Reel Piracy: The Effect of Online Film Piracy
on International Box Office Sales,” working paper.
Dellarocas, C., X. Zhang, and N. F. Awad (2007): “Exploring the Value of Online
Product Reviews in Forecasting Sales: The Case of Motion Pictures,”Journal of Interactive Marketing, 21(4), 23–45.
DeVany, A. S. (2004): Hollywood Economics: How Extreme Uncertainty Shapes the Film
Industry. New York, NY: Routledge.
DeVany, A. S., and W. D. Walls (2007): “Estimating the Effects of Movie Piracy on
Box-office Revenue,” Review of Industrial Organization, 30(4), 291–301.
Duan, W., B. Gu, and A. B. Whinston(2008): “Do Online Reviews Matter? An Empirical
Investigation of Panel Data,” Decision Support Systems, 45(4), 1007–1016.
Einav, L. (2007): “Seasonality in the U.S. Motion Picture Industry,” Rand Journal of Eco-nomics, 38(1), 127–145.
(2010): “Not All Rivals Look Alike: Estimating an Equilibrium Model of The Release Date Timing Game,”Economic Inquiry, 48(2), 369–390.
Elberse, A. (2007): “The Power of Stars: Do Star Actors Drive the Success of Movies?,”
Elberse, A., and J. Eliashberg (2003): “Demand and Supply Dynamics for Sequentially Released Products in International Markets: The Case of Motion Pictures,” Marketing Sci-ence, 22(3), 329–354.
Eliashberg, J., A. Elberse, and M. A. Leenders (2006): “The Motion Picture
Indus-try: Critical Issues in Practice, Current Research, and New Research Directions,” Marketing Science, 25(6), 638–661.
Eliashberg, J., S. K. Hui, and Z. J. Zhang (2007): “From Story Line to Box Office: A
New Approach for Green-Lighting Movie Scripts,”Management Science, 53(6), 1097–1110.
Ferreira, F., A. Petrin, and J. Waldfogel (2012): “Trade, Endogenous Quality, and
Welfare in Motion Pictures,” working paper.
Hanson, G. H., and C. Xiang (2008): “International Trade in Motion Picture Services,”
Working Paper.
(2011): “Trade Barriers and Trade Flows with Product Heterogeneity: An Application to US Motion Picture Exports,” Journal of International Economics, 83(1), 14–26.
Hummels, D., and P. J. Klenow (2005): “The Variety and Quality of a Nation’s Exports,”
American Economic Review, 95(3), 704–723.
Husak, W.(2004): “Economic and Other Considerations for Digital Cinema,” Signal Process-ing: Image Communication, 19, 921–936.
Kehoe, T. J., and K. J. Ruhl (2013): “How Important Is the New Goods Margin in
Inter-national Trade?,”Journal of Political Economy, 121(2), 358–392.
Krider, R. E., and C. B. Weinberg (1998): “Competitive Dynamics and the Introduction
of New Products: The Motion Picture Timing Game,”Journal of Markteting Research, 35(1), 1–15.
Ma, L., A. L. Montgomery, P. V. Singh, and M. D. Smith (2013): “An Empirical
Marvasti, A., and E. R. Canterbery (2005): “Cultural and Other Barriers to Motion Pictures Trade,”Economic Inquiry, 43(1), 39–54.
McCalman, P. (2005): “International Diffusion and Intellectual Property Rights: An Empir-ical Analysis,” Journal of International Economics, 67(2), 353–372.
Melitz, M. J. (2003): “The Impact of Trade on Intra-Industry Reallocations and Aggregate
Industry Productivity,” Econometrica, 71(6), 1695–1725.
Moul, C. C. (2007): “Measuring Word of Mouth’s Impact on Theatrical Movie Admissions,”
Journal of Economics & Management Strategy, 16(4), 859–892.
Park, W. G. (2008): “International Patent Protection: 1960-2005,” Research Policy.
Rennhoff, A., and K. Wilbur (2011): “The Effectiveness of Post-Release Movie
Advertis-ing,”International Journal of Advertising, 30(2), 305–328.
Rob, R., and J. Waldfogel (2007): “Piracy on the Silver Screen,” Journal of Industrial
Economics, 55(3), 379–395.
Zentner, A. (2010): “Measuring the Impact of File Sharing on the Movie Industry: An