Relationships between gait properties on soft
surfaces, physical function, and fall risk for the
elderly
Shinichi Demura1, Sohee Shin2, Shinji Takahashi3, Shunsuke Yamaji4*
1Graduate School of Natural Science and Technology, Kanazawa University, Kanazawa, Japan 2School of Medicine, Gifu University, Gifu, Japan
3Teikyo Heisei University, Chiba, Japan
4Faculty of Medical Sciences, Morphological and Physiological Sciences, Sports Medicine, University of Fukui, Fukui, Japan; *Corresponding Author: [email protected]
Received 5 December 2012; revised 20 January 2013; accepted 27 January 2013
Copyright © 2013 Shinichi Demura et al. This is an open access article distributed under the Creative Commons Attribution License, which permits unrestricted use, distribution, and reproduction in any medium, provided the original work is properly cited.
ABSTRACT
The plantar aspect change caused by contact with soft surfaces creates and unstable gait and increases the risk of falling, especially in the elderly. This study aimed to analyze gait prop- erty by three-dimensional motion analysis on soft and normal surfaces and to clarify the rela- tionship with physical function and fall risk. Twenty-four older people aged 65 - 88 years old and living independently without any assistive device (7 men, 17 women) performed 5 m of walking with own maximal speed on normal and soft surface walkways. The soft surface walkway used was a low rebound urethane foam mattress. The three-dimensional kinematic gait analysis by sixteen anatomic points was used to evaluate gait property on both walkways. The gait prop- erty on soft surfaces tended to be swinging up and down in each joint and to largely lean left and right as compared with the normal surface. Moreover, it tended to decrease in a step length and to increase in a step width. All gait parame- ters on soft surfaces correlated significantly with functional reach. On the other hand, that on normal surface correlated significantly with leg strength. Gait properties on soft surfaces which changes in plantar aspect during foot contact differs from those on normal surfaces. Walking on soft surfaces may cause an unanticipated inverted pendulum sway supporting a foot con- tact point because of the disturbance by a sag- ging walkway; in short, requiring more effort to keep a body balanced. In conclusion, gait on the
soft surfaces requires balance ability (functional reach) rather than leg strength.
Keywords:Three-Dimensional Kinematic Analysis; Leg Strength; Balance
1. INTRODUCTION
Prolongation of independent life for the elderly and control of the marked increased rate of medical expenses are key tasks in Japan, which has become a super aging society. Mobility is one of the most basic skills necessary to keep an independent daily life. Their falls bring about serious problems related to the decline of quality of life, such as the bedridden state caused by bone fractures, and the decline of activity range and volume due to the fear of falling. It was reported that more than one third of the elderly over 70 years of age living independently in com- munities experience a fall at least once a year, and their fall occur chiefly during walking or transfer movement [1].
A fall is the result of exceeding the limit of one’s own postural control from any cause. Age-related decline in the physical functioning of visual, locomotion, and ner- vous system makes stability during walking difficult. However, a fall during walking rarely occurs without some sort of trigger, except for those who fall due to dizziness or syncopy. Most falls involve a trigger such as a misstep or slip. The risk of falling increases when a person lacks the ability to adapt to surface environment changes (e.g. tilt, difference in floor height, slipperiness, and hardness change) [2-4].
Walking Test [5], Figure Eight Track Walking Test [6], Timed Up and Go Test [7], and Tandem Gait Test [8]. These tests are useful to evaluate the independence of daily living. However, mobility on stationary surfaces may not reflect the ability to avoid a fall, because the fall risk relates to the adaptability to variations in walking environments, as previously stated.
On the other hand, an obstacle walk test has been proposed as an irregular surface condition [9,10]. It is a useful test to evaluate avoiding a stumble that induces a fall. However, the participants can see the obstacles placed in test walkways before they begin to walk, and are therefore more likely to maintain stability.
There has been little research on the gait of elderly people on varied surfaces. Therefore, a soft surface, such as a mattress, is considered to be adequate for the gait analysis of elderly individuals because the change of plantar aspect when contacting the surface increases the risk of falling. When an elderly person walks on soft surfaces, the plantar aspect changes and they are required to control the sway of their body by using somatosensory input through plantar and postural reflexes. It is much more difficult for an individual to maintain their balance when walking on a softer surface compared to a normal walkway.
Considering a fall process, it will be important to ex- amine the body’s stability during walking in the above walkway condition. It was hypothesized that gait pro- perty on soft surfaces differs from that under normal con- ditions, and is related to different physical functions, adding that walking on soft surfaces reflects more the degree of fall risk and independence of daily living. If physical functions related to gait properties on both walkway conditions differ, it is necessary to review the exercise and physical functions to prevent falls.
This study aimed to analyze gait property by three- dimensional motion analysis on soft and normal surfaces and to clarify the relationship between physical function and fall risk.
2. METHODS
2.1. Participants
Seven older men (Age: 72.4 ± 5.2 years, Height: 162.6 ± 6.2 cm, Body mass: 65.7 ± 13.0 kg) and seventeen women (Age: 74.6 ± 7.5 years, Height: 148.9 ± 7.3 cm, Body mass: 52.2 ± 9.8 kg) living independently without any assistive devices in the community dwelling partici- pated in this study. There was no significant difference in the mean ages of the sexes (t(22) = 0.670, p = 0.510). Informed consent was obtained from each participant after a full explanation of the experimental project and its procedure. This study was approved by the Ethics Com- mittee on Human Experimentation of Faculty of Educa-
tion, Kanazawa University.
2.2. Experimental Device
For the three-dimensional kinematic gait analysis, si- xteen passive markers (15-mm diameter reflective, adhe- sive styrofoam) were attached bilaterally to the following anatomic landmarkers; acromion, olecranon, ulnar head, anterior iliac crest, greater trochanter, knee, ankle and fifth metatarsal. Marker trajectories were recorded two strides after one stride from onset of walking at 60 Hz by six digital camcorders (MA-2000, Anima, Japan). Tridi- mensional reconstruction of the marker trajectories was performed by means of a reference system (leveling wires with equally spaced markers, forming a cube 3.0 m in length, 1.70 m in height, and 1.30 m in width) in order to calibrate the experimental set.
Gait parameters were selected as follows: mean walk velocity, standard deviations of the movement distance of joint points (acromion, knee, and ankle) in the frontal and sagittal directions [11]. Further analysis was per- formed on only the right joint points because the move- ment distance between the right and left joints had a 0.95 correlation.
2.3. Procedure
Using within-subjects design, the participants perfor- med a 5-m walk at their own maximal speed on normal and soft surface walkways. The trial order on both walkway conditions was allocated randomly, and the rest among the trials was set 10 minutes. The participants walked on a low rebound urethane foam mattress (Blan- ce mattress, Achiless, Japan; width: 970 mm, depth: 603 mm, thickness: 80 mm) spread on the soft surface walk-way. The toughness of mattress was 75 N and the ratio of renaturation was 92%.
2.4. Falls Risk Assessment Score and Independent of Daily Living Score Fall risk was estimated using a fall risk assessment questionnaire [4-12]. This consisted of eight risk factors (gait deficit, balance deficit, muscle weakness, disease, medication use, environment, visual and hearing deficit, and fall fears: 15 items). Participants answered all ques-tions with a dichotomous scale (yes or no). The response with a high risk category for each question was consid-ered to be a “high-risk response”, and persons scoring over five points were judged to have a high fall risk.
test consisted of 12 items representing ADL domains of walking ability, changing and holding posture, balance, and muscular strength and dexterity (manual activity).
2.5. Tests of Leg Function
Tests of leg function were selected from leg strength and dynamic balance ability which related to mobility/ transfer movement and posture control ability: isometric muscle strength tests of toe flexion, knee extension, and hip flexion joints in the former, and a functional reach test in the latter. Isometric muscle strength tests were performed twice for both legs using a hand held dyna-mometer (μTAS F-1, ANIMA, JAPAN). A mean of a higher value in both legs was used as maximal strength in each joint. Plantar flexion was measured in long sit-ting position, and the others were measured in sitsit-ting position. Functional reach was measured by using an elastic stick [15]. Each participant maximally extended the dominant hand from an upright posture while touch-ing the top of an elastic stick fixed at dominant acromion height on the wall. They pushed and shortened the elastic stick by extending the dominant hand and the shortened distance of the elastic stick was measured.
2.6. Data Analysis
An unpaired t-test was used to reveal sex differences in the fall risk assessment score and independence of daily living score. Two-way ANOVA (sex × walkway condition) was use to reveal the difference of gait para- meters between both surface conditions. Pearson’s cor-relation coefficient was calculated to clarify the rela- tionships between gait parameters under both walkway conditions, fall risk score, independence of daily living score, and leg function. A probability level of 0.05 was indicative of statistical significance.
3. RESULTS
Table 1 shows sex differences of fall risk scores, in- dependence of daily living scores, and leg function. There were no significant sex differences in all parame- ters. All effect sizes by Cohen’s d were less than mode- rate values (d < 0.68).
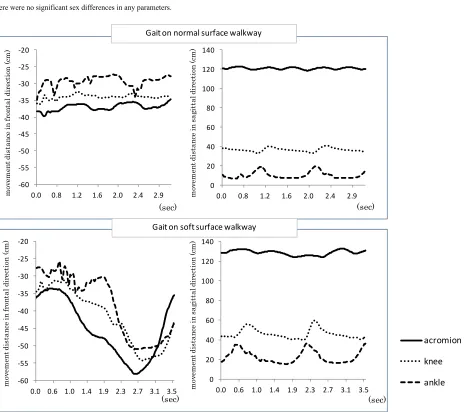
Figure 1 shows exemplification of the gait pattern
analyzed by joint point trajectories in the frontal and sa- gittal directions. The gait properties on a soft surface tended to swing up and down in each joint and to lean to the right and left directions significantly as compared with the normal surface. Moreover, it tended to decrease with a step length and to increase with step width.
Table 2 shows the result of two-way ANOVA (sex ×
walkway condition) regarding gait parameters. There were significant walkway condition effects in all para- meters. Walk velocity on soft surface significantly de-
creased, and body sway in the right-left and up-down directions significantly increased. Effect sizes between walkway conditions by sexes were over 0.5 in all pa- rameters. In particular, the effect of the magnitude of the standard deviation of movement distance in the sagittal direction was relatively high (1.2 - 5.2).
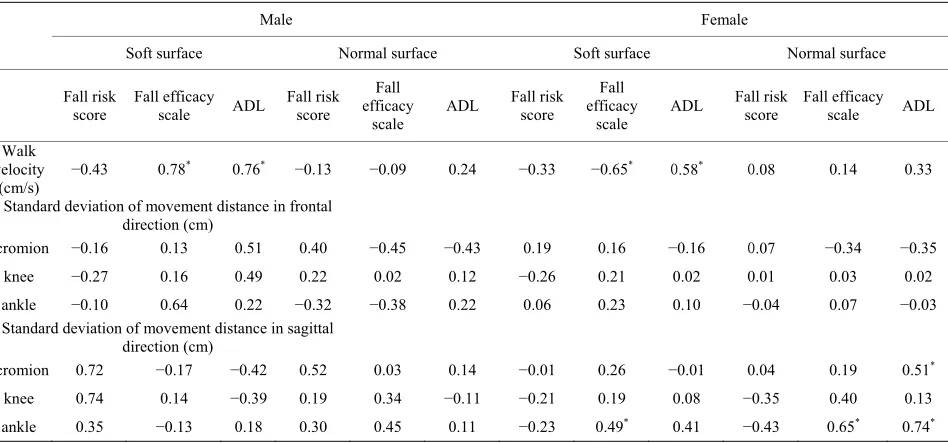
Table 3 shows the correlation coefficients among gait parameters, fall risk score, and independence of daily living score by sexes. Walk velocity on the soft surface correlated significantly with fall efficacy scale and ADL score in both sexes.
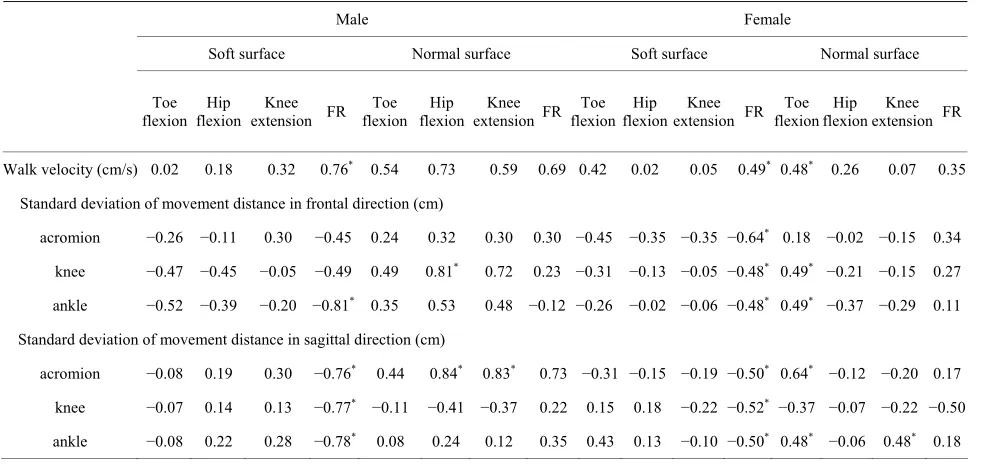
Table 4 shows the correlation coefficients between
gait parameters and leg functions by sexes. All gait pa-rameters, except for standard deviation of movement distance in frontal direction at acromion and knee in males, on soft surface correlated significantly with func-tional reach in both sexes. On the other hand, those on normal surfaces tended to correlate significantly with leg strength.
4. DISCUSSION
This study examined whether the gait properties and their relationship with the fall risk score and leg func- tions differ between those on the soft surface which changes the plantar aspect during foot contact and on the normal surface.
Takenaka and Uechi [16] reported that sex differences were not found in walking velocity and fall self-efficacy scale for people 61 - 91 years of age. In previous studies, the findings of sex difference on fall incidence were not always agreement. Some researchers reported that they were higher in women than in men [4,17,18], but others reported that there was no significant difference [19,20]. Physical fitness level varies among individuals because it does not only relate to sex and aging, but also relates to various factors such as chronic disease, physical activity and cognition function. There were no significant sex differences in age, fall risk score, independence of daily living score, and leg strength in this study. The effect sizes by Cohen’s d in fall risk and ADL score, and leg strengths were moderate (0.40 - 0.68), and the sex dif- ference in these parameters will be found in studies with a larger sample size.
Table 1. Sex differences of fall risk score, independence of daily living score, and leg muscle functions.
Male (n = 7) Female (n = 17)
M SD M SD t ES
Fall risk score point 3.9 2.6 2.9 2.2 0.9 0.40
Fall efficacy scale point 122.1 12.3 122.5 10.4 0.1 0.04
ADL score point 29.7 4.6 26.6 6.0 1.2 0.55
Toe flexion strength kg 5.6 3.0 4.1 2.0 1.5 0.68
Knee extension strength kg 17.0 7.3 14.1 3.7 1.3 0.57
Hip Flexion strength kg 23.1 11.3 19.1 6.4 1.1 0.50
Functional reach cm 32.3 6.6 32.2 5.6 0.0 0.00
There were no significant sex differences in any parameters.
0 20 40 60 80 100 120 140
0.0 0.8 1.2 1.6 2.0 2.4 2.9
mo ve me nt d ista nc e i n s ag itta ld ir ec tio n (c m ) (sec) ‐60 ‐55 ‐50 ‐45 ‐40 ‐35 ‐30 ‐25 ‐20
0.0 0.8 1.2 1.6 2.0 2.4 2.9
m ov em en t dis ta nc e in fr on ta l d ir ec tio n (c m ) (sec) ‐60 ‐55 ‐50 ‐45 ‐40 ‐35 ‐30 ‐25 ‐20
0.0 0.6 1.0 1.4 1.9 2.3 2.7 3.1 3.5
m ov em ent d is ta nce in fr on ta l d ire ct io n (c m ) (sec) 0 20 40 60 80 100 120 140
0.0 0.6 1.0 1.4 1.9 2.3 2.7 3.1 3.5
acromion knee ankle mo ve m en t d ista nc e i n sag it ta ld ir ec ti on (c m ) (sec) Gait on normal surface walkway Gait on soft surface walkway
Figure 1. Exemplification of gait pattern analyzed by movement distance of 8 joint points (only right side) on the both surface conditions. Upper panel: normal surface walkway, Lower panel: soft surface walkway.
to be small as compared with that at knee and ankle joints. It is inferred that walking on soft surface required
igher elevation of the foot during the swing phase. in the knee and ankle joints than in acromion. A sagging
[image:4.595.66.536.245.657.2]Table 2. Two-way ANOVA of gait parameters between the both walkway conditions by sexes.
Soft surface Normal surface Two-way ANOVA
Effect size between both
walkway conditions
Male Female Male Female sex condition walkway inter-action
M SD M SD M SD M SD F F F Male Female
Walk velocity
(cm/s)
67.3 18.1 72.0 19.6 93.5 17.8 90.4 38.5 0.0 11.0* 0.3 1.6 0.6
Standard deviation of movement distance in frontal direction (cm)
acromion 4.1 1.9 3.4 1.7 2.6 0.7 2.1 0.8 2.3 14.8* 1.3 1.1 1.0
knee 2.9 1.0 2.6 1.8 1.7 0.7 1.8 0.9 0.2 5.8* 0.2 1.5 0.6
ankle 3.9 1.3 2.9 2.0 2.1 0.7 2.1 1.0 1.1 7.8* 1.2 1.8 0.5
Standard deviation of movement distance in sagittal direction (cm)
acromion 1.9 0.5 1.7 0.7 1.3 0.4 1.0 0.2 1.7 14.7* 0.0 1.5 1.2
knee 3.3 0.5 3.4 0.7 1.4 0.2 1.3 0.3 1.0 337.1* 2.2 5.2 4.2
ankle 6.5 1.1 6.3 0.9 4.9 0.9 4.1 0.7 2.1 105.0* 1.8 1.8 2.8
[image:5.595.64.538.382.604.2]*p < 0.05.
Table 3. Correlation coefficients among gait parameters, fall risk score, and independence of daily living score.
Male Female
Soft surface Normal surface Soft surface Normal surface
Fall risk
score Fall efficacy scale ADL Fall risk score
Fall efficacy scale
ADL Fall risk score efficacy Fall scale
ADL Fall risk score Fall efficacy scale ADL
Walk velocity
(cm/s)
−0.43 0.78* 0.76* −0.13 −0.09 0.24 −0.33 −0.65* 0.58* 0.08 0.14 0.33
Standard deviation of movement distance in frontal direction (cm)
acromion −0.16 0.13 0.51 0.40 −0.45 −0.43 0.19 0.16 −0.16 0.07 −0.34 −0.35
knee −0.27 0.16 0.49 0.22 0.02 0.12 −0.26 0.21 0.02 0.01 0.03 0.02
ankle −0.10 0.64 0.22 −0.32 −0.38 0.22 0.06 0.23 0.10 −0.04 0.07 −0.03
Standard deviation of movement distance in sagittal direction (cm)
acromion 0.72 −0.17 −0.42 0.52 0.03 0.14 −0.01 0.26 −0.01 0.04 0.19 0.51*
knee 0.74 0.14 −0.39 0.19 0.34 −0.11 −0.21 0.19 0.08 −0.35 0.40 0.13
ankle 0.35 −0.13 0.18 0.30 0.45 0.11 −0.23 0.49* 0.41 −0.43 0.65* 0.74*
*p < 0.05.
Moreover, all correlations of gait parameters between both walkways were not high. Thus, walking properties on both walkways may be affected by different physical functions.
Significant correlations were not found between gait parameters and fall risk score. However, the indepen- dence score of daily living correlated significantly with walking velocity on a soft surface in both sexes and the sagittal direction sway of the ankle joint on a normal
Table 4. Correlation coefficients between gait parameters and leg muscle functions.
Male Female
Soft surface Normal surface Soft surface Normal surface
Toe flexion
Hip flexion
Knee extension FR
Toe flexion
Hip flexion
Knee extension FR
Toe flexion
Hip flexion
Knee extension FR
Toe flexion
Hip flexion
Knee extension FR
Walk velocity (cm/s) 0.02 0.18 0.32 0.76* 0.54 0.73 0.59 0.69 0.42 0.02 0.05 0.49* 0.48* 0.26 0.07 0.35
Standard deviation of movement distance in frontal direction (cm)
acromion −0.26 −0.11 0.30 −0.45 0.24 0.32 0.30 0.30 −0.45 −0.35 −0.35 −0.64* 0.18 −0.02 −0.15 0.34
knee −0.47 −0.45 −0.05 −0.49 0.49 0.81* 0.72 0.23 −0.31 −0.13 −0.05 −0.48* 0.49* −0.21 −0.15 0.27
ankle −0.52 −0.39 −0.20 −0.81* 0.35 0.53 0.48 −0.12 −0.26 −0.02 −0.06 −0.48* 0.49* −0.37 −0.29 0.11
Standard deviation of movement distance in sagittal direction (cm)
acromion −0.08 0.19 0.30 −0.76* 0.44 0.84* 0.83* 0.73 −0.31 −0.15 −0.19 −0.50* 0.64* −0.12 −0.20 0.17
knee −0.07 0.14 0.13 −0.77* −0.11 −0.41 −0.37 0.22 0.15 0.18 −0.22 −0.52* −0.37 −0.07 −0.22 −0.50
ankle −0.08 0.22 0.28 −0.78* 0.08 0.24 0.12 0.35 0.43 0.13 −0.10 −0.50* 0.48* −0.06 0.48* 0.18
*p < 0.05, FR: functional reach.
the independence score of daily living was composed of item groups related closely to physical function factors [16,21]. Hence, it may have shown relationships with gait parameters on both surfaces. However, it is noted that the gait parameters with significant correlations dif-fered between both walkway conditions. Potter et al. [21] reported that a relationship was found between Barthel ADL score and walking speed. However, this relation-ship depends largely on the physical fitness level of the older population. Because walking five meters on a nor-mal surface was an easy task for the elderly in this study, it is hard to attribute individual differences in gait by their physical fitness level. Therefore, it may have shown a poor relationship with the independence score of daily living.
Conversely, because walking on soft surface poses high difficulty, a significant relationship with walking velocity may have been found. Means [9] and Means and O’Sullivan [22] reported that walking at a high difficulty level such as navigating an obstacle is superior in the improvement ratio of physical function to walking nor-mally for older people living in community-dwelling. Therefore, walking on a soft surface walkway may be effective as exercise for fall prevention. In addition, those displaying greater ankle movements in the sagittal direction on a normal surface tended to have a higher independence score of daily living. Foot height during the swing phase decreases with age and physical function decline [23]. In this study, the ankle movement of the sagittal and frontal directions in the normal surface cor-related with toe flexion strength in females, thus it may important to improve toe flexion strength for the
inde-pendence of daily living. Moreover, gait parameters on the normal surface in females, as compared with that on the soft surface, correlated with leg strength. This sug-gests that the greater movement of joint points during normal walking is affected by leg strength. These results may mean that persons with superior leg strengths walk forcefully on a normal surface.
On the other hand, almost gait parameters on soft sur-faces correlated with a functional reach test in both sexes. This test was proposed to evaluate dynamic balance for older people [24]. As stated above, walking on a soft surface which prolonged the swing phase (the one-leg support phase) requires better balance ability. Walking on a low rebound urethane foam mattress makes it diffi-cult to kick the ground when beginning walking and to elevate a leg due to soft surface. In case of normal walk-ing, forcefully kicking the ground contributes to gain rapid and forceful movement. However, forcefully kick-ing the ground on the soft surface is needed large balance ability. Because the ankle movement in the sagittal di-rection on a soft surface correlated positively with func-tional reach, persons with superior funcfunc-tional reach may be able to elevate foot during swing phase. In fall pre-vention exercise schools, it is recommended to improve iliopsoas and femoral muscles to avoid stumbling over an obstacle [25,26]. However, it will also be important to propose exercise to positively move the center gravity of the body. Such exercises include the functional reach action which helps to keep body stable while walking on an irregular surface.
actions such as slips and missteps which require a step-ping strategy.
5. CONCLUSION
In conclusion, gait properties on soft surfaces which change the plantar aspect during foot contact differ from those on a normal surface. Body sway of the acromion in the frontal direction on a soft surface is larger than that of knee and ankle joints. Walking on a soft surface may cause an unanticipated inverted pendulum sway support-ing a foot contact point because of the disturbance by the sagging walkway. Gait on the soft surface requires bal-ance ability (functional reach) rather than leg strength.
REFERENCES
[1] Lord, S.R. and Dayhew, J. (2001) Visual risk factors for falls in older people. Journal of American Geriatrics So-ciety, 49, 508-515.
doi:10.1046/j.1532-5415.2001.49107.x
[2] Eke-Okoro, S.T. (2000) A critical point for the onset of falls in the elderly. A pilot study. Gerontology, 46, 88-92. doi:10.1159/000022140
[3] Ferrandez, A.M., Pailhous, J. and Durup, M. (1990) Slowness in elderly gait. Experimental Aging Research,
16, 79-89. doi:10.1080/07340669008251531
[4] Suzuki, T. (2003) Epidemiology and implications of fal-ling among the elderly. Nippon Ronen Igakkai Zasshi, 40, 85-94. doi:10.3143/geriatrics.40.85
[5] Van der Velde, N., Stricker, B.H., Pols, H.A. and van der Cammen, T.J. (2007) Withdrawal of fall-risk-increasing drugs in older persons: Effect on mobility test outcomes. Drugs and Aging, 24, 691-699.
doi:10.2165/00002512-200724080-00006
[6] Graham, R.C., Smith, N.M. and White, C.M. (2005) The reliability and validity of the physiological cost index in healthy subjects while walking on 2 different tracks. Ar-chives of Physical Medicine and Rehabilitation, 86, 2041- 2046. doi:10.1016/j.apmr.2005.04.022
[7] Podsiadlo, D. and Richardson, S. (1991) The timed “Up & Go”: A test of basic functional mobility for frail elderly persons. Journal of American Geriatrics Society, 39, 142- 148.
[8] Gill, J., Allum, J.H., Carpenter, M.G., Held-Ziolkowska, M., Adkin, A.L., Honegger, F. and Pierchala K. (2001) Trunk sway measures of postural stability during clinical balance tests: Effects of age. The Journals of Gerontology:
Series A, 56, M438-M447.
doi:10.1093/gerona/56.7.M438
[9] Means, K.M. (1996) The obstacle course: A tool for the assessment of functional balance and mobility in the eld-erly. Journal of Rehabilitation Research and Develop-ment, 33, 413-429.
[10] Rubenstein, L.Z., Josephson, K.R., Trueblood, P.R., Ye-ung, K. and Harker, J.O. (1997) The reliability and valid-ity of an obstacle course as a measure of gait and balance
in older adults. Aging, 9, 127-135.
[11] Kerrigan, D.C., Lee, L.W., Nieto, T.J., Markman, J.D., Collins, J.J. and Riley, P.O. (2000) Kinetic alterations in-dependent of walking speed in elderly fallers. Archives of
Physical Medicine and Rehabilitation, 81, 730-735.
doi:10.1016/S0003-9993(00)90101-1
[12] Suzuki, T. (2000) Questionnaire for falls assessment of elderly people and its application. Health Assessment Manual. Kosei Kagaku Kenkyusho, Tokyo, 142-163. [13] Hellstrom, K. and Lindmark, B. (1999) Fear of falling in
patients with stroke: A reliability study. Clinical Reha-bilitation, 13, 509-517.
doi:10.1191/026921599677784567
[14] Ministry of Education, Culture, Sports, Science and Tech- nology (1999) Guideline for new physical fitness test. http://www.mext.go.jp/a_menu/sports/stamina/03040901. htm
[15] Demura, S. and Yamada, T. (2007) Simple and easy ass- essment of falling risk in the elderly by functional reach test using elastic stick. Tohoku Journal of Experimental
Medicine, 213, 105-111. doi:10.1620/tjem.213.105
[16] Takenaka, K. and Uechi, H. (2002) Development of fal-ling self-efficacy scale for elderly people: The reliability and validity. Japan Journal of Physical Education, Hea- lth and Sport Sciences, 47, 1-13.
[17] Yasumura, S., Haga, H., Nagai, H., Shibata, H., Iwasaki, K., Ogawa, Y., Ahiko, T., Ihara, K. and Sakihara, S. (1994) Risk factors for falls among the elderly living in a Japa-nese rural community. Nippon Koshu Eisei Zasshi, 41, 528-537.
[18] Campbell, A.J., Spears, G.F. and Borrie, M.J. (1990) Ex-amination by logistic regression modelling of the vari-ables which increase the relative risk of elderly women falling compared to elderly men. Journal of Clinical Epi-demiology, 43, 1415-1420.
doi:10.1016/0895-4356(90)90110-B
[19] Yasumura, S., Haga, H., Nagai, H., Suzuki, T., Amano, H. and Shibata, H. (1994) Rate of falls and the correlates among elderly people living in an urban community in Japan. Age Aging, 23, 323-327.
doi:10.1093/ageing/23.4.323
[20] Yasumura, S., Haga, H., Nagai, H., Shibata, H., Iwasaki, K., Ogawa, Y., Ahiko, T. and Ihara, K. (1991) Incidence of and circumstances related to falls among the elderly in a Japanese community. Nippon Koshu Eisei Zasshi, 38, 735-742.
[21] Potter, J.M., Evans, A.L. and Duncan, G. (1995) Gait speed and activities of daily living function in geriatric patients. Archives of Physical Medicine and Rehabilita-tion, 76, 997-999. doi:10.1016/S0003-9993(95)81036-6 [22] Means, K.M. and O’Sullivan, P.S. (2000) Modifying a
functional obstacle course to test balance and mobility in the community. Journal of Rehabilitation Research and
Development, 37, 621-632.
[23] Shin, S. and Demura, S. (2011) Different step-over move- ment strategies for disturbance stimulations. Perceptual and Motor Skills, 113, 11-18.
doi:10.2466/25.26.PMS.113.4.11-18
Comparison of older adult performance during the func-tional-reach and limits-of-stability tests. Journal of Aging and Physical Activity, 13, 266-275.
[25] Hageman, P.A. and Thomas, V.S. (2002) Gait perform-ance in dementia: The effects of a 6-week resistperform-ance trai- ning program in an adult day-care setting. International Journal of Geriatric Psychiatry, 17, 329-334.
doi:10.1002/gps.597
[26] Jensen, J., Nyberg, L., Rosendahl, E., Gustafson, Y. and Lundin-Olsson, L. (2004) Effects of a fall prevention program including exercise on mobility and falls in frail older people living in residential care facilities. Aging