http://www.scirp.org/journal/ojas ISSN Online: 2161-7627
ISSN Print: 2161-7597
Feed Intake, Digestibility, Growth Performance
and Blood Profiles of Three Ethiopian Fat Tail
Hair Sheep Fed Hay Supplemented with Two
Levels of Concentrate Supplement
Shashie Ayele
1,2*, Mengistu Urge
2, Getachew Animut
3, Mohammed Yusuf
21Department of Animal Sciences, College of Agriculture and Natural Resources, Debre Markos University, Debremarkos, Ethiopia
2School of Animal and Range Sciences, College of Agriculture and Environmental Sciences, Haramaya University, Dire Dawa,
Ethiopia
3Agricultural Transformation Agency, Addis Ababab, Ethiopia
Abstract
An experiment arranged in 2 × 3 (2 concentrate supplement levels (CSL) and 3 breeds) factorial was carried out to evaluate the effect of CSL, breeds, and their interaction on feed intake, digestibility, feed utilization efficiency, and blood profiles of Ethiopian fat-tail hair sheep. The CSL were 1% and 1.75% body weight, designated as L1 and L2, respectively. The breeds used were yearling intact male Blackhead Ogaden (BHO), Horro and Washera. Sixteen sheep from each breed were divided into two based on initial body weight and randomly allocated to two dietary treatments for digestibility and growth tri-als of 10 and 90 days, respectively. Grass hay as a basal diet was offered ad li-bitum to each sheep. Feed intake every day and live body weight at interval of ten days were recorded for the duration of the experiment. Blood samples and linear body measurements were taken a week before the end and on the last day of the experiment from all sheep, respectively. Dry matter and nutrient intakes, except concentrate supplement and CP, were influenced by the inte-raction. The higher (p < 0.0001) DM digestibility was recorded from sheep supplemented with L2 than L1. Consequently, sheep supplemented with L2 had significantly higher (P < 0.05) feed conversion efficiency (FCE), average daily gain (ADG) (57.3 vs 44.2 kg), total gain (TG) (5.3 vs 3.9 kg) and final body weight (FBW) than those supplemented with L1. Among breeds, Horro sheep recorded higher (P < 0.05) DM intake, digestibility, and FCE than the rest of the breeds. Consequently, this breed has significantly (p < 0.05) higher TG, ADG, and FBW. Some of the blood hematology (PCV, MCV, neutrophils, and monocytes) and sera metabolites (total protein, urea, and cholesterol)
How to cite this paper: Ayele, S., Urge, M. Animut, G. and Yusuf, M. (2017) Feed Intake, Digestibility, Growth Performance and Blood Profiles of Three Ethiopian Fat Tail Hair Sheep Fed Hay Supplemented with Two Levels of Concentrate Supple-ment. Open Journal of Animal Sciences, 7, 149-167.
https://doi.org/10.4236/ojas.2017.72013
Received: February 28, 2017 Accepted: April 17, 2017 Published: April 20, 2017
Copyright © 2017 by authors and Scientific Research Publishing Inc. This work is licensed under the Creative Commons Attribution International License (CC BY 4.0).
values were influenced by the interaction in favor of L2. Hemoglobin concen-tration was higher for Washera than the other breeds (p < 0.05) but similar for the two CSL (P > 0.05). In conclusion, the study indicate the presence of vari-ation in nutrient intake and utilizvari-ation, performance traits, and blood profiles among breeds and between CSL, most of which were in favor of Horro breed and high level of concentrate.
Keywords
Blood Hematology, Linear Body Measurement, Serum Biochemistry, Sheep
1. Introduction
Sheep (Ovisaries) are found across all garo-ecologies and in nearly all produc-tion systems. They are suitable for extensive to highly mechanized producproduc-tion systems. Globally, sheep are the species with the highest number of recorded breeds, contributing 25% to the total mammalian breeds [1], and they are used for a variety of purposes. Sheep make a substantial contribution to the wellbeing of multitudes of people around the World by providing meat, milk, fibre, and skin. Like some other countries in the world, Ethiopia possesses genetically di-verse sheep [2] and it owns the second largest sheep population in Africa [3]. The sheep breeds of the country are widely adapted to different climates, ranging from sub-alpine to arid lowlands and are found in all production systems being entirely raised under traditional production system and characterized by low input-output [2][4].
In Ethiopia, sheep plays a crucial role in the national economy, but have low growth rate with average carcass weight not more than 10 kg/head [5] that li-mited the earning from the sector. The low productivity is attributed to inade-quate indigenous breed utilizations for production, poor nutrition, and poor genotype [4][6]. So far, a number of research works have been conducted to as-sess the effect of plane of nutrition on growth performance and carcass traits of a particular sheep breed [7][8][9]. However, considering the large sheep genetic resource base, comparative studies that show whether the performance of Ethio-pian fat tail hair sheep is differently influenced by genotype and level of supple-mentation are very limited.
genotypes.
In the present study, comparative performance of three sheep breeds, namely Black head Ogaden (BHO), Horro and Washera under feedlot condition was evaluated. Performance measures investigated include feed intake, digestibility, growth performance and blood profiles.
2. Materials and Methods
2.1. Experimental Site
The study was conducted during March to July 2015 at Haramaya University goat farm, located at 9˚25'N latitude and 42˚2'E longitude. The area lies at an al-titude of 1950 meters above sea level (m.a.s.l) and receives 790 mm total average annual rainfall of bimodal type. It has an average temperature of 16˚C with mean maximum and minimum annual temperatures of 24.02˚C and 9.73˚C, re-spectively [16].
2.2. Description of Sheep and Experimental Design
Three indigenous sheep breeds, BHO, Horro and Washera were used for the comparative study. Blackhead Ogaden breed has fat rump tail [2] and inhabits the arid low land part of the country and widely distributed within 42˚E - 48˚E longitudes and 3˚N - 9˚N latitudes [17]. The breed is well adapted to heat, feed and water shortage and has long distance tracking ability [18][19]. According to ESGPIP [20] BHO sheep is one of the most preferred sheep breed to Middle East export markets. Horro breed inhabits tepid to cool wet highlands in range of al-titude 1400 to 2000 m.a.s.l in North West Ethiopia between 35˚E and 38˚E lon-gitudes and 6˚N and 10˚N latitudes [17]. The breed is characterized by long fat-tail and large size and is the most prolific and best meat producing breed under good environment [18]. Washera breed is characterized by wide fat tail, large body size, long and thin legs and long neck [21]. The breed inhabits the moist highland part of the country in altitude range of 2000 to 3100 m.a.s.l in northern Ethiopia of West and East Gojam zones of the Amhara Region extend-ing to the south of Lake Tana.
Though the university has no established system for ethical approval of ani-mal experiments, all aniani-mal handling practices followed the international guid-ing principles listed by the Council for International Organizations of Medical Sciences and the International Council for Laboratory Animal Science [22].
sites, and sprayed with Diazinine (1 ml/liter of water) for ecto-parasites. At the end of the quarantine, each sheep was weighed and placed in an individual pen (134.8 × 78 cm) equipped with feed trough and water bucket. The sheep were acclimated to the experimental feeds and procedures for 15 days, which was fol-lowed by 10 days of digestibility and 90 days of growth trial in that order.
The experiment was conducted in a 2 × 3 (2 CSL and 3 breeds) factorial ar-rangement of treatment. The 16 sheep of a breed were divided into two based on their initial body weight and randomly allocated to the two levels of concentrate supplement. The two CSL were supplementation at 1% and 1.75% body weight of each sheep, designated as L1 and L2, respectively and was provided in two equal halves at 800 and 1600 hours. The amount of supplement offer was ad-justed every 10 days based on the body weight of the individual animal. The concentrate supplement comprised of wheat bran (44%), noug cake (29%), ma-ize grain (26%) and salt (1%) on DM basis. The supplement mix is set to max-imize the energy and protein content of the diet. Wheat bran is used as a cheap energy source and maize grain is included to maximize the energy content of the supplement. Dhakad et al. [23] reported lower ADG for growing lambs when wheat bran replaced cake at high level (75% wheat bran and 22% groundnut cake) and suggested a threshold level of 50% inclusion of wheat bran, a level that did not affect lamb growth adversely, on which the present proportion was based. Noug cake (29%) and maize grain (26%) is included to make metaboliza-ble energy content of 11.94 MJ/kg DM and 19.2% CP to ensure maximum growth with least cost. Clean water was available to animals all the time. The hand chopped natural pasture hay basal diet was provided ad libitum at 20% re-fusal rate. The hay offer was adjusted every week based on their intake. The hay was dominantly composed of grass genera such as Sporobolus, Digitaria and Eragrostis and very few herbaceous legumes.
2.3. Feed Intake and Digestibility
At the end of adaptation period, digestibility trial was conducted using all sheep. The lambs were adapted to carry fecal collection bags for three days, which was followed by 7 consecutive days of daily total fecal output collection for each an-imal. About 20% of the daily total fecal output was taken to form a composite sample for each animal. The sample was stored at −20˚C until it was thawed, thoroughly mixed and a sub sample of about 10% was taken and kept in a deep freezer until needed for analysis.
2.4. Body Weight and Linear Body Measures
The lambs were weighed at the commencement of the experiment and every 10 days thereafter. The final body weight (FBW) was taken the night before the lambs were slaughtered. All measurements were taken after overnight withdraw-al of feed and water. Totwithdraw-al gain (TG) was cwithdraw-alculated as the difference between FBW and initial body weight (IBW). Average daily gain (ADG) was determined by dividing differences of the FBW and IBW by the number of feeding days. Feed conversion efficiency (FCE) was calculated as a proportion of ADG to daily dry matter(DM) intake.
Feed conversion efficiency = Average daily gain g day
(
)
g Average daily dry matter intake
day
The metabolize energy MJ/day intake was estimated from digestible organic matter intake (DOMI) values by using the equation of AFRC [24] as ME (MJ/d) = 0.0157*DOMI g/kg DM.
At the end of the growth trial, linear body measurements such as heart girth (circumference around the chest just behind the front legs and withers), body length (the distance from base of tail to the base of the neck), height at withers (the distance from the surface of a platform on which the animal stands to the withers), pelvic width (distance between the two ends of the pelvis bone), neck circumference (circumference at base of neck), thigh circumference (circumfe-rence around the middle of the thigh) were taken from each sheep using mea-suring tape [25]. The measurements were taken in the morning before animals were offered feeds and water to reduce errors due to gut fill and at similar posi-tion when animals stand correctly.
2.5. Laboratory Analysis of Feeds, Feces, and Blood Profiles
Sub samples of feed offer, feces and refusals were dried at 60˚C for 72 hours and ground to pass 1 mm sieve screen and used for chemical analysis. Dry matter content was determined by drying the samples in an oven at 105˚C overnight while ash content was determined by burning the samples at 550˚C for 5 hours in a muffle furnace. Nitrogen (N) was determined by Kjeldahl method [26]. Neutral detergent fiber (NDF) and acid detergent fiber (ADF) were determined following the procedure described by Van Soest and Robertson [27].
(CHOD-PAP method) using the reagents developed for each parameter test and the instrument Huma analyzer 3000, Germany.
2.6. Statistical Analysis
Data were analyzed using the general linear model (PROC GLM) procedure of SAS [28]. Adjusted Tukey test (p < 0.05) was used to locate means that are sig-nificantly different. The statistical model used was: Yijkl = µ + Bi + Bj + Fk + (B × F)jk + Eijkl. Where; Yijkl = the response variable; µ = overall mean; Bi = effect of block; Bj = effect of breed; Fk = effect of CSL; (B × F)jk = interaction between breed and CSL, and Eijkl = random error. When the interaction effects were sig-nificant, the interaction least square means were presented and discussed. In the absence of interaction, least square means of the main effects were presented and discussed.
3. Results
3.1. Chemical Composition of the Experimental Feeds
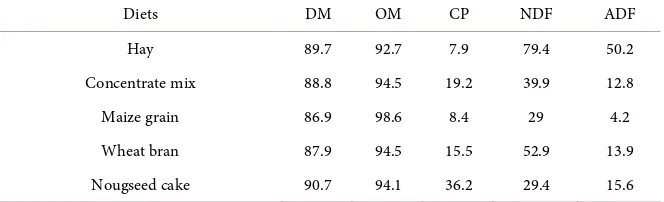
The hay contains a CP level that can satisfy the maintenance requirement of ru-minants, but high NDF and ADF content reflect late stage of maturity at harvest (Table 1). On the other hand, the concentrate mix and its ingredients had high CP, low level of NDF and ADF values with an estimated metabolizable energy content of 11.94 MJ/kg DM.
3.2. Dry Matter and Nutrient Intakes
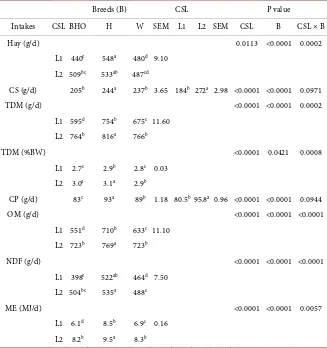
[image:6.595.208.540.597.698.2]There was significant (p < 0.001) breed by CSL interaction for hay, total DM, OM (P < 0.0001), NDF (P < 0.0001), and ME intakes (P < 0.01) (Table 2). Gen-erally there were differences in response to DM and nutrient intakes between groups consumed the two CSL, which appeared to be a possible reason for the interactions observed. Crude protein and concentrate intakes varied among ge-notypes and between CSL. Horro sheep consumed higher (p < 0.0001) amount of concentrate supplement than the other breeds. Crude protein intake ranked Horro > Washera > BHO (p < 0.0001). Crude protein and concentrate supple-ment consumption were greater at high (L2) than low level (L1) of supplesupple-ment.
Table 1. Chemical composition (% for DM and %DM for others) of the experimental diets.
Diets DM OM CP NDF ADF
Hay 89.7 92.7 7.9 79.4 50.2
Concentrate mix 88.8 94.5 19.2 39.9 12.8
Maize grain 86.9 98.6 8.4 29 4.2
Wheat bran 87.9 94.5 15.5 52.9 13.9
Nougseed cake 90.7 94.1 36.2 29.4 15.6
Table 2. Dry matter and nutrient intakes of three Ethiopian fat tail hair sheep breeds fed two concentrate supplement levels.
Breeds (B) CSL P value
Intakes CSL BHO H W SEM L1 L2 SEM CSL B CSL × B
Hay (g/d) 0.0113 <0.0001 0.0002
L1 440e 548a 480d
9.10
L2 509bc 533ab 487cd
CS (g/d) 205b 244a 237b
3.65 184b 272a
2.98 <0.0001 <0.0001 0.0971
TDM (g/d) <0.0001 <0.0001 0.0002
L1 595d 754b 675c
11.60
L2 764b 816a 766b
TDM (%BW) <0.0001 0.0421 0.0008
L1 2.7c 2.9b 2.8c
0.03
L2 3.0a 3.1a 2.9b
CP (g/d) 83c 93a 89b
1.18 80.5b 95.8a
0.96 <0.0001 <0.0001 0.0944
OM (g/d) <0.0001 <0.0001 <0.0001
L1 551d 710b 633c
11.10
L2 723b 769a 723b
NDF (g/d) <0.0001 <0.0001 <0.0001
L1 398e 522ab 464d
7.50
L2 504bc 535a 488c
ME (MJ/d) <0.0001 <0.0001 0.0057
L1 6.1d 8.5b 6.9c
0.16
L2 8.2b 9.5a 8.3b
a,b,cWithin genotype and CSL in the same row, means with different superscript letter differ significantly (p < 0.05); BHO = Blackhead Ogaden, H = Horro, W = Washera, L1 = hay + 1% of body weight CS, L2= hay + 1.75% of body weight CS, CS = concentrate supplement, CSL = concentrate supplement level, TDMI = total dry matter intake, ME = metabolizable energy, DM = dry matter, OM = organic matter, CP = crude pro-tein, NDF = neutral detergent fiber, SEM = standard error of mean.
3.3. Apparent Dry Matter and Nutrient Digestibility
Interaction was not significant for digestibility of DM and nutrients. But signifi-cant variation among breeds and between levels of concentrate supplement was apparent (Table 3). Horro sheep recorded significantly (p < 0.0001) higher di-gestibility of DM and nutrients than BHO and Washera, while BHO and Wa-shera had similar digestibility values. Digestibility values were significantly higher at L2 than L1 CSL.
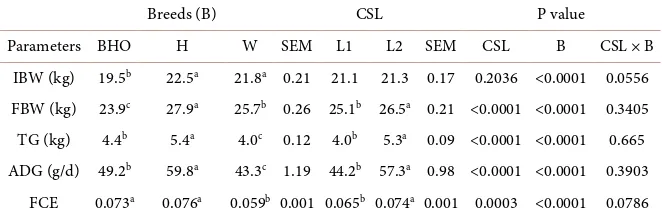
3.4. Body Weight and Feed Conversion Efficiency
Table 3. Dry matter and nutrient apparent digestibility of three Ethiopian fat tail hair sheep breeds fed two levels of concentrate supplement.
Digestibility % Breeds (B) CSL P value
BHO H W SEM L1 L2 SEM CSL B CSL × B
DM 69.1b 74.8a 67.9b
0.46 68.8b 72.4a
0.37 <0.0001 <0.0001 0.883 OM 71.9b 77.3a 71.0b
0.49 71.6b 75.1a
0.40 <0.0001 <0.0001 0.779 CP 79.9b 83.3a 78.8b
0.48 79.6b 81.7a
0.39 0.0009 <0.0001 0.084 NDF 67.6b 73.8a 65.6b
0.76 67.6b 70.4a
0.62 0.0028 <0.0001 0.209 ADF 58.4b 65.9a 56.8b
0.59 63.2b 65.5a
0.48 0.0022 <0.0001 0.292
a,bWithin genotype and CSL in the same row, means with different superscript letter differ significantly (p < 0.05); BHO = Blackhead Ogaden, H = Horro, W =Washera, L1 = hay + 1% of body weight CS, L2 = hay + 1.75% of body weight CS, CS = concentrate supplement, CSL = concentrate supplement level, DM = dry matter, OM = organic matter, CP = crude protein, NDF = neutral detergent fiber, ADF = acid detergent fi-ber, SEM = standard error of mean.
Table 4. Body weight and feed conversion efficiency of three Ethiopian fat tail hair sheep
breeds fed two levels of concentrate supplement.
Breeds (B) CSL P value
Parameters BHO H W SEM L1 L2 SEM CSL B CSL × B
IBW (kg) 19.5b 22.5a 21.8a
0.21 21.1 21.3 0.17 0.2036 <0.0001 0.0556 FBW (kg) 23.9c 27.9a 25.7b
0.26 25.1b 26.5a
0.21 <0.0001 <0.0001 0.3405 TG (kg) 4.4b 5.4a 4.0c
0.12 4.0b 5.3a
0.09 <0.0001 <0.0001 0.665 ADG (g/d) 49.2b 59.8a 43.3c
1.19 44.2b 57.3a
0.98 <0.0001 <0.0001 0.3903 FCE 0.073a 0.076a 0.059b
0.001 0.065b 0.074a
0.001 0.0003 <0.0001 0.0786
a,b,cWithin breed and CSL in the same row, means with different superscript letter differ significantly (p < 0.05). BHO = Blackhead Ogaden, H = Horro, W = Washera, L1 = hay + 1% of body weight CS, L2 = hay + 1.75% of body weight CS, CS = concentrate supplement, CSL = concentrate supplement level, IBW = initial body weight, FBW = final body weight, ADG = average daily gain, TG = total gain, FCE = feed conversion efficiency (g ADG/g DMI/d), SEM = standard error of mean.
performance and feed efficiency of all the breeds were better at high than low level of concentrate supplement.
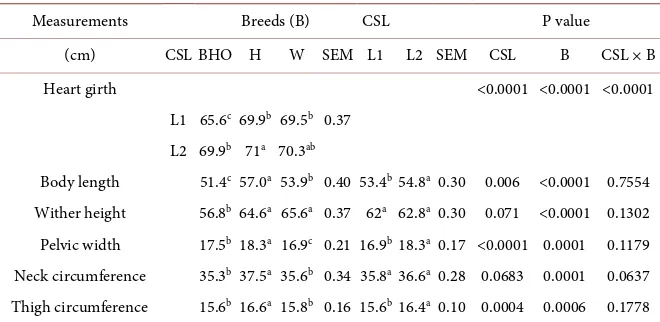
3.5. Linear Body Measures
[image:8.595.208.539.313.422.2]Table 5. Linear body measurements of three Ethiopian fat tail hair sheep breeds fed two levels of concentrate supplement.
Measurements Breeds (B) CSL P value
(cm) CSL BHO H W SEM L1 L2 SEM CSL B CSL × B
Heart girth <0.0001 <0.0001 <0.0001
L1 65.6c 69.9b 69.5b
0.37
L2 69.9b 71a 70.3ab
Body length 51.4c 57.0a 53.9b 0.40 53.4b 54.8a
0.30 0.006 <0.0001 0.7554 Wither height 56.8b 64.6a 65.6a 0.37 62a 62.8a
0.30 0.071 <0.0001 0.1302 Pelvic width 17.5b 18.3a 16.9c 0.21 16.9b 18.3a
0.17 <0.0001 0.0001 0.1179 Neck circumference 35.3b 37.5a 35.6b 0.34 35.8a 36.6a
0.28 0.0683 0.0001 0.0637 Thigh circumference 15.6b 16.6a 15.8b 0.16 15.6b 16.4a
0.10 0.0004 0.0006 0.1778
a,b,cWithin breed and CSL in the same row, means with different superscript letter differ significantly (p < 0.05); BHO = Blackhead Ogaden, H = Horro, W = Washera, L1 = hay + 1% of body weight CS, CS = con-centrate supplement, CSL = concon-centrate supplement level, L2 = hay + 1.75% of body weight CS, SEM = standard error of mean.
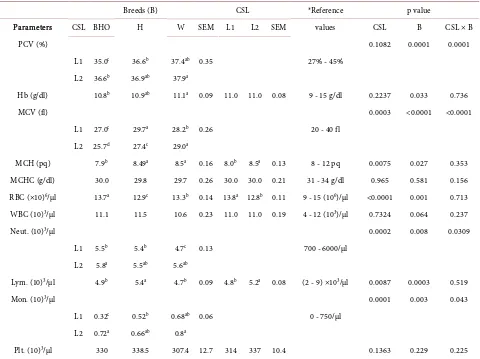
3.6. Blood Hematology
There was an interaction effect between breed and CSL for PCV, MCV, neutro-phils, and monocytes (Table 6). The interaction for PCV may be due to the low value recorded for BHO at the low level of concentrate supplement as compared to the other values. The MCV (PCV/RBC) increased for Washera, but decreased for Horro and BHO at high level of supplementation (P < 0.001) which is an attribute of higher PCV for Washera and RBC for BHO. Neutrophils for BHO and Washera increased significantly with level of supplement, but was similar for Horro sheep. Monocyte was significantly higher at higher than low level of supplement for only BHO. Washera breed has showed higher hemoglobin con-centration than BHO sheep. BHO has lower, while Horro and Washera recorded higher MCH (P < 0.05). The BHO sheep recorded the highest RBC, Washera in-termediate, and Horro the smallest (P < 0.01). Horro sheep has more lympho-cytes than BHO and Washera sheep. Mean corpuscular hemoglobin concentra-tion, WBC, and platelet were not influenced (P > 0.05) by both factors. Sheep consumed L1 concentrate supplement had significantly (p < 0.0001) higher RBC than L2 group. Significantly (P < 0.01) higher MCH and lymphocyte values were observed at L2 than L1 CSL.
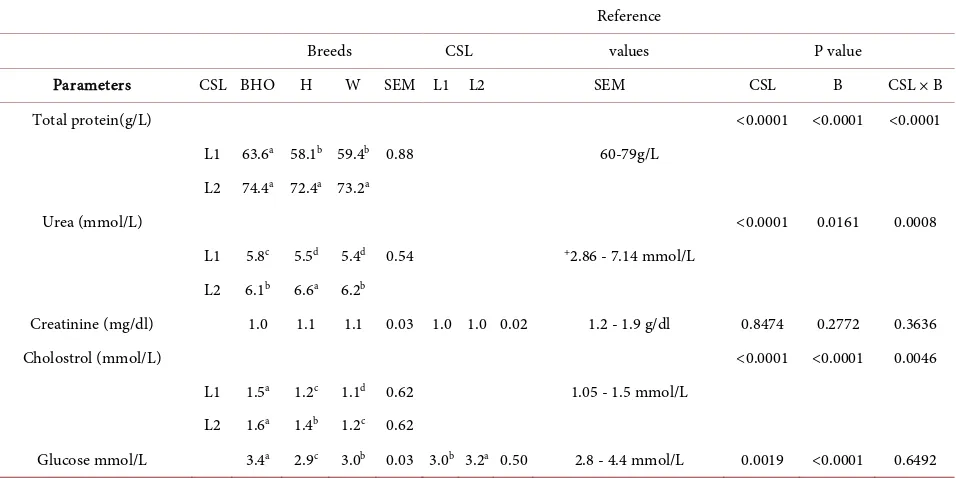
3.7. Serum Biochemistry
Table 6. Blood hematology of three Ethiopian fat tail hair sheep breeds fed two levels of concentrate supplement.
Breeds (B) CSL *Reference p value
Parameters CSL BHO H W SEM L1 L2 SEM values CSL B CSL × B
PCV (%) 0.1082 0.0001 0.0001
L1 35.0c 36.6b 37.4ab
0.35 27% - 45%
L2 36.6b 36.9ab 37.9a
Hb (g/dl) 10.8b 10.9ab 11.1a
0.09 11.0 11.0 0.08 9 - 15 g/dl 0.2237 0.033 0.736
MCV (fl) 0.0003 <0.0001 <0.0001
L1 27.0c 29.7a 28.2b
0.26 20 - 40 fl
L2 25.7d 27.4c 29.0a
MCH (pq) 7.9b 8.49a 8.5a
0.16 8.0b 8.5a 0.13 8 - 12 pq 0.0075 0.027 0.353 MCHC (g/dl) 30.0 29.8 29.7 0.26 30.0 30.0 0.21 31 - 34 g/dl 0.965 0.581 0.156 RBC (×10)6/µl 13.7a 12.9c 13.3b
0.14 13.8a 12.8b 0.11 9 - 15 (106)/µl <0.0001 0.001 0.713 WBC (10)3/µl 11.1 11.5
10.6 0.23 11.0 11.0 0.19 4 - 12 (103)/µl 0.7324 0.064 0.237 Neut. (10)3/µl
0.0002 0.008 0.0309
L1 5.5b 5.4b 4.7c
0.13 700 - 6000/µl
L2 5.8a 5.5ab 5.6ab
Lym. (10)3/µl 4.9b 5.4a 4.7b
0.09 4.8b 5.2a 0.08 (2 - 9) ×103/µl 0.0087 0.0003 0.519 Mon. (10)3/µl
0.0001 0.003 0.043
L1 0.32c 0.52b 0.68ab
0.06 0 - 750/µl
L2 0.72a 0.66ab 0.8a
Plt. (10)3/µl 330 338.5
307.4 12.7 314 337 10.4 0.1363 0.229 0.225
a,b,cWithin genotype and CSL in the same row, means with different superscript letter differ significantly (p < 0.05), BHO = Blackhead Ogaden, H = Horro, W = Washera, L1 = hay + 1% of body weight CS, L2 = hay + 1.75% of body weight CS, CS = concentrate supplement, CSL = concentrate supplement level, SEM = standard error of mean, fL, femtoliter, mg/dL = mile gram per deciliter, µl = micro liter, Hgb = hemoglobin, MCV = mean corpuscular volume, MCH = mean corpuscular hemoglobin, MCHC = mean corpuscular hemoglobin concentration, PCV = packed cell volume, RBC = red blood cells, WBC = white blood cells, Neutr = Neutrophils, Lym = lymphocytes, Mon = Monocytes, Plt. = platelets. *Reference value [29].
4. Discussion
4.1. Feed Intake and Digestibility
Table 7. Some serum biochemistry of three Ethiopian fat tail hair sheep breeds fed two levels of concentrate supplement.
Reference
Breeds CSL values P value
Parameters CSL BHO H W SEM L1 L2 SEM CSL B CSL × B
Total protein(g/L) <0.0001 <0.0001 <0.0001
L1 63.6a 58.1b 59.4b
0.88 60-79g/L
L2 74.4a 72.4a 73.2a
Urea (mmol/L) <0.0001 0.0161 0.0008
L1 5.8c 5.5d 5.4d
0.54 +2.86 - 7.14 mmol/L L2 6.1b 6.6a 6.2b
Creatinine (mg/dl) 1.0 1.1 1.1 0.03 1.0 1.0 0.02 1.2 - 1.9 g/dl 0.8474 0.2772 0.3636
Cholostrol (mmol/L) <0.0001 <0.0001 0.0046
L1 1.5a 1.2c 1.1d
0.62 1.05 - 1.5 mmol/L L2 1.6a 1.4b 1.2c
0.62 Glucose mmol/L 3.4a 2.9c 3.0b
0.03 3.0b 3.2a 0.50 2.8 - 4.4 mmol/L 0.0019 <0.0001 0.6492
a,b,cWithin genotype and CSL in the same row, means with different superscript letter differ significantly (p < 0.05); BHO = Blackhead Ogaden, H = Horro, W = Washera, L1 = hay + 1% of body weight CS, L2 = hay + 1.75% of body weight CS, CS = concentrate supplement, CSL = concentrate supplement level; SEM = standard error of mean, mg/dL = mile gram per deciliter, mmol/L = mile mole per liter, Reference values [29][30].
at 1.5% than 1% of body weight of concentrate supplement in a trial comparing three goat breeds. Significant breed effect on total DM intake is also reported by Tsegay et al. [38]. The review work of Pulina et al. [39] showed that voluntary feed intake in sheep is transmitted from parent to offspring with h2 value of 0.11
to 0.66.
Higher nutrient digestion and better FCE by Horro breed may be due to higher CP and ME intake than BHO and Washera breeds. Likewise, L2 concen-trate supplement provides higher CP and ME thus, higher digestibility and FCE was recorded in lambs supplemented by the higher level of concentrate supple-ment. As stated by McDonald et al.[40] supplementation of poor quality forage with good protein feed has increased the availability of nitrogen in the rumen, thereby improving the rate of degradation and utilization of the feed.
4.2. Growth Performance
mi-crobial population growth and therefore promote digestion making nutrient available to increase weight gain in sheep supplemented with high level of con-centrate. These findings are in agreement with that reported by Tsegay et al.[38]
who observed higher ADG for the sheep supplemented with 350 g/d concentrate than those supplemented with 150 g/d. Dereje et al. [37] also obtained higher ADG in goats supplemented with 1.5% body weight concentrate than those consumed at 1% body weight.
The difference in linear body measurements of sheep in the present study re-flects morphological variation among breeds. The fact that Horro breed has higher value of hearth girth (HG), body length (BL), pelvic width (PW), thigh circumference (TC) and neck circumference (NC) indicate the breed is of large frame with a potential of gaining more body weight. As reported by Oke and Ogbonnaya [44] BL, wither height (WH), HG and NC have strong correlation with body weight in three age (0 - 12, 13 - 24, and >25 months) categories stu-died in Wad sheep. Vargas et al. [45] also indicated that HG, WH and BL are closely related to weight of an animal. On the other hand, Washera sheep has the highest WH since this breed has long and thin legs, and long neck as compared the other sheep breeds of Ethiopia [2][21]. The difference in linear body mea-surements between supplement groups may be largely attributed to the higher CP and ME intake that enhanced skeletal growth.
4.3. Blood Hematology
All blood hematology and serum biochemistry values obtained for all breeds in the present study were within the normal reference range reported by Radostits
et al.[29] and Kaneko et al.[30]. The marked increase in PCV in BHO at high level of concentrate supplement is attributable to the variation in the number of RBC or circulating plasma volume [46]. Variability in PCV among breeds was reported by various researchers in sheep [47][48] and in goat [49]. The lack of effect between CSL on PCV in the present study is in line with that reported by Okah et al.[50] for west African Dwarf sheep supplemented with different levels of poultry droppings (10%, and 20%). Lack of difference for Hgb concentration between supplement levels is in agreement with other study conducted using Santa Inês lambs fed various mixture of physic nut meal with soybean meal and ground corn [51]. Increased level of Hgb concentration is attributed to ability to tolerate infection and good nutritional status as well as breed of animals [47] [48][49].
supply, the higher RBC obtained at L1 concentrate supplement is unexplained. The MCV, MCH, and MCHC values coupled with PCV and Hgb are very important in the diagnosis of anemia and also serve as a useful index of the ca-pacity of the bone marrow to produce red blood cells in animals [46]. Previous findings noted that these parameters are dependent on genotype, sex, age, season
[47][49] and feed [52]. The lower MCV for BHO at both level of supplementa-tion compared to Horro and Washera was due to higher RBC while higher MCH in the Horro and Washera breeds compared to BHO was attributed to the higher Hgb and lower RBC record.
The numerical difference in WBC count among sheep breeds may reflect the existence of variations in degree of disease resistance and variation in adaptabil-ity to local environmental and disease prevalence conditions [53]. Among the sheep breeds compared in the present study, Horro breed had numerically high-er WBC count than Washhigh-era sheep. Tibbo [4] noted Horro sheep express their growth potential regardless of exposure to the climatic stressors and health chal-lenges such as cold and pneumonia than the Menz sheep breed in the environ-ment native to Menz sheep. This may indicate the superiority of the breed to to-lerate diseases and to adapt to the environment to which they are exposed. In the present study, WBC differentials were significantly affected by breed, CSL, and some interaction. The effects of genotype on these parameters are in agreement with that noted by Tibbo et al.[51] and Njidda et al. [47]. The finding that diet has no substantial effects on blood platelets concord with Oliveira et al. [51] who observed similar result for Santa Inês lambs fed various mixture of physic nut meal with soya bean meal and ground corn. Lack of significant difference among genotypes on platelets contradicts with those of Jawasreh et al. [54] who ob-tained significant breed effect for platelets on different genetic lines of Awassi ewes. It is known that blood platelets are implicated in blood clotting. Low platelet concentration suggests that the process of formation (blood clot-ting) will be prolonged resulting in excessive loss of blood in case of injury.
4.4. Serum Biochemistry
The observed total protein values in the present study are slightly lower than the values (64 to 83 g/L) reported by Njidda et al. [47] for the three breeds of Nige-rian sheep. The observation that higher level of concentrate supplemented group has higher total protein than the low level group could be attributed to higher protein intake from the higher level concentrate supplement. In agreement to this study, Hoffman et al. [55] found more serum total protein and albumin but similar albumin to globulin ratio for Holstein heifers fed a diet having 15% CP than 8% CP. Contrary to this finding, Okah et al.[50] obtained similar serum total protein concentration irrespective of dietary levels.
breeds, which is in accordance with the crude protein intake. Lack of significant dietary effect on creatinine concentration is contrary to those of Shaker et al.
[56] and Tope et al.[52]. On the other hand, lack of breed effect on this parame-ter disagrees with the report of Njidda et al.[47] but concurs with result of Ja-wasreh et al.[54]. The observed Cholesterol values in the present study are simi-lar to 1.05 to 1.5 mmol/L documented as normal value for sheep [29] but lower than 1.8 to 2.5 mmol/L reported for yearling Northern Nigeria sheep breeds
[47]. In addition, significant breed effect on cholesterol level was also observed in the work of Jawasreh et al. [54]. On the other hand, similar to these findings, significant dietary effects on cholesterol levels have been reported by Tope et al.
[52] and Shaker et al. [56].
The reason for variation in glucose concentration among genotypes in the present study is the greater difference in dietary energy intake and due to varia-tion in growing ability. Likewise, the higher glucose recorded from L2 sheep than from L1 sheep could be due to the higher dietary energy intake. Similar to the present study, Catunda et al. [57] found higher glucose concentration in supplemented hair sheep than un supplemented ones.
5. Conclusion
The study show that genotypes and levels of concentrate supplement influenced feed intake, growth rate, and blood profiles of the selected fat tail hair sheep breeds of Ethiopia. Concentrate supplement feeding at the rate of 1.75% than 1% body weight improved rate of digestion, dry matter intake, efficient utilization of the feed, linear body measurements and daily gain. Among breeds evaluated, Horro sheep has better dry matter intake, nutrient digestion, feed efficiency, and growth ability. This indicates the potential of the breed for meat production. Blood profile results showed variation among breeds and were highly sensitive to genotype by CSL interaction implicating that such factors need to be critically considered in the establishment of reference ranges of blood profile for Ethiopia sheep breeds. In general, the study indicated presence of variation among Ethio-pian sheep breeds in growth ability and high concentrate supplement is needed to express their genetic potential.
Acknowledgements
The first author would like to thank Haramaya University for providing the fi-nancial and research facilities and Debremarkos University for providing study leave and paying salary.
References
[1] FAO (2000) Food and Agriculture Organization. World Watch List for Domestic
Animal Diversity. 3rd Edition, Rome.
[2] Solomon, G., Van Arendonk Johan, A.M., Komen, H., Windig, J.J. and Hanotte, O.
https://doi.org/10.1111/j.1365-2052.2007.01659.x
[3] FAO (2013)Food and Agriculture Organization. World Statistical Compendium for
Raw Hides And Skins, Leather and Leather Footwear 1993-2012. Trade and Markets Division Food and Agriculture Organization of the United Nations.
[4] Tibbo, M. (2006) Productivity and Health of Indigenous Sheep Breeds and
Cros-sbreds in the Central Ethiopian Highlands. PhD Dissertation, Swedish University of Agricultural Sciences, Uppsala, Sweden.
[5] FAO (1996) Food and Agriculture Organization. Improving Food Security, the
Ig-nored Contribution of Livestock. FAO Yearbook, Production 1995, Vol. 49.
[6] Aschalew, T. (2006) Assessment of Feeding Systems and Evaluation of Feed
Sup-plementation on Body Weight and Fleece Production of Sheep in Ethiopia. PhD Dissertation, Kasetsart University, Thailand.
[7] Fentie, B. and Solomon, M. (2008) Effects of Supplementation of Farta Sheep Fed
Hay with Sole or Mixtures of Noug Seed Meal and Wheat Bran on Feed Intake,
Di-gestibility and Body Weight Change. Tropical Animal Health and Production, 40,
597-606. https://doi.org/10.1007/s11250-008-9138-1
[8] Likawent, Y., Claudia, K., Firew, T. and Kurt, J.P. (2012) Sweet Blue Lupin (Lupinus
angustifolius L.) Seed as a Substitute for Concentrate Mix Supplement in the Diets of Yearling Washera Rams Fed on Natural Pasture Hay as Basal Diet in Ethiopia.
Tropical Animal Health and Production, 44, 1255-1261.
https://doi.org/10.1007/s11250-011-0066-0
[9] Birhanu, T., Getachew, A. and Mengistu, U. (2013) Effect of Green Prosopis
juliflo-ra Abissynica Cake Supplementation on Digestibility and Performance of Blackhead
Ogaden Sheep Fed Hay as a Basal Diet. Science, Technology and Arts Research
Journal, 2, 38-47.
[10] Oddy, V.H. and Sainz, R.D. (2002) Nutrition for Sheep-Meat Production. In: Freer,
M. and Dove, H., CSIRO Plant Industry Canberra Australia, Eds., Sheep Nutrition,
CABI Publishing, CAB international, Oxon, UK, 237-263.
https://doi.org/10.1079/9780851995953.0237
[11] Solaiman, S.G. (2010) Goat Science and Production. John Wiley and Sons, Inc.,
Publication, Blackwell Publishing, Hoboken.
[12] Abdullah, Y.A., Rami, T.K., Momani, M.S. and Mohammad, D.O. (2010)
Investiga-tion of Growth and Carcass Characteristics of Pure and Crossbred Awassi Lambs.
Small Ruminant Research, 94,167-175.
[13] Boujenane, I. (2015) Growth at Fattening and Carcass Characteristics of D’man,
Sardi and Meat-Sire Crossbred Lambs Slaughtered at Two Stages of Maturity.
Tropical Animal Health and Production, 47, 1363-1371.
https://doi.org/10.1007/s11250-015-0872-x
[14] Santos-Silva, J., Mendes, I.A. and Bessa, R.J.B. (2002) The Effect of Genotype,
Feeding System and Slaughter Weight on the Quality of Light Lambs. 1. Growth,
Carcass Composition and Meat Quality. Livestock Production Science, 76, 17-25.
[15] Fozooni, R. and Zamiri, M.J. (2007) Relationships between Chemical Composition
of Meat from Carcass Cuts and the Whole Carcass in Iranian Fat Tailed Sheep as
Affected by Breed and Feeding Level. Iranian Journal of Veterinary Research, 8.
[16] Mishra, B.B., Gebrekidan, H., Kibret, K., Assen, M. and Eshetu, B. (2004) Soil and
Land Resource Inventory at Alemaya University Research Farm with Reference to Land Evaluation for Sustainable Agricultural Management and Production. Synthe-sis of Working Papers, Soil Science Bulletin No. 1. Alemaya University, Ethiopia.
Merkel, R.C., Eds., Sheep and Goat Production Handbook of Ethiopia. ESGPIP
(Ethiopian Sheep and Goat Productivity Improvement Program), Branna Printing Enterprise, Addis Ababa, Ethiopia, 5-26.
[18] Gizaw, S., Komen, H., Windig, J.J., Hanotte, O. and van Arendonk, J.A.M. (2008)
Conservation Priorities for Ethiopian Sheep Breeds Combining Threat Status, Breed
Merits and Contributions to Genetic Diversity. Genetics Selection Evolution, 40,
433-447. https://doi.org/10.1051/gse:2008012
[19] ESGPIP (2009) Ethiopia Sheep and Goat Productivity Improvement Program.
Es-timation of Weight and Age of Sheep and Goats. Technical Bulletin No. 23.
[20] ESGPIP (2011) Ethiopia Sheep and Goat Productivity Improvement Program.
Ex-port Requirements for Meat and Live Small Ruminants: How Can Development Agents Assist Producers to Improve Small Ruminant Export? Technical Bulletin No. 47.
[21] Sisay, L. (2009) Phenotypic Characterization of Indigenous Sheep Breeds in the
Amhara National Regional State of Ethiopia. MSc Thesis, Haramaya University, Ethiopia.
[22] Council for International Organizations of Medical Sciences and the International
Council for Laboratory Animal Science (2012) International Guiding Principles for Biomedical Research Involving Animals.
http://grants.nih.gov/grants/olaw/Guiding_Principles_2012.pdf
[23] Dhakad, A., Garg, A.K., Singh, P. and Agrawal, D.K. (2002) Effect of Replacement
of Maize Grain with Wheat Bran on the Performance of Growing Lambs. Small
Ruminant Research, 43, 227-234. https://doi.org/10.1016/S0921-4488(02)00025-1
[24] AFRC (1993) Agricultural Food and Research Council. Energy and Protein
Re-quirements of Ruminants. An Advisory Manual Prepared by the Agricultural Food and Research Council Technical Committee on Responses to Nutrients. CAB In-ternational, Wallingford, UK.
[25] De Boer, H., Dumont, B.L., Fomeroy, R.W. and Weniger, J.H. (1974) Manual on
E.A.A.P. Reference Methods for the Assessment of Carcass Characteristics in Cattle.
Livestock Production Science, 1, 151-164.
https://doi.org/10.1016/0301-6226(74)90055-4
[26] AOAC (1990) Association of Official Analytical Chemists. Official Methods of
Analysis. 15th Edition, AOAC, Virginia, USA.
[27] Van Soest, P.J. and Robertson, J.B. (1985) Analysis of Forages and Fibrous Foods a
Laboratory Manual for Animal Science. Cornell University, Ithaca, NY.
[28] SAS (2008) Statistical Analysis Systems Institute. Version 9.1, SAS Institute Inc.,
Cary, North Carolina, USA.
[29] Radostits, O.M., Clive, G., Kenneth, W.H. and Peter, D.C. (2006) Veterinary
Medi-cine: A Textbook of the Disease of Cattle, Sheep, Goats, Pigs and Horses. Saunders, Edinburgh.
[30] Kaneko, J.J., John, W.H. and Michael, L.B. (2008) Clinical Biochemistry of
Domes-tic Animals. 6th Edition, Elsevier Inc., Amsterdam.
[31] Dove, H. (2002) Principles of Supplementary Feeding in Sheep-Grazing Systems. In:
Freer, M. and Dove, H., CSIRO Plant Industry Canberra Australia, Eds., Sheep
Nu-trition, CABI Publishing, CAB International, Oxon, UK, 119-142.
https://doi.org/10.1079/9780851995953.0119
[32] ARC (1980) Agricultural Research Council. The Nutrient Requirements of
[33] Forbes, J.M. (1995) Voluntary Food Intake and Diet Selection in Farm Animals. CAB International, Oxon, UK.
[34] Kasahun, A. (2000) Comparative Performance Evaluation of Horro and Menz
Sheep of Ethiopia under Grazing and Intensive Feeding Conditions. PhD Disserta-tion, Humboldt University, Berlin.
[35] Fisher, D.S. (2002) A Review of a Few Key Factors Regulating Voluntary Feed
In-take in Ruminants. Crop Science, 42, 1651-1655.
https://doi.org/10.2135/cropsci2002.1651
[36] Getahun, L. (2001) Growth Pattern and Carcass Characteristics of Somali and Mid
Rift Valley Goats. MSc Thesis, Alemaya University of Agriculture, Ethiopia.
[37] Dereje, T., Mengistu, U., Getachew, A. and Yoseph, M. (2016) Growth and Carcass
Characteristics of Three Ethiopian Indigenous Goats Fed Concentrate at Different Supplementation Levels. SpringerPlus, 5, 414.
https://doi.org/10.1186/s40064-016-2055-2
[38] Tsegay, T., Yoseph, M. and Mengistu, U. (2013) Comparative Evaluation of Growth
and Carcass Traits of Indigenous and Crossbred (Dorper × Indigenous) Ethiopian
Sheep. Small Ruminant Research, 114, 247-252.
https://doi.org/10.1016/j.smallrumres.2013.07.003
[39] Pulina, G., Avondo, M., Molle, G., Francesconi, A.H.D., Atzori, A.S. and Cannas, A.
(2013) Models for Estimating Feed Intake in Small Ruminants. Revista Brasileira de
Zootecnia, 42, 675-690. https://doi.org/10.1590/s1516-35982013000900010
[40] McDonald, P., Edwards, R.A., Greenhalgh, J.F.D., Morgan, C.A., Sinclair, L.A. and
Wilkinson, R.G. (2010) Animal Nutrition. 7th Edition
[41] Hailu, A., Melaku, S., Tamir, B. and Tassew, A. (2011) Body Weight and Carcass
Characteristics of Washera Sheep Fed Urea Treated Rice Straw Supplemented with
Graded Levels of Concentrate Mix. Livestock Research for Rural Development, 23,
Article No. 164. http://www.lrrd.org/lrrd23/8/hail23164.htm
[42] Firisa, W., Adugna, T. and Diriba, D. (2013) Feed Intake, Digestibility and Growth
of Horrolambs Fed Natural Pasture Hay Supplemented with Graded Level of
Ver-nonia amygdalina Leaves and Sorghum Grain Mixture. Science, Technology and Arts Research Journal, 2, 30-37.
[43] Wogenie, B. (2007) Effects of Increasing Levels of Energy and Protein
Supplemen-tation on Feed Intake, Body Weight Change and Carcass Composition of Blackhead Somali Sheep Fed on Grass Hay. MSc Thesis, Haramaya University, Ethiopia.
[44] Oke, U.K. and Ogbonnaya, E.O. (2011) Application of Physical Body Traits in the
Assessment of Breed and Performance of WAD Sheep in a Humid Tropical
Envi-ronment. Livestock Research for Rural Development, 23, Article No. 24.
http://www.lrrd.org/lrrd23/2/oke23024.htm
[45] Vargas, S., Labri, A. and Sanchez, M. (2007) Analysis of Size and Conformation of
Native Creole Goat Breeds and Crossbreds Used in Smallholder Agrosilvopastoral
Systems in Puebla, Mexico. Tropical Animal Health and Production, 39, 276-286.
https://doi.org/10.1007/s11250-007-9012-6
[46] Chineke, C.A., Ologun, A.G. and Ikeobi, C.O.N. (2006) Haematological Parameters
in Rabbit Breeds and Crosses in Humid Tropics. Pakistan Journal of Biological
Sciences, 9, 2102-2106. https://doi.org/10.3923/pjbs.2006.2102.2106
[47] Njidda, A.A., Shuaibu, A.A. and Isidahomen, C.E. (2014) Haematological and
Se-rum Biochemical Indices of Sheep in Semi-Arid Environment of Northern Nigeria.
[48] Anwar, M.M., Nour El-Din, A.N.M. and Taha, T.A. (2012) Changes in Some He-matological and Serum Biochemical Parameters during the First Week after
Lamb-ing in Six Consecutive Parities in Some Egyptian Sheep Breeds. Egyptian Journal of
Animal Production, 49, 293-302.
[49] Tibbo, M., Jibril, Y., Woldemeskel, M., Dawo, F., Aragaw, K. and Rege, J.E.O.
(2004) Factors Affecting Hematological Profiles in three Ethiopian Indigenous Goat
Breeds. International Journal of Applied Research Veterinary Medicine, 2, 297-309.
[50] Okah, U., Chibueze, C.O. and Anya, M.I. (2013) Haematological and Biochemical
Characteristics of West African Dwarf Rams Fed Different Levels of Poultry
Drop-pings/Maggots Combination. Journal of Agricultural Technology, 9, 1151-1156.
[51] Oliveira, P.B., Lima, P.M.T., Campeche, A., Mendonc, S., McManus, C.,
Louvandi-ni, H. and Laviola, B.G. (2013) Growth and Carcass Characteristics of Santa Inês
Lambs Fed Diet Supplemented with Physic Nut Meal Free of Phorbol Ester. Small
Ruminant Research, 114, 20-25. https://doi.org/10.1016/j.smallrumres.2013.05.007
[52] Tope, A.F., Funmi, O., Adewumi, A. and Sunday, D.E. (2012) Performance,
Hema-tology and Serum Biochemistry of West African Dwarf Goats Fed Ensiled Mixtures
of Elephant Grass (Pennisetum purpureum) with Lima Bean, African Yam Bean
and Pigeon Pea. Kasetsart Journal-Natural Science, 46, 694-702.
[53] Isaac, L.J., Abah, G., Akpan, B. and Ekaette, I.U. (2013) Haematological Properties
of Different Breeds and Sexes of Rabbits. Proceeding of the 18th Annual Conference
of Nigerian Society of Animal Science, 24-27.
[54] Jawasreh, K., Awawdeh, F., Bani Ismail, Z., Al-Rawashdeh, O. and Al-Majali, A.
(2013) Normal Hematology and Selected Serum Biochemical Values in Different
Genetic Lines of Awassi Ewes in Jordan. The Internet Journal of Veterinary
Medi-cine,7.
[55] Hoffman, P.C., Esser, N.M., Bauman, L.M., Denzine, S.L., Engstrom, M. and
Ches-ter-Jones, H. (2001) Short Communication: Effect of Dietary Protein on Growth and Nitrogen Balance of Holstein Heifers. Journal of Dairy Science, 84, 843-847.
https://doi.org/10.3168/jds.S0022-0302(01)74542-0
[56] Shaker, Y.M., Ibrahim, N.H., Younis, F.E. and El-Shaer, H.M. (2014) Effect of
Feeding Some Salt Tolerant Fodder Shrubs Mixture on Physiological Performance
of Shami Goats in Southern Sinai, Egypt. Journal of American Science, 10.
[57] Catunda, A.G.V., Lima, I.C.S., Bandeira, G.C., Gadelha, C.R.F., Salmito-Vanderley,
C.S.B., Araújo, A.A., Martins, G.A., Pereira, E.S. and Campos, A.C.N. (2013) Blood Leptin, Insulin and Glucose Concentrations in Hair Sheep Raised in a Tropical
Climate. Small Ruminant Research, 114, 272-279.
Abbreviations
ADG = average daily gain, BHO = Blackhead Ogaden , CP = crude protein, CS = concentrate supplement, CSL = concentrate supplement levels, FCE = feed con-version efficiency, FBW = final body weight, IBW= initial body weight, DM = dry matter, OM = organic matter, NDF = neutral detergent fiber, ADF = acid detergent fiber, MCV = mean corpuscular volume, TG = total gain, PCV = packed cell volume, Hgb = haemoglobin, MCH = mean corpuscular hemoglo-bin, MCHC = mean corpuscular hemoglobin concentration, RBC = red blood cell, WBC = white blood cell.
Submit or recommend next manuscript to SCIRP and we will provide best service for you:
Accepting pre-submission inquiries through Email, Facebook, LinkedIn, Twitter, etc. A wide selection of journals (inclusive of 9 subjects, more than 200 journals)
Providing 24-hour high-quality service User-friendly online submission system Fair and swift peer-review system
Efficient typesetting and proofreading procedure
Display of the result of downloads and visits, as well as the number of cited articles Maximum dissemination of your research work
Submit your manuscript at: http://papersubmission.scirp.org/