Ukrainian Export Diversification: Macro
Level Analysis
Zubritskiy, Artur
Financial Law Research Institute
20 December 2014
Online at
https://mpra.ub.uni-muenchen.de/70562/
№
тужними джерелами зростання внутрішнього ринку і виведення економіки України зі стану рецесії
Ключові слова внутрішній ринок конкуренція ефективність ринку відкри тість економіки глобальний ланцюг створення вартості давальництво імпортозаміщення
UDC 338.33:339.564
ZUBRITSKIY Artur, the scientific associate of the economic and mathematic modeling, analyzing and forecasting department of the Financial Law Research Institute of National State Tax Service University of Ukraine
UKRAINIAN EXPORT
DIVERSIFICATION:
MACRO LEVEL ANALYSIS
0Complex microanalysis of Ukrainian goods exporting diversification on extensive and intensive basis was made. The national export structure deviations from the world one were formulated. Product codes groups characterized by the highest export concentration were detected.
K e y w o r d s :export, export diversification, export sector, export structure.
ЗубрицкийА. Диверсификацияукраинскогоэкспорта: анализнамакроуровне.
Проведенкомплексныймакроанализтоварнойдиверсификацииукраинскогоэкспортана экстенсивнойиинтенсивнойоснове. Формализированыотклоненияструктурыоте
-чественного экспорта от мировой. Выявлены группы товарных кодов, характери
-зующиесявысокойконцентрациейэкспорта.
Ключевые слова: экспорт, диверсификацияэкспорта, экспортныйсектор,
структураэкспорта.
Background. Foreign trade is an important source of economic growth in economy globalization terms. It particularly refers to small open ones
among which Ukraine can be ranked. One of the most important tasks in
economic security sphere for such countries is the export sectors development by maximal diversification provision of export flows.
According to the state export support system creating Concept №
586-2013-р from 01.08.2013 "…the problem of Ukrainian export imbalance
where the goods with low processing level exceed requires from the state
0
№
new approaches to national export policy implementing directed to export diversification and its growth in goods with high value added". Among the problems preventing national economy’s export potential implementation in full is the low product and geographic Ukrainian export diversification [1]. This thesis requires an adequate analytic background enabling not only to measure in terms of quantity national export diversification, but detect the export sectors, where this index is low. These are the sectors which are the
focal points of maximal Ukrainian export1 potential implementation and
they require a particular attention as an effective state support.
Analysis of recent research and publications. The considerable interest to export diversification problems appeared in the world science in
the mid of the 1950-s of the ХХ century due to liberalization expending
pro-cesses of international movement of goods and services. At present a consi-derable research base on export diversification both in developed countries, and in the developing ones is worked out. While the review and systema-tization of the whole range of foreign scientific works can be the subject for a separate research there are sufficient reasons to consult national materials and normative documents devoted to export diversification theory and analysis.
In the works by O. Pindyuk and O. Slabospitskaya using indices by Hirschman and Herfindahl-Hirschman is established that Ukrainian export concentration was low in 1996–2009 [2; 3]. Analyzing export diversifi-cation for Ukraine and Belarus, O. Bessedina uses Herfindahl-Hirschman indices reciprocal series. Such procedure applying complicates analysis results, because one can realize the real export diversification level only comparing it with indices reciprocal series for other countries. According to results obtained the diversified branch by assortment is machine building, agriculture is characterized by the highest market diversification [4]. The World Bank’s experts determined on the basis of Herfindahl-Hirschman and diversification indices applying that in 2002 export concentration grew as a result of economic decline [5]. At the same time it is difficult to understand how much national export structure differs from the world one. The attempt to compute the appropriate diversification index was made by N. Sakalo [6]. But this index interpretation isn’t right, because he estimates not the product structure level, but the degree of export diversification remoteness from the world one. I. Markovych analyzes the geographical export diversification according to separate product groups and makes a conclusion that among the priority product groups for Ukraine the market for railway machine building is the most concentrated one.
In whole in Ukraine export diversification is analyzed according to the world economic science, but rather irregularly and it doesn’t enable to define clearly the main problematic export sectors [7].
1
№
Taking this into consideration the aim of this article is Ukrainian
goods export diversification analysis on the macro level to detect the segments having the potential to its intensification.
Materials and methods. In the research a statistic database by UN product trade (UN-COMTRADE) [8] and database on foreign trade by the World Bank (WITS) [9] comprising detailed bilateral data on export-import transactions in more than 170 countries of the world was used. To provide the ability of data comparing the Harmonized Commodity Description and
Coding System (Harmonized System, hereinafter referred to as HS2) at
different detailing levels was used. For the purpose of the of full data
coverage the redaction HS 19963 is applied, as for this one the maximum
amount of information on Ukraine’s trade partners is available. The research period is 2004–2012.
Results. Theexport diversification can be defined as an available goods and/or geographical export structure transformation. For developed countries diversification is often considered as a transfer from traditional to new (nontraditional) export goods.
Let’s define two main forms of export diversification: horizontal and vertical ones. Horizontal diversification occurs within one economy’s sector and is new goods adding to the existing export basket in this sector for the purpose of lightening economic (related with price instability and general trend to price reducing) and political risks. Vertical diversification is a transfer from national export goods producing in primary economic sector to their producing in the secondary and tertiary ones. It includes searching further ways of national goods using with available means of their value added increasing, such as: deeper processing, marketing, and other services available [10].
Export diversification relative to goods and trade trends can carry out on extensive (export goods range expanding, searching new goods sales markets) and intensive (export value increasing for the same destination countries and within existing product assortment) basis. Thus, diversification on the extensive basis is closely associated with horizontal diversification, and at the same time the vertical one is the export diversification background on the intensive basis. On the assumption of export diversification theory, it is necessary to examine intensive and extensive national export diversification
basis (table 1).
To detect export diversification by export product assortment expanding and searching new destination markets, it is sufficient to make a simple arithmetical calculation of export markets number and goods export amount. The necessary condition of this is the high data detailing level, that’s why it is rational to analyze Ukrainian export diversification on the HS subheading
2
Ukrainian foreign economic activity goods classification is the complete analog of the Harmonized Commodity Description and Coding System (HS).
3
№
level (detailing level – 6 product code digits). On making calculation export and import items, which cost estimate during the period analyzed exceeded $10,000 per year ate taken into consideration.
Table 1
Ukrainian export diversification indices at the extensive basis in 2004–2012
Index 2004 2005 2006 2007 2008 2009 2010 2011 2012 Goods items amount 2063 2122 2147 2292 2282 2147 2210 2242 2227 Export markets
amount 117 126 126 129 130 130 129 123 95
* Made by the author according to WITS [9]
As the table 1 shows in 2007–2008 maximum export assortments
expanding and Ukraine’s geographical partners range occurred. However, in post-crisis period (2010–2012) the progressive export product assortment
increasing together with destination market devoted loss occurs 4.
So, in pre-crisis period Ukrainian export sectors actively utilized goods extensive product export diversification base, which expanding opportunities were leveled by the world economic crisis. A considerable export assortment reducing is the illustration that foreign trade can be communicating economic crises channel. On the other hand, a threatening trend is the substantial Ukrainian export destination markets reducing at the end of the period analyzed.
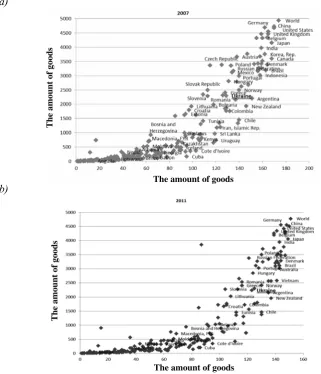
For the purpose of the real situation in Ukrainian goods and geographical export diversification comprehension there are sufficient reasons to compare the appropriate indices with the world ones. In the Figure 1 the indices of export items amount and destination markets for all
the countries of the world in pre-crisis 2007 (figure 1a) and pos-crisis 2011
(figure 1b) periods are shown.
On Ukraine with small open economy world goods markets conditions
affect. For the purpose of the effect visualization given in figure 1 just 2007
and 2011 are compared, which are considered in the world economic research practice as the last pre-crisis year and the first world economy’s reha-bilitation thereafter.
As it is seen from the figure 1 according to export product assortment
and destination markets amount Ukrainian export sector is on the top of the world data indices allocation. Entirely, the best indices are typical for developed countries. Simultaneously by indices analyzed Ukraine is at the level of such countries as Hungary, Finland, Mexico, Bulgaria, Israel, Greece,
4
№ and Romania. It means that geographical and assortment national export diversification is rather high and equal to the developing countries level.
Data comparison of 2007 and 2011 enables to make a conclusion that product assortment reducing and export markets loosing typical for Ukraine are the world trends. In fact, Ukrainian export situation in pre-crisis and post-crisis periods in indices analyzed allocation remain unchangeable.
a)
[image:6.595.171.493.179.554.2]b)
Figure 1. Export items and destination markets amount of the countries of the world in 2007 and 2011
(Calculated and made by the author according to the WITS data [9])
Export diversification on extensive basis is possible only to certain restrictions. At one hand, constant product assortment expanding is impossible due to existing world one and trade partners countries list, from the other hand, each export product or export market can be considered a "new" one during only a year, when export product assortment and export market list were expanded.
The amount of goods
The amount of
goods
The amount of
goods
№
More desirable for the world practice of the world trade researching and regulating is export diversification at intensive basis. Such diversi-fication form extending stimulates industries with high value added level, creates the prerequisites for employment growth in the economy, smoothes anywise a swing in the world economic activity, and reduces export risks.
For the purpose of Ukrainian trade export diversification research we apply two indices, used in the world practice of foreign trade analysis: normalized concentration index by Herfindahl, proposed by WTO experts
(Bacchetta, et al, 2012) [11], and normalized one by Herfindahl-Hirschman,
used by UNCTAD (UNCTAD, 2013) [12].
The simplest diversification index is the inverse one to Herfindahl concentration index, which is each industry (or product group) share sum of squares in the overall country’s volume of exports. If the country is denoted
as i, and its certain industry (or product group) as k, Herfindahl index can be
written as a formula:
( )
∑
= k i k i sh 2 , (1)
where ski – is industry (or product group) share k in country’s volume of
exports i;
k – goods export amount.
According to modeling i
h fluctuates 1/k to 1. The index can be
normalized within zero and unity, in such case it is Herfindahl index, that is
in question nhi:
. 1 1 1 k k h nh i i − −
= (2)
If such concentration indices as Herfindahl index are calculated only within product assortment available, they measure concentration/diversifi-cation on intensive basis.
Herfindahl-Hirschman index nHH can be shown as a formula:
, 1 1 1 1 2 1 j k k x x nHH k i k i ij i − − ⎟ ⎟ ⎟ ⎟ ⎠ ⎞ ⎜ ⎜ ⎜ ⎜ ⎝ ⎛ = ∑ ∑ =
= (3)
where xij is product value of exports i by the country j.
Both indices vary within 0≤nHH,nhi≤1; index approximation to
№ One of the main problems of the indices mentioned is their depen-dence at the disaggregation level of statistic data used during the analysis. For the purpose of elimination of possible index understating Ukrainian product export diversification analysis will be made in two steps:
1) normalized concentration indices calculating is made on three HS
detailing levels: at chapter level (two digits of Electronic Product Code), headings (four digits of Electronic Product Code), and subheadings (six digits of Electronic Product Code) without any updating and restricting;
2) for eliminating effecting the final result of the codes, which export
transactions amounts are small, starting data limitation procedure is made5.
It is a small product items withdrawal from calculations made by such principle: at the level of HS subheadings on calculating all product items, which export amount doesn’t exceed 1 billion USD per year are taken into consideration; at the level of HS headings – product items, which export amount doesn’t exceed 10 billion USD per year; at the level of HS headings product items, which export amount doesn’t exceed 100 billion USD per year aren’t taken into consideration.
Ukrainian export diversification indices calculations on intensive basis
[image:8.595.169.541.401.637.2]results taking into account the restrictions are given in table 2.
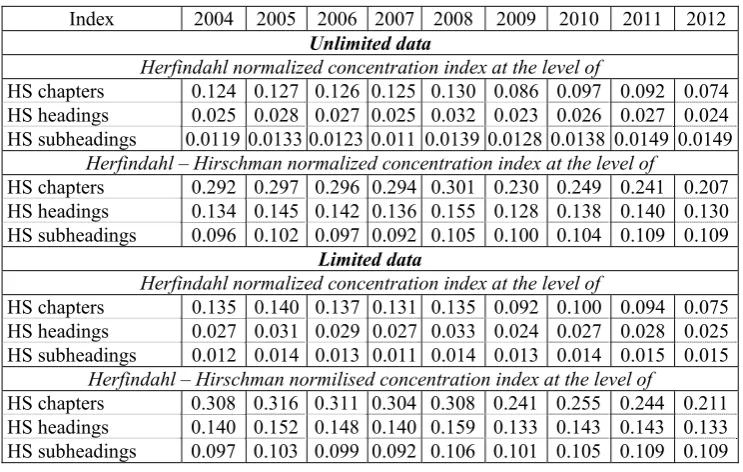
Table 2
Ukrainian export diversification concentration indices (according to detailing levels) in 2004–2012
Index 2004 2005 2006 2007 2008 2009 2010 2011 2012
Unlimited data
Herfindahl normalized concentration index at the level of
HS chapters 0.124 0.127 0.126 0.125 0.130 0.086 0.097 0.092 0.074 HS headings 0.025 0.028 0.027 0.025 0.032 0.023 0.026 0.027 0.024 HS subheadings 0.0119 0.0133 0.0123 0.011 0.0139 0.0128 0.0138 0.0149 0.0149
Herfindahl – Hirschman normalized concentration index at the level of
HS chapters 0.292 0.297 0.296 0.294 0.301 0.230 0.249 0.241 0.207 HS headings 0.134 0.145 0.142 0.136 0.155 0.128 0.138 0.140 0.130 HS subheadings 0.096 0.102 0.097 0.092 0.105 0.100 0.104 0.109 0.109
Limited data
Herfindahl normalized concentration index at the level of
HS chapters 0.135 0.140 0.137 0.131 0.135 0.092 0.100 0.094 0.075 HS headings 0.027 0.031 0.029 0.027 0.033 0.024 0.027 0.028 0.025 HS subheadings 0.012 0.014 0.013 0.011 0.014 0.013 0.014 0.015 0.015
Herfindahl – Hirschman normilised concentration index at the level of
HS chapters 0.308 0.316 0.311 0.304 0.308 0.241 0.255 0.244 0.211 HS headings 0.140 0.152 0.148 0.140 0.159 0.133 0.143 0.143 0.133 HS subheadings 0.097 0.103 0.099 0.092 0.106 0.101 0.105 0.109 0.109
*Calculated by the author according to WITS [9] та UN COMTRADE [10] data.
№
According to the table 2 data a preliminary conclusions can be made.
First, national export diversification is high. Normalized Herfindahl and
Herfindahl – Hirschman indices calculated values (both limited and unlimited) at all detailing levels testify about this. So, during the period analyzed Herfindahl concentration index at HS chapter level didn’t exceed 0.15, at the same time at the higher foreign trade data detailing levels this index is 0.04. Herfindahl – Hirschman index shows higher values and in 2005 reaches HS chapter level 0.316 (for limited data). At the higher starting data detailing levels index value doesn’t exceed 0.16. Based on formal Herfindahl and Herfindahl – Hirschman indices preliminary calculation conditions Ukrainian export concentration is low.
Second, according to the calculations a trend to Ukrainian product
export decreasing to 2008 at HS chapter level can be observed. Analyzed export concentration indices increasing (with unstable dynamics) testify about this. However, crisis phenomena at the world markets stopped this trend and caused Ukrainian export diversification level increasing.
Such dynamics allows making a conclusion about Ukrainian export growth by individual product items in demand in world market in favorable years. At the same time detailed data using creates fundamentally different picture. At HS subheadings level unstable analyzed indices decrease changing to permanent indices increase after 2008 is observed. Based on contrary results obtained during calculating, a necessity of further detailing and trends detecting at product groups level appears.
Third, calculations testify about high analyzed indices dependence on
starting data detailing degree. Besides, at different foreign trade data detailing levels contrary trends are observed. In whole normalized Herfindahl and Herfindahl – Hirschman indices calculating enables to make maximally impossible analysis quality decreasing due to indices mentioned disadvantages.
Analysis at macro level doesn’t allow defining the sectors which export is the most concentrated, as values obtained is an average amount by all Ukrainian export product groups. In connection with this a necessity of similar calculations at the certain industries level or in case of foreign trade data – homogeneous product code groups appears.
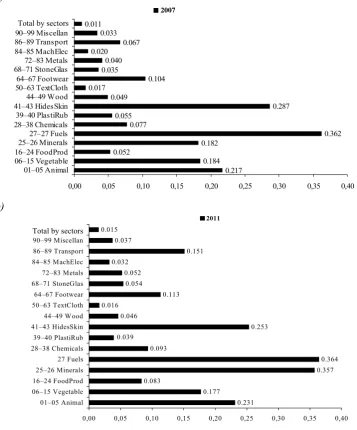
For the purpose of defining the least diversified sectors all the Ukrainian product export (at HS subheadings level) is divided into 16 product code groups and for each of them normalized Herfindahl index is calculated
separately. As a checkpoint for comparing 2007 (figure 2a) and 2011 (figure 2b)
are used.
Against the background of overall trend to Ukrainian export decreasing observed at macro level, the results of sector calculations at six-digit codes level show contrary trends and are rather informative.
№ the index analyzed is the highest are clearly observed, such as: fuel, mineral raw materials, leather and animal products.
As can be seen from figure 2a and figure 2b export concentration
in product code groups mentioned (excluding vegetable and leather products) in post-crisis period only increased. The highest national export concentration increasing was observed in the product code group combining mineral raw materials (from 0.182 to 0.357) and in transport (from 0.067 to 0.151). Together with this majority of another product code groups within comparison made also showed small normalized Herfindahl concentration index increasing.
a)
[image:10.595.175.533.227.658.2]b)
Figure 2. Normalized Herfindahl concentration indices in export sectors in 2007 and 2011 (Made by the author by WITS [9] and UN COMTRADE data [10])
0.217 0.184 0.052 0.182 0.362 0.077 0.055 0.287 0.049 0.017 0.011 0.033 0.067 0.020 0.040 0.035 0.104
0,00 0,05 0,10 0,15 0,20 0,25 0,30 0,35 0,40
01–05 Animal 06–15 Vegetable 16–24 FoodProd 25–26 Minerals 27–27 Fuels 28–38 Chemicals 39–40 PlastiRub 41–43 HidesSkin 44–49 Wood 50–63 TextCloth 64–67 Footwear 68–71 StoneGlas 72–83 Metals 84–85 MachElec 86–89 Transport 90–99 Miscellan
Всьогопосекторах
2007
Total by sectors
0.231 0.177 0.083 0.357 0.364 0.093 0.253 0.046 0.016 0.113 0.054 0.052 0.032 0.151 0.037 0.015 0.039
0,00 0,05 0,10 0,15 0,20 0,25 0,30 0,35 0,40 01–05 Animal 06–15 Vegetable 16–24 FoodProd 25–26 Minerals 27 Fuels 28–38 Chemicals 39–40 PlastiRub 41–43 HidesSkin 44–49 W ood 50–63 TextCloth 64–67 Footwear 68–71 StoneGlas 72–83 Metals 84–85 MachElec 86–89 Transport 90–99 Miscellan Всьогопосекторах
2011
№
So, the lowest Ukrainian export diversification level can be observed in fuel and mineral raw materials, vegetable and animal products export, light industry and in transport. These are the industries which must be the object of especial attention from the government in national economy export potential stimulating.
For the analysis of the Ukrainian export potential understanding how national export structure differs from the world one is very important. Its
indicator is normalized export structure diversification index Sj (index
Finger-Kreinin). Export structure diversification index Sj signals about the
availability of a certain country export structure differences or groups of
countries from the world one. Index values varying within0≤Sj ≤1, shows
export structure discrepancy degree of individual country or groups of countries from the average world one. Index approximating to 1 testifies about a certain country export structure differences increasing from the world one.
2 Sj
∑
−= i
i ij h
h
, (4)
where hij – is a product share і in the overall country export and groups
of countries j;
hi – is a product share іin the overall world export [12].
For the purpose of the Ukrainian export structure diversification two main approaches are used: Finger-Kreinin indices calculating on the data
detailed at the level of HS two-digit code basis (unlimited data in table 3);
Finger-Kreinin indices calculating at the data detailed at the level of HS two-digit code basis and voided from the product items effect which export
amount doesn’t exceed 100 billion USD (limited data in table 3).
For providing comparison of the values obtained in table 3
Finger-Kreinin indices for individual groups of countries of the world including Ukraine are also given.
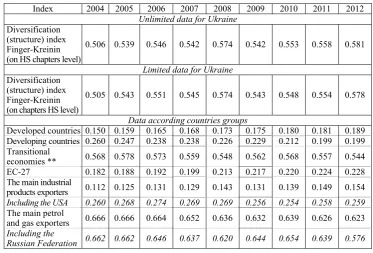
As the table 3 data show Ukrainian export structure considerably
differs from the world one, as Finger-Kreinin index for all the period analyzed exceeds 0.5. Besides, in the most developed export items segments such difference grew to 2008 (as analyzed index inconsiderably higher values for the limited data in this period show), while after 2008 contrary processes were observed.
№
Table 3
Ukrainian export structure diversification and individual countries of the world in indices 2004–2012 *
Index 2004 2005 2006 2007 2008 2009 2010 2011 2012
Unlimited data for Ukraine
Diversification (structure) index Finger-Kreinin (on HS chapters level)
0.506 0.539 0.546 0.542 0.574 0.542 0.553 0.558 0.581
Limited data for Ukraine
Diversification (structure) index Finger-Kreinin (on chapters HS level)
0.505 0.543 0.551 0.545 0.574 0.543 0.548 0.554 0.578
Data according countries groups
Developed countries 0.150 0.159 0.165 0.168 0.173 0.175 0.180 0.181 0.189
Developing countries 0.260 0.247 0.238 0.238 0.226 0.229 0.212 0.199 0.199
Transitional
economies** 0.568 0.578 0.573 0.559 0.548 0.562 0.568 0.557 0.544
EС-27 0.182 0.188 0.192 0.199 0.213 0.217 0.220 0.224 0.228
The main industrial
products exporters 0.112 0.125 0.131 0.129 0.143 0.131 0.139 0.149 0.154
Including the USA 0.260 0.268 0.274 0.269 0.269 0.256 0.254 0.258 0.259
The main petrol
and gas exporters 0.666 0.666 0.664 0.652 0.636 0.632 0.639 0.626 0.623
Including the
Russian Federation 0.662 0.662 0.646 0.637 0.620 0.644 0.654 0.639 0.576
*Made by the author by WITS and UNCTAD statistic data [13].
** According to UNCTAD classification of Ukraine are referred to the countries with transitional economy category.
According the table 3 data it can be seen that countries – industrial
goods exporters have almost six times more diversified export sectors structure, than the ones exporting hydrocarbons. The latter actually become hostages of such natural resources availability, without applying an effort for economic and export diversification.
Finger-Kreinin indices comparison for the USA and the Russian Fede-ration is also informative. American index three times exceeds an appro-priate Russian and two times Ukrainian ones. Taking into consideration a low mutual dependence of the economies of the USA and the Russian Federation, a significant difference between these countries industry structure becomes evident. An analogical conclusion can be made relating to the
groups, where they are referred in table 3.
Conclusion. Ukrainian export diversification testifies that:
•Ukrainian export diversification on extensive basis is rather high and
meets the developing countries level. At the same time significant reserves of foreign trade product assortment expending are available;
•Ukrainian export concentration at macro level measured on intensive
№
•individual export sectors characterized by higher export concentration
in comparison with others were detected, such as: fuel and mineral resources export, agricultural products, transport, and light industry products;
•against the background of satisfactory national export diversification
at intensive and extensive basis Ukrainian export signification deviations from the world one are clearly seen.
Ukrainian export diversification is at the developing countries level. However, the country doesn’t export the goods being in demand at world markets. It testifies about significant export potential availability and a necessity in its implementation stimulating both on extensive and intensive basis.
Further research outlook is such Ukrainian export product codes identi-fication, which under the condition of stimulating policy can make a basis for Ukraine’s export expansion at world markets.
REFERENCES
1. Pro shvalennja Koncepcii' stvorennja systemy derzhavnoi' pidtrymky eksportu Ukrai'ny : Rozporjadzhennja Kabinetu Ministriv Ukrai'ny vid 01.08.2013
№ 586-2013 [Elektronnyj resurs]. — Rezhym dostupu : http://zakon4.rada.gov.ua/ laws/show/586-2013-%D1%80.
2. Pindjuk O. Ukrai'na: zovnishnja torgivlja ta promyslova restrukturyzacija
[Elektronnyj resurs] / O. Pindjuk. — Rezhym dostupu : http://www.google.com.ua/ url?sa=t&rct=j&q=&esrc=s&source=web&cd=6&cad=rja&uact=8&ved=0CEIQ FjAF &url=http%3A%2F%2Ficps.com.ua%2Fpub%2Ffiles%2F49%2F12%2FINDE UNIS_Trade_UKR.doc&ei=ELLMU7K0F6rd4QSd34HADw&usg=AFQjCNF 9oRAFPuPm7aMi0fcWokYPhDFhtg&bvm=bv.71198958,d.bGE.
3. Slabospyc'ka O. Ju. Formuvannja zovnishn'oekonomichnoi' strategii'
vitchy-znjanymy pidpryjemstvamy v umovah ekonomichnoi' nestabil'nosti zrostannja / O. Ju. Slabospyc'ka // Visn. Hmel'nyc. nac. un-tu. — 2010. — № 2. — T. 2. — S. 27–31.
4. Besedyna E. Dyversyfykacyja torgovyh potokov y ekonomycheskyj rost
[Elektronnyj resurs] / E. Besedina. — Rezhym dostupu : www.kse.org.ua/ uploads/Media_%20presentation_Besedina.ppt.
5. Doslidzhennja torgovel'noi' polityky Ukrai'ny / Dokument Svitovogo banku. —
2004. — 174 s.
6. Sakalo N. I. Ocinka rozshyrennja torgovel'nyh vidnosyn Ukrai'ny z JeS
[Elektronnyj resurs] / N. I. Sakalo // Efektyvna ekonomika. — 2012. — № 4. — Rezhym dostupu : http://www.economy.nayka.com.ua/?op=1&z=1088.
7. Markovych I. Kil'kisne ocinjuvannja rivniv koncentracii' svitovyh rynkiv grup
tovariv eksportnoi' specializacii' Ukrai'ny / I. Markovych // Galyc. ekon. visn. — 2012. — № 6 (39). — S. 5–13.
8. Salomon Samen. A Primer on Export Diversification: Key Concepts,
Theo-retical Underpinnings and Empirical Evidence [Elektronnyj resurs] / Samen Salomon // Growth and Crisis Unit, World Bank Institute. — 2010. — Rezhym dostupu : https://blogs.worldbank.org/files/growth/EXPORT_DIVERSIFICATION_ A_PRIMER_May2010%281%29.pdf.
9. Baza danyh OON po mizhnarodnij torgivli tovaramy UN-COMTRADE [Elektronnyj resurs]. — Rezhym dostupu : http://comtrade.un.org.
№
11. Marc Bacchetta, et al. A Practical Guide to Trade Policy Analysis [Elektronnyj
resurs]. New York : United Nations Publications. — Rezhym dostupu : http://vi.unctad.org/tpa/web/docs/book.pdf.
12. UNCTAD Handbook of Statistics 2013 [Elektronnyj resurs] / United Nations
Publications. — № B.13.II.D.4. — Rezhym dostupu : http://unctad.org/en/ pages/Publication Webflyer.aspx?publicationid=759.
13. Statystychna platforma OON UNCTADstat [Elektronnyj resurs]. — Rezhym
dostupu : http://unctadstat.unctad.org/wds/ReportFolders/reportFolders.aspx.
Articles submitted to editors office of 15.09.2014.
ЗубрицькийА. Диверсифікаціяукраїнськогоекспорту: аналізнамакрорівні.
Постановкапроблеми.Заумовгеополітичнихтасоціально-економічнихвикликів,
що постали перед Україною, диверсифікація вітчизняного експорту є завданням
першочергової важливості в контексті економічної безпеки. Це обумовлює необ
-хідність проведенняаналітичного аналізудиверсифікації українськогоекспортута виділеннянайбільшпроблемнихекспортнихсекторів.
Аналізостанніхдослідженьіпублікаційпоказав, що, незважаючинависоку
зацікавленістьпроблемоюоцінкидиверсифікаціїекспортуувітчизнянихакадемічних колах, відповіднідослідженняздійснюютьсядоситьбезсистемнотанедаютьзмоги
чіткоідентифікуватинайбільшпроблемніекспортнісектори.
Метою статті єаналіз інтенсивної та екстенсивної основи диверсифікації українського експорту на макрорівні та ідентифікація експортних секторів, що
маютьнайвищийпотенціалдоїїпоглиблення.
Матеріалитаметоди.Впроцесідослідженнявикористанометодипорівняння,
графічний, табличний, індексний. Основнимджереломінформаціїєбазастатистич
-них данихтоварної торгівліООН (UN-COMTRADE) та данихстосовнозовнішньої
торгівліСвітовогобанку (WITS).
Результатидослідження.У статтіздійсненоаналіздиверсифікації україн
-ськоготоварногоекспортунаекстенсивнійтаінтенсивнійосновахпротягом 2004– 2014 рр. Встановлено, щодиверсифікаціявітчизняногоекспортунаекстенсивнійоснові
єдоситьвисокоютазнаходитьсянарівнікраїн, щорозвивається. Результатироз
-рахункудиверсифікаціїекспортунаінтенсивнійосновісвідчать, щовонавідповідно
до поширеноїдумки неєкритично низькою. Причинанизької ефективності україн
-ськогоекспортукриєтьсяусуттєвомувідхиленнійогоструктуривідструктурисві
-товогоекспорту, щовстановленонаосновірозрахункуіндексуФінгера-Крейніна. Також
ідентифікованіекспортнісектори, вякихконцентраціяекспортуєнайвищою, асаме:
експортпаливатамінеральноїсировини, продукціїсільськогогосподарства, транс
-порту, атакожпродукціїлегкоїпромисловості.
Висновки.Устатті, навідмінувідіснуючихвітчизнянихпублікацій, проведено
систематизованийкомплекснийаналіздиверсифікаціїукраїнськогоекспортунаріз
-нихрівняхдеталізації. Зарезультатамирозрахунківпропонуєтьсядваосновнихна
-прямимаксимальноїреалізаціїнаціональногоекспортногопотенціалу: стратегічний
татактичний. Стратегічнийнапрям, щовключаєприведенняструктуривітчизня
-ного експортуувідповідністьдосвітової, можебути реалізованийудовгостроко
-вому періоді. Тактичний напрямполягаєузниженніконцентраціїекспорту внайбільш
проблемнихсекторахзарахунокактивноїдержавноїполітики (ут. ч. фіскальної).
Основніположення, висвітленіустатті, можутьстатибазоюдляподальших
науковихдослідженьунапряміідентифікаціїтоварнихкодівукраїнськогоекспорту,
які за умови відповідної стимулюючої політики становитимуть основу реалізації експортного потенціалу України та покращання кількісної й якісної структури національногоекспорту.
Ключові слова: експорт, експортний потенціал, диверсифікаціяекспорту,
концентрація експорту, екстенсивна основа диверсифікації експорту, інтенсивна