IDENTIFICATION AND CHARACTERIZATION OF CO-LOCALIZED
EXPRESSED SEQUENCE TAGS (ESTS) UNDERLYING PUTATIVE
CANDIDATE GENES IN RICE (
Oryza sativa
L.)
R. K. Zote*, R. N. Dhawale1, G. Chandel2, S. B. Verulkar3 and A. S. Kotasthane4 *Assistant Professor, COAB, Georai Tanda-Aurangabad (MS) India. PIN-431 001.
1
Assistant Professor, VDCOAB, Latur, VNMKV, Parbhani, (MS), India. 2
Associate Professor, Department of Plant Molecular Biology and Biotechnology, IGKVV,
Raipur (CG), India.
3
Professor and HOD, Department of Plant Molecular Biology and Biotechnology, IGKVV,
Raipur (CG), India.
4
Professor and Head of Department, Department of Plant Pathology, IGKVV, Raipur (CG).
ABSTRACT
Rice (Oryza sativa L.) grain iron and zinc content is a polygenic
complex trait having additive effect of multiple genes thus
identification of QTLs and sequence analysis of genomic region
encompassing them enable us to understand not only the inheritance of
grain micronutrient content but also to develop Fe/Zn rich rice using
marker assisted breeding techniques. Co-segregation analysis was
performed with the F6 mapping population derived from a cross
between rice cultivar Swarna x Moroberekan. The grain Fe content
ranged from 9.68 to 19.98 μg/g with an average of 16.87 μg/g and
grain Zn content ranged from 15.85 to 20.84 μg/g with an average of
25.76μg/g among the 73 homozygous rice mapping population.
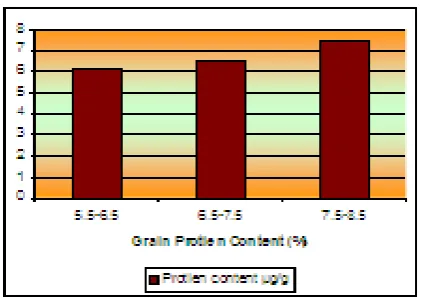
Similarly the grain protein content ranged from 5.34% to 7.18% with an average of 9.23%. In
order to identify novel SSR based molecular markers, 5 known QTLs (qFE-1, qFE-9, qZN-5,
qZN-7 and qZN-11) identified[9] for grain Fe/Zn content in rice were analyzed using in-silico
tools. Out of 1063 novel SSRs loci present within the 5 QTL regions, 161 Class I SSRs with
Volume 5, Issue 4, 555-572. Research Article ISSN 2277– 7105
*Correspondence for Author
R. K. Zote
Assistant Professor,
COAB, Georai
Tanda-Aurangabad (MS) India.
PIN-431 001. Article Received on 04 Feb 2016,
Revised on 26 Feb 2016, Accepted on 17 March 2016
designed primers, 4 randomly selected RM markers and 22 novel SSR designed markers,
only 18 markers were found to be polymorphic. The allelic segregation analysis indicated that
indica parent Swarna contributed about 60.6% whereas the japonica parent Moroberekan
contributed about 34.32% of total amplified alleles on an average which clearly showed
departure from the theoretically expected 1:1 ratio of equal contribution from the two parents.
Out of 18 polymorphic SSRs, the co-segregation analysis performed for the 5 randomly
selected SSR‟s markers. The all five markers; gRMm7-2, gRMm7-3, gRMm33-2,
gRMm34-1 and gRMm33-3 were significantly associated to grain iron and zinc contents.
KEYWORD: in-silico, Rice, allelic segregation, SSRs, Fe content, Fe/Zn, QTLs.
INTRODUCTION
Rice is vital staple food of more than half of the world‟s population, primarily the poor
people living in Asia and Latin America. Approximately, 90 countries cultivate rice, farmers
from irrigated upland, lowland and flood-prone areas across Asia are major rice producers.
Rice represent single largest source of calories in the world.[6] The human body requires more
than 22 minerals elements that can be supplied by an appropriate diet.[13] Rice has been a
model plant for almost all genomics and molecular biology research owing to its small and
compact genome. This research is important because the fruits of such research are going to
affect major shift in food productivity and human nutrition.[12] Poor grain protein content in
rice is an important cause of widespread protein malnutrition among rice eating population
especially those residing in developing nations.[10] In India about 47% of children are
suffering from protein energy malnutrition (PEM) with infants suffering more from clinical
or sub clinical levels of protein deficiency.[16] However, rice is a poor source of essential
micronutrients such as Fe and Zn.[1] Micronutrient malnutrition, and particularly Fe and Zn
deficiencies (the so called „hidden hunger‟), affect over three billion people worldwide,
mostly in developing countries.[18]
Enhancing GPC of rice is a recent food based approach that has gained attention not only of
nutritionists and crop biologists but also of renowned economists all over the world.[4]
Recently, a sustainable solution to mineral malnutrition termed as „Biofortification‟ has been
proposed of crop plants through enhanced in the edible portions of crop plants through
agronomic intervention or genetic selection. Candidate gene approach is becoming a
widespread method for characterizing Quantitative Trait Loci (QTLs) as well as Mendelian
have been potentially useful in plant breeding. Apart from high amount of consumption the
quality of protein of rice is considered as high because of better digestibility. To improve
nutritive value of rice the preliminary step is to characterize genetic variability for grain
protein content in germplasm and then to use this variability for breeding nutrient rich rice.[3]
The complex polygenic traits are governed by Quantitative Trait Loci (QTLs) thus
identification as well as characterization of QTLs controlling grain micronutrient contents in
rice harbors great potential for Markers assisted selection (MAS) and QTLs introgression
based breeding approaches to develop nutrient rich rice.
The candidate genes or DNA sequences with predicted functions serves as an important
source to generate novel molecular markers within a given QTL region which is likely to
show more stable association across the mapping populations or genetic stocks.[15] In this
context the present study was undertaken with in silico structural and functional
characterization of QTLs controlling GPC and micronutrient content and identification of
candidate gene based QTLs specific markers, phenotypic characterization of parents and
mapping population for grain micronutrient, protein and amino acid and genotyping of the
mapping population for validation of novel molecular markers.
MATERIALS AND METHODS Materials
The plant material used for this study includes the rice cross developed by Swarna x
Morobreken and the F6 population of 73 lines. Seeds of both parents and population were
sown in pots under green house conditions for 2-3 weeks, in the Department of Plant
Molecular Biology and Biotechnology. Before analyzing the rice samples for total grain
protein, iron and zinc content, 50gms of seeds of both parent and populations were subjected
to dehusking by using polyurethane coated hand dehulling unit to avoid metal contamination.
Estimation of protein
Total protein content of brown rice grains of all samples were estimated by modified
micro-Kjeldahl method[7] and the distilled samples were titrated against the 0.05 N Sulfuric acid
until the first appearance of violate color as the end point. The titer value was used to
Estimations of iron and zinc
Whole brown grains were subjected to di-acid mixture based digestion. Iron and zinc content
was estimated by using standard method described under[5] guidelines using Atomic
absorption spectrophotometer (AAS200).
Statistical analysis
The data obtained in present study was statistically analyzed using randomized block design,
for checking genetic differences within these advanced breeding lines. The different
parameters viz. standard deviation (SD), coefficient of variation (CV), coefficient of
correlation, standard error (SE) was calculated.
Identification of co-localized (ESTs) underlying putative candidate genes
In the present study analyzed distribution of identified ESTs in different tissues to predict
putative site of expression of iron and zinc related putative candidate genes. Out of 9 iron and
zinc related 5 QTLs genes analyzed in silico, ESTs were identified in 7 genes (metal cation
transporter, oxidoreductase/ transition metal ion binding protein, 2Fe-2S iron-sulfur cluster
binding domain containing, cation efflux family protein, heavy metal-associated domain
containing protein, transporter, major facilitator family, ion channel nompc). A total of 113
ESTS were identified in 7 genes with maximum 64 ESTs in LOC_Os09g26650 2Fe-2S
iron-sulfur cluster binding domain containing gene and minimum 5 ESTs in LOC_Os05g03780
gene encoding cation efflux family protein. The ESTs identified in each gene were then
categorized according to their corresponding expression in tissue library such as flower,
panicle, seed, leaves, roots, stem to understand putative site of expression. Figure 1 shows total number of ESTs identified in each gene and their distribution in different tissue libraries.
Characterization of putative candidate genes for grain iron and zinc content by MPSS signature analysis
A total of 35 MPSS tags (17 bp) were found corresponding to genes present in the QTLs
controlling iron and zinc content. Out of 21 MPSS tags, nine signature tags belonged to class
I (those present within the exonic region of the gene sequence) three belongs to II (within 500
bp potential 3_UTR) and class V (within intron, sense strand), one signature belonged class
III while five signatures belonged to class IV (unannotated). No tags belonging VI (within
intron, antisense strand) class of MPSS signature tags were identified. The abundance of a
MPSS tag in a tissue library (root, leaf, stem, meristematic, ovary, pollen, stigma, panicle and
is an indirect measure of level of corresponding gene expression. A TPM value of less than 5
corresponds to very low level while TPM value between 5-15 shows.
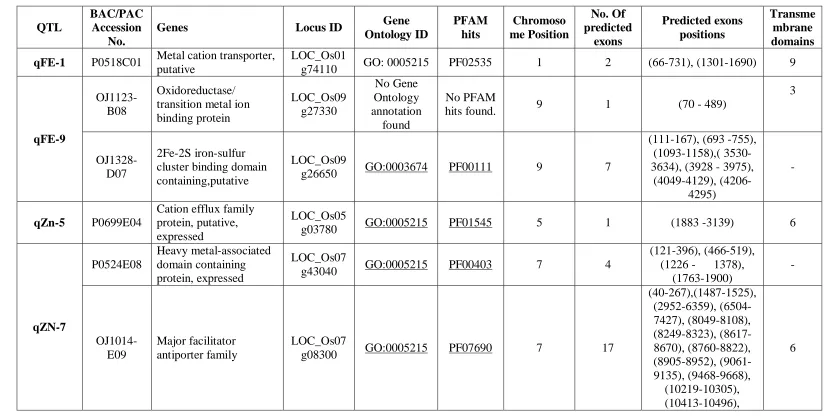
[image:5.595.123.473.136.516.2]Table 4: Detail of Putative candidate genes with their Clone ID, locus ID, GO ID, PFAM hits, chromosome position, no. of exons and no of predicted transmembrane domain for QTLs governing Iron and Zinc content in rice.
QTL
BAC/PAC Accession
No.
Genes Locus ID Gene
Ontology ID PFAM hits Chromoso me Position No. Of predicted exons Predicted exons positions Transme mbrane domains qFE-1 P0518C01 Metal cation transporter,
putative
LOC_Os01
g74110 GO: 0005215 PF02535 1 2 (66-731), (1301-1690) 9
qFE-9
OJ1123-B08
Oxidoreductase/ transition metal ion binding protein LOC_Os09 g27330 No Gene Ontology annotation found No PFAM
hits found. 9 1 (70 - 489)
3
OJ1328-D07
2Fe-2S iron-sulfur cluster binding domain containing,putative
LOC_Os09
g26650 GO:0003674 PF00111 9 7
(111-167), (693 -755), (1093-1158),( 3530-3634), (3928 - 3975),
(4049-4129), (4206-4295)
-
qZn-5 P0699E04
Cation efflux family protein, putative, expressed
LOC_Os05
g03780 GO:0005215 PF01545 5 1 (1883 -3139) 6
qZN-7 P0524E08 Heavy metal-associated domain containing protein, expressed LOC_Os07
g43040 GO:0005215 PF00403 7 4
(121-396), (466-519), (1226 - 1378),
(1763-1900) - OJ1014-E09 Major facilitator antiporter family LOC_Os07
g08300 GO:0005215 PF07690 7 17
(10578-10664), (11094-11138), (11537-11578), (12025-12027).
qZN-11
OSJNBb00 9F15
Transporter, major facilitator family, putative, expressed
LOC_Os11
g08370 GO:0005215 PF07690 11 1 (1117-2403) 12
OSJNBb00 84H09
Ion channel nompc, putative, expressed
LOC_Os11 g07980
No Gene Ontology annotation
found.
PF00023 11 4
(1837-2115), (2294-2614), (2902-2949),
(4155-4277)
-
This finding indicates the dynamic role of these genes in activities of plant defense and resistance related mechanisms. Collectively
LOC_Os07g08300 (qZN-7), LOC_Os07g43040 (qZN-7), LOC_Os09g27330 (qFE-9) are the top ranking genes in all the datasets.
Grain micronutrient (Fe and Zn) contents in parents and mapping population
The results of elemental analysis revealed in (Table 5) and brown grain zinc content ranged from 15.5 to 22.7 μg/g with an average of 25.76
μg/g in parents and mapping population.
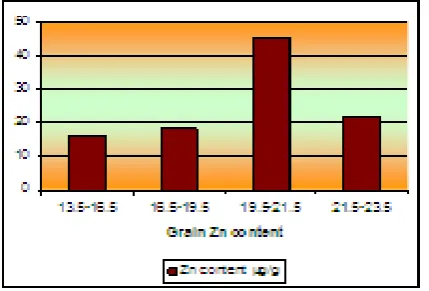
The frequency of the number of plants falling in each class indicated normal distribution of the population for grain Fe and Zn trait (Figure 2
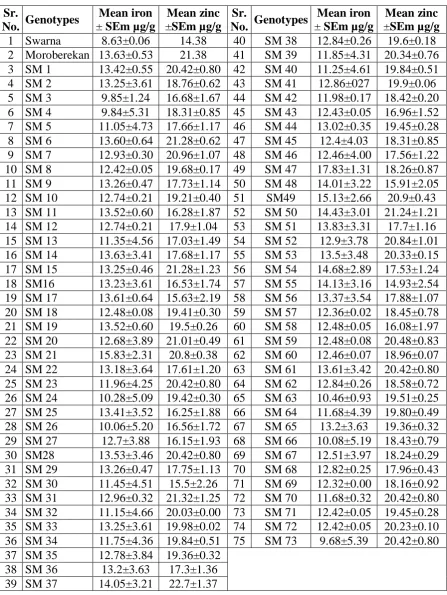
Table 5: Mean whole brown grain Iron and Zinc concentration in μg/g of 73 rice lines with parents Swarna and Moroberekan.
Sr.
No. Genotypes
Mean iron ± SEm µg/g
Mean zinc ±SEm µg/g
Sr.
No. Genotypes
Mean iron ± SEm µg/g
Mean zinc ±SEm µg/g
1 Swarna 8.63±0.06 14.38 40 SM 38 12.84±0.26 19.6±0.18
2 Moroberekan 13.63±0.53 21.38 41 SM 39 11.85±4.31 20.34±0.76
3 SM 1 13.42±0.55 20.42±0.80 42 SM 40 11.25±4.61 19.84±0.51
4 SM 2 13.25±3.61 18.76±0.62 43 SM 41 12.86±027 19.9±0.06
5 SM 3 9.85±1.24 16.68±1.67 44 SM 42 11.98±0.17 18.42±0.20
6 SM 4 9.84±5.31 18.31±0.85 45 SM 43 12.43±0.05 16.96±1.52
7 SM 5 11.05±4.73 17.66±1.17 46 SM 44 13.02±0.35 19.45±0.28
8 SM 6 13.60±0.64 21.28±0.62 47 SM 45 12.4±4.03 18.31±0.85
9 SM 7 12.93±0.30 20.96±1.07 48 SM 46 12.46±4.00 17.56±1.22
10 SM 8 12.42±0.05 19.68±0.17 49 SM 47 17.83±1.31 18.26±0.87
11 SM 9 13.26±0.47 17.73±1.14 50 SM 48 14.01±3.22 15.91±2.05
12 SM 10 12.74±0.21 19.21±0.40 51 SM49 15.13±2.66 20.9±0.43
13 SM 11 13.52±0.60 16.28±1.87 52 SM 50 14.43±3.01 21.24±1.21
14 SM 12 12.74±0.21 17.9±1.04 53 SM 51 13.83±3.31 17.7±1.16
15 SM 13 11.35±4.56 17.03±1.49 54 SM 52 12.9±3.78 20.84±1.01
16 SM 14 13.63±3.41 17.68±1.17 55 SM 53 13.5±3.48 20.33±0.15
17 SM 15 13.25±0.46 21.28±1.23 56 SM 54 14.68±2.89 17.53±1.24
18 SM16 13.23±3.61 16.53±1.74 57 SM 55 14.13±3.16 14.93±2.54
19 SM 17 13.61±0.64 15.63±2.19 58 SM 56 13.37±3.54 17.88±1.07
20 SM 18 12.48±0.08 19.41±0.30 59 SM 57 12.36±0.02 18.45±0.78
21 SM 19 13.52±0.60 19.5±0.26 60 SM 58 12.48±0.05 16.08±1.97
22 SM 20 12.68±3.89 21.01±0.49 61 SM 59 12.48±0.08 20.48±0.83
23 SM 21 15.83±2.31 20.8±0.38 62 SM 60 12.46±0.07 18.96±0.07
24 SM 22 13.18±3.64 17.61±1.20 63 SM 61 13.61±3.42 20.42±0.80
25 SM 23 11.96±4.25 20.42±0.80 64 SM 62 12.84±0.26 18.58±0.72
26 SM 24 10.28±5.09 19.42±0.30 65 SM 63 10.46±0.93 19.51±0.25
27 SM 25 13.41±3.52 16.25±1.88 66 SM 64 11.68±4.39 19.80±0.49
28 SM 26 10.06±5.20 16.56±1.72 67 SM 65 13.2±3.63 19.36±0.32
29 SM 27 12.7±3.88 16.15±1.93 68 SM 66 10.08±5.19 18.43±0.79
30 SM28 13.53±3.46 20.42±0.80 69 SM 67 12.51±3.97 18.24±0.29
31 SM 29 13.26±0.47 17.75±1.13 70 SM 68 12.82±0.25 17.96±0.43
32 SM 30 11.45±4.51 15.5±2.26 71 SM 69 12.32±0.00 18.16±0.92
33 SM 31 12.96±0.32 21.32±1.25 72 SM 70 11.68±0.32 20.42±0.80
34 SM 32 11.15±4.66 20.03±0.00 73 SM 71 12.42±0.05 19.45±0.28
35 SM 33 13.25±3.61 19.98±0.02 74 SM 72 12.42±0.05 20.23±0.10
36 SM 34 11.75±4.36 19.84±0.51 75 SM 73 9.68±5.39 20.42±0.80
37 SM 35 12.78±3.84 19.36±0.32
38 SM 36 13.2±3.63 17.3±1.36
39 SM 37 14.05±3.21 22.7±1.37
Variance 1.16µg/g (iron) and 2.74µg/g (zinc); SEm 7.05µg/g (iron) and 0.5636u/g (zinc);
Table. 6: ANOVA for grain Fe content.
SV D.F. SS MSS F-cal F-tab (5%)
Replication 2 1.8 0.9 .0.9 3.1
Treatment* 72 219.5 3.0 2.9 1.4
Error 144 1.0 1.0
Total SS 218 370
[image:9.595.199.415.317.466.2]* Significant at 5% and 1% level of significance and 72 degrees of freedom.
Table. 7: ANOVA for grain Zn content.
SV D.F. SS MSS F-cal F-tab (5%)
Replication 2 2.2 1.1 1.2 3.1
Treatment* 72 628.4 8.7 9.2 1.4
Error 144 137.4 1.0
Total SS 218 74890.36
* Significant at 5% level of significance and 72 degrees of freedom.
Figure. 2: Frequency distribution of grain zinc content in cross population showing normal distribution.
[image:9.595.201.416.534.679.2]Figure. 4: Frequency distribution of grain zinc content in cross population showing normal distribution.
Grain protein concentration
Whereas significant differences in protein and amino acid content among Japanese native
varieties were found, variety Brimful showed highest protein of 12.1% and lysine of
0.569g/100gm protein.[15] Wide variation for protein concentration in milled grains level
from 2.8% to 9.9% of rice germplasm lines of Chhattisgarh have been reported by[3] (Figure
4, Table 8 and 9).
Identification of novel SSR markers
Genomic region underlying five selected QTLs for grain micronutrient (iron and zinc)
content were analyzed for identification of SSRs using Batchprimer3 SSR search tool
(http://www.Batchprimer3). SSR markers were designed from the genomic DNA sequences.
A total of 1063 puatative SSRs were identified within genomic region encompassing the five
QTLs including 152 loci in qFE-1, 482 loci in qFE-9,223 loci in qZn-5 and 157 loci in
qZN-7. Occurrence of di and tri-nucleotide repeats occurred more commonly in all identified
SSRs (Table 10). Out of 1063 putative SSRs, 141 class I SSRs (more than 20 nt long) were
selected such that they covered each 100-200 Kb fragment of the QTLs in each question. Out
of the total Class I SSRs, 22 putative SSRs were found to be present in immediate vicinity of
a metal transporter or cross membrane transporter family protein or hypothetical protein
encoding genes (Table 11). The newly designed primers from 22 novel SSRs loci were used
to fine map the genomic region encompassing five known QTLs controlling grain iron and
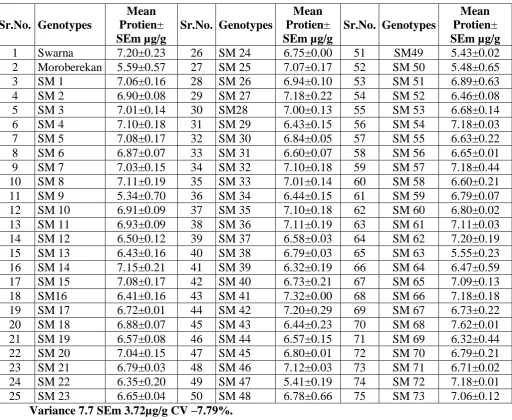
Table. 8: Mean whole brown grain protein. Sr.No. Genotypes
Mean Protien± SEm µg/g
Sr.No. Genotypes
Mean Protien± SEm µg/g
Sr.No. Genotypes
Mean Protien± SEm µg/g
1 Swarna 7.20±0.23 26 SM 24 6.75±0.00 51 SM49 5.43±0.02
2 Moroberekan 5.59±0.57 27 SM 25 7.07±0.17 52 SM 50 5.48±0.65
3 SM 1 7.06±0.16 28 SM 26 6.94±0.10 53 SM 51 6.89±0.63
4 SM 2 6.90±0.08 29 SM 27 7.18±0.22 54 SM 52 6.46±0.08
5 SM 3 7.01±0.14 30 SM28 7.00±0.13 55 SM 53 6.68±0.14
6 SM 4 7.10±0.18 31 SM 29 6.43±0.15 56 SM 54 7.18±0.03
7 SM 5 7.08±0.17 32 SM 30 6.84±0.05 57 SM 55 6.63±0.22
8 SM 6 6.87±0.07 33 SM 31 6.60±0.07 58 SM 56 6.65±0.01
9 SM 7 7.03±0.15 34 SM 32 7.10±0.18 59 SM 57 7.18±0.44
10 SM 8 7.11±0.19 35 SM 33 7.01±0.14 60 SM 58 6.60±0.21
11 SM 9 5.34±0.70 36 SM 34 6.44±0.15 61 SM 59 6.79±0.07
12 SM 10 6.91±0.09 37 SM 35 7.10±0.18 62 SM 60 6.80±0.02
13 SM 11 6.93±0.09 38 SM 36 7.11±0.19 63 SM 61 7.11±0.03
14 SM 12 6.50±0.12 39 SM 37 6.58±0.03 64 SM 62 7.20±0.19
15 SM 13 6.43±0.16 40 SM 38 6.79±0.03 65 SM 63 5.55±0.23
16 SM 14 7.15±0.21 41 SM 39 6.32±0.19 66 SM 64 6.47±0.59
17 SM 15 7.08±0.17 42 SM 40 6.73±0.21 67 SM 65 7.09±0.13
18 SM16 6.41±0.16 43 SM 41 7.32±0.00 68 SM 66 7.18±0.18
19 SM 17 6.72±0.01 44 SM 42 7.20±0.29 69 SM 67 6.73±0.22
20 SM 18 6.88±0.07 45 SM 43 6.44±0.23 70 SM 68 7.62±0.01
21 SM 19 6.57±0.08 46 SM 44 6.57±0.15 71 SM 69 6.32±0.44
22 SM 20 7.04±0.15 47 SM 45 6.80±0.01 72 SM 70 6.79±0.21
23 SM 21 6.79±0.03 48 SM 46 7.12±0.03 73 SM 71 6.71±0.02
24 SM 22 6.35±0.20 49 SM 47 5.41±0.19 74 SM 72 7.18±0.01
25 SM 23 6.65±0.04 50 SM 48 6.78±0.66 75 SM 73 7.06±0.12
Variance 7.7 SEm 3.72µg/g CV –7.79%. Table. 9: ANOVA for grain protein content.
SV D.F. SS MSS F-cal F-tab (5%)
Replication 2 0.239 0.12 0.41 3.1
Treatment* 72 47.75 0.66 2.30 1.4
Error 144 41.57 0.29
Total SS 218 89.57
* Significant at 5% level of significance and 72 degrees of freedom. Validation and Parental polymorphism analysis using SSR primers
In this study cross validated 34 previously designed primers and 4 known random rice
and Moroberekan (Figure 5). Out of 18 polymorphic primers, 5 primers were selected
randomly and were used for co segregation studies in the mapping population.
Table. 10: Total 1063 putative SSRs identified within five known QTLs controlling grain iron and zinc content in rice.
QTLs Putative
SSRs Motifs
qFE-1 for grain
iron content in rice 152
(acg)7, (tgg)6, (cag)6, (tcta)6, (gcc)7, (gtg)6, (ct)9, (tac)6, (ctgc)5, (gt)9, (ac)9, (gtt)6, (ta)26, (ta)40, (at)10, (g)23, (cc)9, (at)19, (at)33, (ta)16, (ctagct)3, (tc)9, (ctctc)4, (gaa)7,(tga)7, (ag)9, , (at)10, (gaa)6, (catca)4, (aat)7, (ccg)6, (cgc)6, (cgctcc)3, (cgc)6, (gga)6, (gga)6, (at)10, (tca)6, (aat)8, (tcc)8, (ag)10, (ga)14, (cct)6, (g)20, (cgc)9, (gca)7, (gcc)6, (tcc)8, (ta)32, (cgg)6, (c) 25, (cgc)6, (ct)13, , (gcc)6, (ta)41, (a)23, (gcc)7, (cgt)9, (gac)8, (gcc)7, (cgagct)4, (gcg)6, (gca)6, (gcg)6, (gcg)8, (tc)14, (ga)15, (tca)7, (acg)6, (c)22, (at)14, (at)11, (ta)14, (ct)9, (ta)23, (tatg)20, (cgc)6, (acat)6, (at)19, (cagctc)3, (ta)14, (aat)26, (atta)5, (ataac)5, (attagc)3, (aag)10, (ctc)7, (tttttc)3, (ttctc)4, (aatca)4, (tc)9, (ggt)6, (ggt)6, (tt)11, (at)25, (at)20, (aaag)5, (gat)7, (ctg)6, (ga)9, (gaa)6, (cttt)5, (aag)6, (aag)14, (gt)20, (ta)13,(tatg)6, (ta)10, (ta)15, (gac)7
qFE-9 for grain
iron content in rice 482
(ag)9, (ata)6, (tctt)6, (gt)9, (cgc)7, (gag)8, (tc)9, (tga)6, (cgg) 6, (tgga)5, (aaacaa)3, (ag)15, (gcgaga)3, (ct)17, (cgccgt)3, (cgccgt)3, (at)42, (tg)16, (tct)6, (ggc)6, (ttc)22, (ttaa)6, (ag)10, (at)13, (ag)15, (cag)6, (aat)10, (gga)8, (ggc)6, (ccg)6, (cgg)6, (gcaggt)3, (ta)10, (ga)14, (cga)6, (cga)6, (cga)6, (cacctc)4, (aat)6, (ccac)5, (tg)15, (ta)24, (tatg)18, (ctgcga)3, (cgc)6, (tc)10, (ga)11, (aata)6, (ggggcg)3, (gga)8, (ggacaa)3, (gcg)6, (ttc)6, (agc)7, (cgggtg)3, (ct)10, (gcg)10, (gccgag)3, (gcg)6, (at)13, (gcc)6, (gtc)6,
(gag)6, (ctg)6, (ac)10, (tagct)4, (ccg)6, (ggat)6, tctttc)3, (ccg)6, (at)14, (c)21, (gcct)5, (cca)6, (c)22, (ct)13, (tatc)11, (aataaa)3, (ctggt)4, (cgg)6, (gct)7, (taatag)3, (at)26, (ccg)6, (cct)7, (gcg)6, (gg)9, (ggt)7, (ta)13, (ccg)7, (ggc)6, (taga)7, (gcgt)5, (gcg)7, (t)20, (ta)13, (taat)5, (aattca)3, (gccgga)3, (ct)9, (ta)26, (at)42, (ct)30, (ta)31, (tg)20, (gct)9, (ccg)8, (ct)12, (ct)12, (ta)30, (ta)10, (ag)9, (gcg)6
qZN-7 for grain
zinc content 157
(ct)13, (tgg)6, (ctcct)4, (cgg)7, (gag)9, , (gcc)6, (ctt)12, (ag)22, (gct)6, (ttctt)4, (cgg)6, (ctt)6, (ag)17, (ag)20, (tc)10, (cag)8, (cgg)6, (c)21, (gg)9, (cgc)6, (tatc)6, (tatc)9, (ta)16, (gtg)6, (cg)9, (ct)11, (at)47, (ta)10, (at)18, (ac)9, (tc)9, (ct)10, (cgt)7, (gcg)7, (ta)38, (tc)19, (cttt)5, (cata)7, (taat)7, (cgg)6, (gga)6, (ga)11, (tc)16, (tgc)6, (ggc)6, (ag)12, (aga)6, , (ta)18, (gg)9, (ggc)7, (ag)17, (at)18, (gag)6, (tttc)6, (cgg)6, , (ta)38, (ta)40, (ta)11, (atg)7, (tgg)8, (ct)15, (cgg)6, (cgg)6, (ggc)7, (cgg)8, (tc)10, (gcc)7, (gcc)6, (ta)23, (ta)22, (gatc)5, (ct)20, (tc)10, (ttggt)4, (cgc)6, (gcg)8, (gcg)8, (gcg)6, (ttc)7, (ggc)6, (ag)10, (tt)9, (ttc)6, (ttaa)6, (ct)12, (cca)7, (ggc)6, (ta)9, (at)10, (aat)24, (ta)24, (cgc)9, (at)9, (atta)5, (ttc)7, (at)16, (ac)10, (at)10, (tc)18, (gg)9, (ag)14, (ag)15, (at)10, (at)11, (at)13
qZN-5 for grain
zinc content 110
(ta)32, (cgg)6, (ac) 25, (cgc)6, (ct)13, , (gcc)6, (ta)41, (a)23, (gcc)7, (tca)7, (acg)6, (at)22, (at)14, (at)11, (ta)14, (ct)9, (ta)23, (tatg)20, (cgc)6, (acat)6, (at)19, (cagctc)3, (ta)14, (cga)6, (cga)6, (cacctc)4, (aat)6, (ccac)5, (tg)15, (ta)24, (tatg)18, (ctgcga)3, (cgc)6, (tc)10, (ga)11, (aata)6, (gggcg)3, (aga)8, (gcaa)3,
qZN-11 for grain
zinc content 163
(ga)15, (cga)7, (cga)8, (cga)9, (cacctc)7, (aat)3, (ccac)25, (tg)25, (ta)24, (tatg)15, (ctgcga)32, (cgc)16, (tc)20, (ga)11, (aata)6, (ggggcg)3, (gga)18, (ggacaa)3, (gcg)6, (ttc)6, (agc)7, (cgggtg)3, (ct)10, (gcg)10, (gccgag)3, (gcg)16, (at)13, (gcc)6, (gtc)6, (gag)6, (ctg)16, (ac)10, (tagct)4, (ccg)16, (ggat)26, tctttc)3, (ccg)6, (at)14, (c)21, (gcct)5, (cca)6, (c)22, (ct)13, (tatc)11, (aataaa)3, (ctggt)4, (cgg)16, (gct)7, (taatag)3, (at)26, (ccg)6, (cct)7, (gcg)6, (gg)9, (ggt)27, (ta)13, (ccg)7, (ggc)6, (taga)7, (gcgt)5, (gcg)7, (t)20, (ta)13, (taat)5, (aattca)3, (gccgga)3, (ct)9, (ta)26, (at)32, (ct)20, (ta)21, (tg)20, (gct)4, (ccg)9(cgt)9, (gac)8, (gcc)7, (cgagct)4, (gcg)6, (gca)6, (gcg)6, (gcg)8, (tc)14, (ga)15,
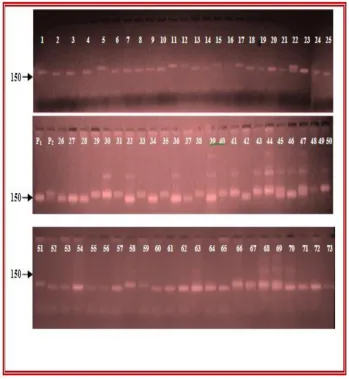
SSR based genotyping of mapping population
The five novel SSRs showing polymorphism with parents were selected for genotyping of
the mapping population. The genotypic data thus generated was analyzed for segregation of
Swarna and Moroberekan like alleles in the population (Figure 6). Swarna contributed about
50.1% of its trait (on the mean basis) whereas the Moroberekan contributed about 44.93% of
its trait on similar basis. Yet many rice lines of mapping population having Moroberekan like
allele were found to contain lesser grain micronutrient contents. All the 5 polymorphic novel
[image:13.595.86.535.484.749.2]SSRs markers show a significant deviation from the expected 1:1 ratio.
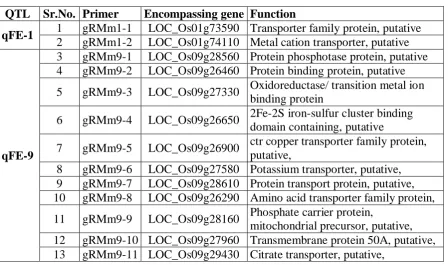
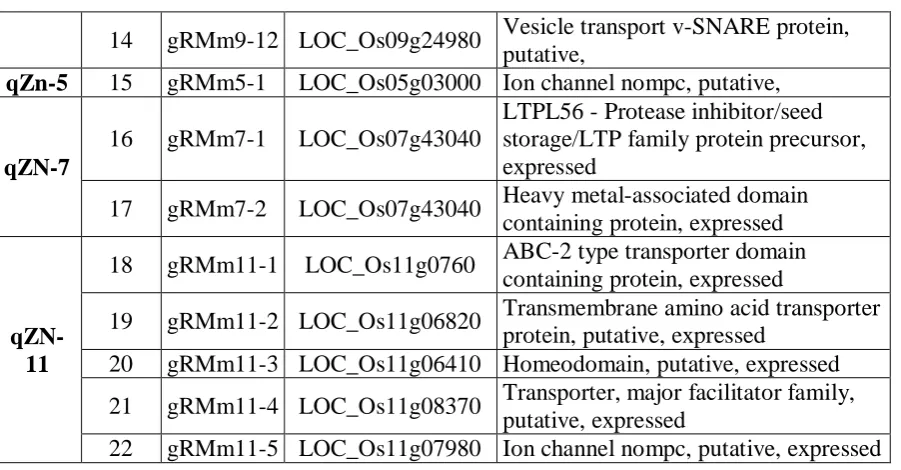
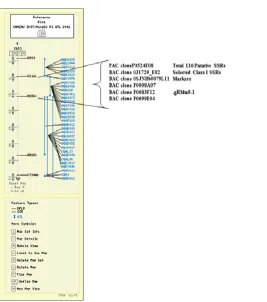
Table. 11: Genes present in the region encompassing 22 selected class -1 SSR loci. QTL Sr.No. Primer Encompassing gene Function
qFE-1 1 gRMm1-1 LOC_Os01g73590 Transporter family protein, putative
2 gRMm1-2 LOC_Os01g74110 Metal cation transporter, putative
qFE-9
3 gRMm9-1 LOC_Os09g28560 Protein phosphotase protein, putative
4 gRMm9-2 LOC_Os09g26460 Protein binding protein, putative
5 gRMm9-3 LOC_Os09g27330 Oxidoreductase/ transition metal ion
binding protein
6 gRMm9-4 LOC_Os09g26650 2Fe-2S iron-sulfur cluster binding
domain containing, putative
7 gRMm9-5 LOC_Os09g26900 ctr copper transporter family protein,
putative,
8 gRMm9-6 LOC_Os09g27580 Potassium transporter, putative,
9 gRMm9-7 LOC_Os09g28610 Protein transport protein, putative,
10 gRMm9-8 LOC_Os09g26290 Amino acid transporter family protein,
14 gRMm9-12 LOC_Os09g24980 Vesicle transport v-SNARE protein, putative,
qZn-5 15 gRMm5-1 LOC_Os05g03000 Ion channel nompc, putative,
qZN-7
16 gRMm7-1 LOC_Os07g43040
LTPL56 - Protease inhibitor/seed storage/LTP family protein precursor, expressed
17 gRMm7-2 LOC_Os07g43040 Heavy metal-associated domain
containing protein, expressed
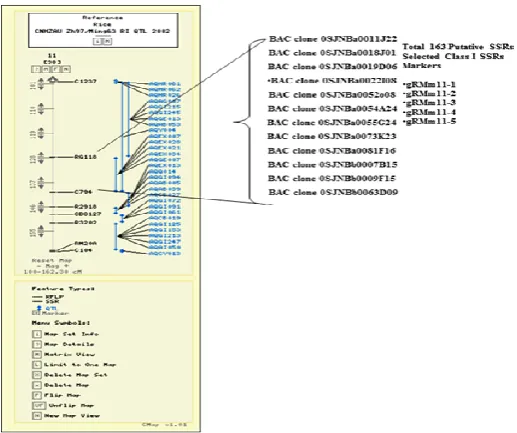
qZN-11
18 gRMm11-1 LOC_Os11g0760 ABC-2 type transporter domain
containing protein, expressed
19 gRMm11-2 LOC_Os11g06820 Transmembrane amino acid transporter
protein, putative, expressed
20 gRMm11-3 LOC_Os11g06410 Homeodomain, putative, expressed
21 gRMm11-4 LOC_Os11g08370 Transporter, major facilitator family,
putative, expressed
[image:14.595.85.536.62.297.2]22 gRMm11-5 LOC_Os11g07980 Ion channel nompc, putative, expressed
Figure. 8: Map position of QTL qZN-7 on Ch # 7 along with co-localized putative SSRs markers identified.
Association mapping
Single marker association mapping technique was used to identify the association of SSRs
markers to iron, zinc contents in brown rice grains. „t‟ value was determined for each of the
polymorphic primer to analyze its significant association to grain micronutrient content
which is presented in the Figure 10, Table 15 was checked with „t‟ value at 72 degree of freedom at 5% level of significance. The failure of independent segregation of marker loci
with the phenotypic class is said to display “linkage disequilibrium”.[14]
[image:16.595.162.421.497.713.2]Table. 15: ‘t’- test of the polymorphic primers for Zn and Fe content. Sr. No. Primer Chromosome t-value
(Zinc)
t-value (Iron)
Association with grain Fe content
Association with grain Zn content
1 gRMm7-3 7 851.16 1343 Associated Associated
2 gRMm34-1 3 463.12 661 Associated Associated
3 gRMm33-2 2 956.52 1449 Associated Associated
4 gRMm33-3 2 1074.66 1630 Associated Associated
5 gRMm7-2 7 492.15 690 Associated Associated
Figure. 10: Parental polymorphism profile using QTL specific SSR marker M- marker, P1-Swarna, P2- Moroberkan.
CONCLUSIONS
The grain protein content of different rice lines of population derived from cross between
Swarna and Moroberekan ranged from 5.34 to 7.18% with an average of 9.23%. The
brown grain iron content and zinc content ranged from 9.68 to 19.98 μg/g and 15.5 to
20.84 μg/g with an significant average of 16.87 μg/g and 25.76 μg/g respectively.
A total of 1063 SSRs have been identified in the genomic region of 5 known QTLs and
twenty two novel SSR primers have been designed from the selected Class I SSR loci
which are needed to be experimentally validated in the mapping population.
The co-segregation analysis for phenotypic and SSR genotypic data generated from the
F6 population revealed that 60% were Swarna like alleles and 35% were Moroberekan
like alleles. The three novel QTL specific SSRs markers namely gRMm7-2, gRM 7-3
gRMm33-2 and gRMm34-1 were significantly associated to grain iron content and zinc.
REFERENCES
1. Bouis, H. E., Graham, R. D. and Welch, R. M. The Consultative Group on International
Agricultural Research (CGIAR) micronutrients project: justification and objectives. Food
and Nutrition Bulletin, 2010; 21: 374–381.
2. Dellaporta, S. L., Wood, J. and Hicks, J. B. A plant DNA minipreparation: Version II,
Plant Mol. Bio. Rep., 1983; 1(14): 19-21.
3. Frei R. L., and Becker, M. A. The genome sequence and structure of rice chromosome 1.
Nature, 2002; 420: 312-316.
4. Harvest Plus; Rice Processing protocol. 2003; www.harvesplus.org.
5. Harvest Plus. 2006. Annual Report.
6. Hunnel, J. and Moritaka, K. In: Iron Fortification of Foods F. Clyesdale, K. Wiemen
(Eds.), Academic Press, Orlando, USA., 1985; 121-132.
7. Johry, R. P., Singh, S. P., Shrivastava, K. N., Gupta, H. O. and Lodha, M. L. Chemical
and biological evaluation of nutritional quality of food grains:a laboratory manual. ICAR,
New Delhi Publication., 2000; 2-11.
8. Kaiyang, Lu., Lanzhi, Li., Xingfei, Zheng., Zhihong, Zhang., Tongmin, Mou and
Zhongli, H.u. Quantitative trait loci controlling Cu, Ca, Zn, Mn and Fe content in rice
grains. Journal of Genetics, 2008; 87(3): 305-310.
9. Meyers, B. C., Galbraith, D. W., Nelson, T., Agrawal, V. Methods for Transcriptional
Profiling in Plants. Be Fruitful and Replicate. Plant Physiology, 2004; 135: 637–652.
10. Parvez S and Rather A. G. QTL analysis in rice improvement: Concep, methodology and
application. Biotechnology, 2007; 6: 1-13.
11. Philip, J. White and Martin, R. Broadley. Biofortifying crops with essential mineral
elements. Trends in Plant Science, 2000; 10(12): 586-593.
12. Prasanna, B. M. QTL mapping and its application in crop plant. Indian Agricultural
Research Institute. PUSA, New Delhi., 2008; 1-8
13. Singh, R. K., Gautam, P. L., Saxena, S. and Singh, S. Scented Rice germplasm;
Conservation, evaluation and utilization. In: Aromatic Rice, 2000; 107-131.
14. UNICEF. Vitamin and Mineral Deficiency: A global progress report. 2005; Ottawa and