Surface layer evolution in glow discharge optical emission
spectroscopy.
CHEN, Linghao.
Available from Sheffield Hallam University Research Archive (SHURA) at:
http://shura.shu.ac.uk/19452/
This document is the author deposited version. You are advised to consult the
publisher's version if you wish to cite from it.
Published version
CHEN, Linghao. (2005). Surface layer evolution in glow discharge optical emission
spectroscopy. Doctoral, Sheffield Hallam University (United Kingdom)..
Copyright and re-use policy
See http://shura.shu.ac.uk/information.html
r JEARtilNGOEMIRE
I
ICrtVCfe<PU3, HC.VAaDSTRffii
I I I
L - ^ c^ E L D S U V ja i
ProQuest Number: 10694333
All rights reserved
INFORMATION TO ALL USERS
The qua lity of this reproduction is d e p e n d e n t upon the qua lity of the copy subm itted. In the unlikely e v e n t that the author did not send a c o m p le te m anuscript and there are missing pages, these will be noted. Also, if m aterial had to be rem oved,
a n o te will in d ica te the deletion.
uest
ProQuest 10694333
Published by ProQuest LLC(2017). C o pyright of the Dissertation is held by the Author.
All rights reserved.
This work is protected against unauthorized copying under Title 17, United States C o d e M icroform Edition © ProQuest LLC.
ProQuest LLC.
789 East Eisenhower Parkway P.O. Box 1346
Surface Layer Evolution in Glow Discharge
Optical Emission Spectroscopy
Linghao Chen
A thesis submitted in partial fulfilment of the requirements
of Sheffield Hallam University
for the degree of Doctor of Philosophy
Abstract
Glow discharge optical emission spectroscopy (GDOES) is a modem analytical technique for the analysis of the chemical composition of bulk materials and the depth profiling of multi-layer structures. Most research in the use of GDOES has concentrated on developing accurate methodologies for quantitative analysis and depth profiling. However, this thesis presents a study on various aspects of surface layer evolution under argon ion etching in GDOES.
The GDOES technique relies on the ion bombardment of sample surfaces which removes material from the surface, layer by layer, on the atomic scale. During the surface layer evolution, the ion bombardment causes different surface micro-textures and preferential sputtering in individual crystallites, which can cause degradation of depth resolution in GDOES depth profiling. Experimental results using pure iron specimens in this study show a correlation between textures induced by GDOES sputtering and the sputtering rate, and a difference in the sputtering rate for crystallites with different crystal orientations.
In studying ion bombardment by GDOES in semiconductors, a novel pitting morphology on the surface of a carbon-coated silicon wafer was observed and characterised in detail. This may have a potential application in the fabrication of micro-lens arrays. The generation and development of the pits were investigated, which are believed to be dependent upon the different sputtering rates between the film and the substrate. Geometric features of the pits were obtained using atomic force microscope (AFM) and the sphere-like surface of the pit was confirmed. The experimental work in this study also shows that the Grimm source in GDOES is a powerful etching tool. Eroded surfaces of metal specimens with little damage to the crystallites and phase structures were obtained by GDOES etching. The method was found to be an ideal process for specimen preparation for electron back-scattered diffraction (EBSD). The GDOES-etched surface of single crystal copper showed that the damaged layer formed by mechanical polishing using 6 micron diamond paste was about 1-2 pm and was removed after only a few tens of seconds of GDOES etching. GDOES etching was also applied to an investigation of internal oxides in carburised steels. The eroded surfaces provided plan views of the morphologies of internal oxides of carburised steels by scanning electron microscopy (SEM) images. Results of energy dispersive spectrometer (EDS)/SEM elemental mappings of different layers of the steels were in good agreement with GDOES depth profiles, which revealed that the elements Cr, Mn and Si were involved in the oxides.
Acknowledgements
I would first like to thank Prof. John M. Rodenburg, the direct of study, and Dr. Mike C. Simmonds, the supervisor of the study, for providing me this opportunity to be involved in this research project at the Materials Research Institute of Sheffield Hallam University, for the supervision given throughout the study, and for help in this thesis.
I would also like to thank Dr. Xiaoxue An and Dr. Hanchang Xu for supplying me with the carburised steels and plating samples described in Chapter 5 and Chapter 6 and helpful discussions about the relevant sections.
Thanks are given to Dr. Hywel Jones and Dr. Cornelia Schonjahn for their help in pointing out errors in English in this thesis. Thanks are also given to Prof. Keith Berrington for his helpful comments on this thesis.
I am very grateful towards all the technical supports and help given to me from staffs in the Materials Research Institute.
I would like to acknowledge Sheffield Hallam University for their financial support of this study.
Contents
Abstract
III
Acknowledgements
IV
Chapter 1 Introduction
1
Chapter 2 Background of GDOES
8
2.1 Introduction 8
2.2 Glow Discharge Source and GDOES Instrument 9
2.2.1 The Grimm source in GDOES 9
2.2.2 Current-voltage-pressure characteristics of glow discharge source 12
2.2.3 Instrumentation of GDOES 13
2.3 Glow Discharge in GDOES 14
2.3.1 Structure of the glow discharge 14
2.3.2 Collision processes and behaviour of electrons in the plasma 16
2.3.2.1 Collision processes 16
2.3.2.2 Behaviour of electrons in the glow discharge 18 2.3.3 Properties of particles in the glow discharge 19
2.4 Sputtering in GDOES 21
2.4.1 Sputtering models 22
2.4.2 Sputtering yield and sputtering rate 24
2.5 Quantification Procedure in GDOES 29
2.5.1 Quantitative theory 2 9
2.5.2 The concept of emission yield in GDOES quantification 31 2.5.3 Differences between analyses of bulk and multi-matrix samples 32 2.5.4 The intensity normalization quantification method of GDOES analysis 33 2.5.5 Other investigations in GDOES quantification 37 2.5.5.1 Operating parameters effects on the emission yield 37
2.5.5.2 Background signal correction 40
2.5.5.3 Gaseous impurities effects on the glow discharge 42
2.6 Analytical Performance and Applications of GDOES 43
2.6.1 Analytical performance of GDOES 43
2.6.1.1 The detection limit 43
2.6.1.3 The analytical accuracy 2.6.1.4 The depth resolution 2.6.2 Recent Applications of GDOES
44 44 46
Chapter 3 Crystal Orientation Effects on the Sputtering Rate
in GDOES
55
3.1 Introduction 55
3.2 Experimental 56
3.3 Results and Discussion 61
3.4 Conclusions 69
Chapter 4 Pitting Phenomena in Surface Evolution of
Coated Samples
70
4.1 Introduction 70
4.2 Experimental 73
4.2.1 Coating process 73
4.2.2 Estimation of thickness of the coatings 73
4.2.3 AFM measurements 76
4.3 Experimental Results and Discussion 78
4.3.1 Experiments with different coatings 78
4.3.2 Effect of carbon film thickness on the pits formation 86 4.3.3 Effect of carbon film thickness on pits developing in the silicon
substrate 90
4.3.4 Identification of characteristics of pits on silicon wafers by AFM 91
4.3.4.1 Diameters and depth of the pits 91
4.3.4.2 Identification of surface of the pit 94
4.3.4.3 Developments of the pits in silicon wafers with different
thicknesses of the carbon film 94
4.3.4.4 Developing speeds of the pits in pit diameter and pit depth 96 4.3.4.5 A model of the pit formation and development 98
4.4 Conclusions 99
Chapter 5 The Applications of GDOES in Collection of
EBSD Pattern and Investigation on Internal
Oxides in Carburized Steels
101
5.1 Introduction 101
5.2 Collection of EBSD Pattern by Etching Surface in GDOES 103
5.2.1 Experimental 103
5.2.2 Results and discussion 104
and GDOES Depth Profiling 109
5.3.1 Experimental 109
5.3.2 Results and discussion 113
5.4 Conclusions 123
Chapter 6 Hydrogen Detection in GDOES
124
6.1 Introduction 124
6.2 Hydrogen Signal in GDOES Analysis 130
6.2.1 Hydrogen contamination in GDOES measurement 131
6.2.1.1 Experimental technique and results 131
6.2.1.2 Discussion 136
6.2.2 The hydrogen detection status in GDOES 138
6.2.2.1 Experimental and results 138
6.2.2.2 Discussion 141
6.2.3 Sample matrix effects on intensity of hydrogen contamination
in GDOES 141
6.2.3.1 Experimental details and results 142
6.2.3.2 Discussion 146
6.3 Detection of Hydrogen in GDOES 150
6.3.1 Hydrogen detection in bulk samples using GDOES 151
6.3.1.1 Experimental 151
6.3.1.2 Results and discussion 152
6.3.2 Hydrogen humps in plated samples detected by GDOES 153
6.3.2.1 Experimental and results 155
6.3.2.2 Discussion 160
6.4 The Hydrogen Effects on Emission Intensities and Concentrations of
Elements in GDOES Measurements 161
6.4.1 Experimental and results 162
6.4.2 Discussion 173
6.5 Conclusions 179
Chapter 7 Conclusions and Future Work
181
7.1 Conclusions 181
7.2 Future Work 184
References
187
List of Captions of the Figures in the Thesis
195
List of Captions of the Tables in the Thesis
202
Chapter 1 Introduction
Glow Discharge Optical Emission Spectroscopy (GDOES) is a modem analytical
instrument for analysis of the chemical composition of bulk materials and depth
profiling of multi-layer structures. Sputtering and atomic optical emission are
combined in the Grimm source (Grimm, 1968) in GDOES, providing an extremely
rapid, accurate and reliable technique with the advantages of simple specimen
preparation, relatively deep analytical depth and good reproducible measurements
compared to other quantitative techniques. GDOES is now routinely used to analyse
industrial and research materials (Payling, 1997a).
The motivation for this work was to examine the special considerations which must be
taken into account when GDOES is used to do analyses of quantitative depth profiling.
Most research in the use of GDOES has concentrated on developing accurate
methodologies for quantitative depth profiling. However, the study on GDOES in the
Materials Research Institute of Sheffield Hallam University, where this project was
undertaken, has presented some results and novel applications, which have not been
found in the literature. This thesis presents a study on various aspects of surface layer
evolution under argon ion etching in GDOES. The GDOES technique relies on ion
bombardment of the specimen surface which removes material from the surface layer
by layer, on the atomic scale. During the surface layer evolution, the ion bombardment
can cause different surface micro-textures and preferential sputtering in individual
crystallites, which can cause degradation of depth resolution in GDOES depth profiling
(Chapter 3). On the other hand, the ion bombardment can induce a new morphology on
a surface with previously coated material of a low sputtering rate, for example the
pitting phenomenon (Chapter 4), which may have a potential application in the
Grimm source in GDOES is also a powerful etching tool. The eroded surface has little
damage in the underlying crystallites and so it can be used as a method for preparing a
surface for electron back-scattered diffraction (EBSD), which is a powerful method for
measuring crystallite orientation in microcrystalline materials. The etching method can
also be used to obtain a plan view o f internal oxides o f steels using scanning electron
microscopy (SEM) (Chapter 5). In Chapter 6, the study is focused on various issues
which impact upon hydrogen measurement in the glow discharge source o f the GDOES
instrument.
In GDOES depth profile analysis, the elemental intensities after a particular sputtering
time can be converted into an elemental concentration and sputtered depth. Therefore,
the best depth resolution would be obtained when the sample surface is eroded
layer-by-layer uniformly. However, the specimen is often eroded non-uniformly to a greater or
lesser degree. On a gross level, the depth resolution is affected by the shape of the
sputtered crater and roughness o f the bottom surface o f the crater (Quentmeier, 1997).
The best crater shape can be obtained by choosing optimum discharge conditions, i.e.
the voltage, the current and the argon pressure (Angeli et al., 1993; Quentmeier 1994
and Bengtson, 1996). The roughness o f the bottom surface is believed to be due to
differential sputtering of the sample material depending on size and orientation of the
crystal structures (Quentmeier, 1997 and Angeli, 1997). Until now there have been no
detailed reports in the literature o f the orientation effects on the sputtering rate in
GDOES. In this study, the effect o f crystal orientation on the sputtering rate o f different
crystals and the effect on depth resolution have been investigated for the first time in
detail (Chapter 3). Pure iron was chosen as the test specimen because of its
metallurgical significance and its moderate sputtering rate relative to other elements
commonly analysed in GDOES. With its high purity, the influence o f non-uniformly
distributed elements in the specimen on sputtering can also be eliminated. The
specimens were sputtered in the GDOES with a dc source for different sputtering times
under the condition o f optimal parameters for best sputtered crater shape. SEM was
of the selected 'micro' areas with typical surface textures were obtained by EBSD. The
sputtered depth corresponding to the selected areas were measured based on the
correlation between the SEM images and profiles of craters recorded by a profilometer.
Different sputtering rates between the [001] and [111] poles have been observed and
there is also a correlation between the eroded crystal surface textures and crystal
orientation. The results imply that samples with small grain size will have the best
possible depth resolution in GDOES.
Until now, all applications of GDOES have focused on chemical composition analysis
and depth profiling of materials. However, the Grimm source is also in itself a
powerful tool to ion-etch the surface. In Chapter 4, it is demonstrated that GDOES
etching can introduce novel surface phenomena on silicon wafers. Although the
analytical capability of the GDOES is not part of the etching process, it is required in
this particular study in order to estimate when a surface layer (which is crucial for the
pitting process that is being characterised) has been partially or completely removed.
By stopping the etching process at well-defined points during the removal of the surface
layer, the GDOES can be used to examine the effects of sudden changes in the
sputtering rate at surface layer interfaces. This study is therefore facilitated by the
GDOES’s analytical capability. It is known that surface topography can be developed
under extended high energetic ion bombardment from existence of small pits to a
characteristic shape (Carter et al., 1983). In the present work, a silicon surface with
carbon coating was eroded in the GDOES. Immediately after the carbon layer was
completely removed (as measured by the loss of the carbon signal in the analytical part
of the GDOES), uniformly distributed micron-size pits were left on the surface o f the
silicon. The mechanism of pit generation appears to be due to a large difference in the
sputtering rate between the coating and the substrate. The geometry o f the pits was
measured using atomic force microscopy (AFM), which further revealed the pit has a
In the first part o f Chapter 5, the results o f the EBSD patterns collected from the
surfaces o f the pure iron and the copper after GDOES etching have shown that a
high-power Grimm source, as generally employed in GDOES, is an excellent tool for
removing surface damage in iron specimens prior to study using EBSD. The technique
is extremely fast and can in principle be applied to any sample, without the use o f any
chemicals. The Grimm source itself is a simple system (e.g. as compared to an ion
beam thinner), and so could represent a very cheap and fast specimen preparation route.
GDOES was also used successfully in the investigation o f internal oxides in carburised
steels by the plan view o f the oxides in the revealed layer and the depth profiling in
GDOES. Most o f the prior studies on internal oxidation have utilised cross-sections of
the surface layers, either by SEM for a cross-sectional view o f oxides on the micron
scale, or by Transmission Electron Microscopy (TEM) to determine the type o f the
oxides (Mural et a l, 1997). However, these approaches cannot reveal a plan view of
morphology and distribution and a depth location o f the oxides. In the second part of
Chapter 5, the internal oxides o f the carburised steels were plan viewed in SEM after
GDOES etching down to a surface layer with known depth. The oxides revealed in
different layers showed different morphologies. Energy Dispersive Spectrometer (EDS)
mapping in SEM identified that the oxide elements were Si, Cr and Mn, which is in
agreement with the GDOES depth profiles for these elements.
Accumulation o f hydrogen atoms in steel causes hydrogen embrittlement, which shows
a loss in ductility and toughness of the steel. Hydrogen in metal can also produce
cracks under the influence of stress before use as well as in service applications o f the
steels (Timmins, 1997). However, detection o f hydrogen in steels often causes
problems due to its immobility and light atomic mass. Hydrogen detection is
impossible for most traditional surface analytical techniques (Lanford, 1982) and only a
few techniques can be employed to do a surface analysis for hydrogen (Marwick, 1991;
Tirira et al., 1996 and Payling, 1997f). GDOES is one o f the few analytical techniques
compared to others. With a relatively high sputtering rate, GDOES with a dc source
can carry out bulk and depth profiling analysis of metal samples with tens of microns of
depth, which makes it possible to use this method for hydrogen analysis of steels. Few
applications in hydrogen detection have been found both in surface and bulk analysis
(Alexandre et al., 1981). The reasons are probably the lack of standards for the
calibration of hydrogen and hydrogen contamination in the source that is inevitable in
GDOES operation. In view of this, a research programme was set up to test the
possibility of using GDOES for detection of hydrogen and to determine how sensitive
the technique could be to hydrogen, so as to establish whether or not this could be used
as, e.g., a routine test on steels or other metals that may suffer hydrogen attacks
(Chapter 6).
Hydrogen contamination in the GDOES source was first tested, with the results
showing that the hydrogen mainly came from water vapour deposited on the surfaces in
the glow discharge source and measured samples, from hydrocarbons backstreaming
into the chamber from the pumping system and from hydrogen contamination in the
argon gas. These are in agreement with the observation of Payling (1997a). A
minimum limit of the hydrogen intensity due to contaminants is hard to obtain as the
hydrogen signal decays exponentially with an increase in the sputtering time, even after
long etching times. However, after an appropriate 'warming up' period of the GDOES,
a so-called ‘hydrogen detection status’ can be obtained: a condition in which the
GDOES is optimally sensitive to the detection of hydrogen. In this status, different
levels of hydrogen in steels were differentiated. Furthermore, the experiments in this
chapter significantly revealed that differences in the intensities of the hydrogen
contamination in GDOES can result from different sample matrices in the hydrogen
detection status, even when the samples are believed to have no hydrogen. This
phenomenon is named as matrix effects on the intensity of hydrogen contamination in
GDOES in this study. It was followed by discussions in consideration of the relevant
ionisation and excitation processes in the glow discharge. Then some results of
hydrogen detection status has an ability to differentiate the hydrogen levels between
steels with and without hydrogen loading. The GDOES can also detect the hydrogen at
the interface between the coating and the substrate for electroplated samples.
On the other hand, hydrogen in the source can affect intensities of detected elements in
GDOES measurements and, consequently, the apparent concentrations (Hodoroaba et
al., 2000a and 2000b). In Chapter 6, a simple experiment was also set up to confirm the
hydrogen effect on the intensities and concentrations measured in the GDOES when
using a fixed voltage and current with a variation in Ar pressure. The operation was
without the addition of hydrogen by introducing a mixed gas. It was shown that the
hydrogen mainly comes from the water vapour that is inevitable in GDOES
measurements. The experimental results for two stainless steel standards indicated that,
for the elements in the standards, the hydrogen has negative effects on the level o f the
signal for most of the metal elements and positive effects for non-metal and
semiconductor elements, which could be due to the hydrogen in the plasma modifying
the energy distribution of the energetic particles. After the quantification procedure, the
effects on concentrations can be compensated to some degree by using the ratio values
of the elemental intensities to that of argon. However, the results of the relative
variations for Si, C, Cr and Mn show that the hydrogen effects on these elements should
not be ignored in a quantitative analysis in GDOES. This is especially true for the
analysis of layers a few microns thick, because the hydrogen contamination from the
water vapour could be very high during the first tens of seconds of sputtering time. As
a consequence of the hydrogen effect on intensities, the sputtered depth, which is
calculated based on the elemental intensities, will also be affected.
The last chapter includes the conclusions of this study. Some ideas for future work are
also presented concerning the subjects in this study. For example, experimental work
could be done to combine the effects of surface binding energy and crystal orientation
effects on the sputtering rate in GDOES in order to get a further understanding of
application o f GDOES to the investigation o f internal oxides o f carburised steels, a
combination o f SEM imaging and the argon ion etching o f the surface would give a 3-D
image o f the internal oxide. The plan view o f oxide regions o f relatively large size has
also provided the opportunity to determine the crystalline structure using EBSD pattern
Chapter 2 Background of GDOES
2.1 Introduction
Glow Discharge Optical Emission Spectroscopy (GDOES) is a chemical composition
analytical instrument for solid samples. Combining sputtering and atomic emission in a
Grimm source (Grimm, 1968), it provides a modem, extremely rapid technique for bulk
analysis and depth profiling of samples. The Grimm source can work in conditions o f
direct current (dc) and radio frequency (rf) glow discharge. GDOES with a dc source is
used in the analysis o f conductive samples, while an rf source is used for both
conductive and non-conductive samples. Light emitted by the glow discharge is
analysed by an optical spectrometer. With a wide range o f optical wavelength analysis
from llOnm to 800nm, GDOES can analyse almost all o f the elements in the periodic
table. Relative standard deviations (RSD) o f analytical precision are 0.1-1% for major
and minor analytes and detection limits are in the range 1-10 ppm for bulk analysis
(Bengtson, 1996). By employing the concept of emission yield, quantitative procedures
o f GDOES have been developed for sample analysis to produce characteristics showing
elemental concentrations against analysed depth. For surface depth profile analysis, the
analytical precision and the detection limit are very close to that for bulk analysis.
GDOES can analyse up to a depth of ~ 100 pm within a single bum for steel samples,
yet the minimum information in depth is in the scale o f a few nanometres. The depth
resolution of depth profiling in GDOES is believed to be about 15% o f analysed depth.
In recent decades, the technique has been successfully applied in routine tests and
investigations o f industrial surfaces of steels and alloys, thin films and hard coatings.
In this chapter, a general literature review on the GDOES technique is presented, which
includes a description o f the glow discharge source, the glow discharge process, the
and recent applications. The description focuses on GDOES instruments with dc
sources as most o f the studies in this thesis have been undertaken on this type o f
instrument.
Much o f the introduction described here is covered in the major single-proceedings text
edited by Payling et al. (1997). In what follows, the original literature is cited where
possible, although most o f the relevant chapters in Payling et a l (1997) would provide
the reader with a more thorough, and up-to-date analysis. Works published later than
1997 are cited in full.
2.2 Glow Discharge Source and GDOES Instruments
2.2.1 The Grimm source in GDOES
All experimental work described later in this study has been performed in a GDOES
which employs a standard Grimm glow discharge source. The Grimm source works on
the same principle as a typical laboratory glow discharge source but with a different
configuration. A typical laboratory glow discharge source, shown in Figure 2.1,
consists of two planar, parallel electrodes, one the cathode and the other the anode,
located inside a cylindrical glass vacuum tube filled with gas (e.g. argon) at low
pressure. A voltage is applied between the cathode and the anode. When the conditions
(gas pressure, voltage and current) are suitable and the discharge has ignited, the
cathode is fully covered by a dark space. It is followed by the brightest band, called the
negative glow, and a region of dark and bright bands, called the positive column, which
extends to the anode. When the anode is close to the cathode, the positive column
disappears and only the dark space and the negative glow remain between the cathode
and the anode. This is the fundamental structure o f glow discharge (Chapman, 1980).
The innovation o f the Grimm source is probably the most important development in the
and the positioning of the electrodes strongly influence the distribution o f the luminous
zones inside the tube (Bouchacourt and Schwoehrer, 1997):
• the positive column diminishes and then disappears when the anode is sufficiently
close to the cathode;
• the anode glow and the anode dark space also disappear and only the negative glow
and the cathode dark space remain when the anode penetrates into the negative
glow;
• the discharge ceases and no luminous phenomena are observed if the anode is
brought into the plane of the cathode dark space.
Vacuum System Gas Inlet
Anode
Cathode
Cathode Dark Negative Glow Positive Column Space
Figure 2.1. Schematic diagram of a typical laboratory glow discharge source.
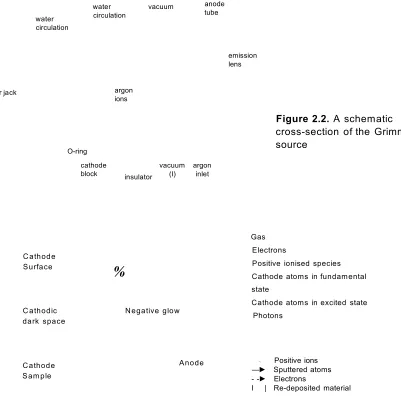
A schematic cross-section of the Grimm source is shown in Figure 2.2. In the Grimm
source, the anode is a hollow tube rather than the flat plate used with the laboratory
glow discharge tube, and a flat sample acts as the cathode. The distance between the
cathode and the anode is between 0.1 and 0.2 mm. The sample to be analysed is
mounted onto an O-ring seal, completing a chamber. The chamber is first evacuated,
then argon is bled continuously through the anode to maintain a low pressure (typically
300-1300 Pa). A voltage is then applied between the anode and the sample
(400-1200 V) (Payling, 1997a). Interaction between electrons and the argon atoms
causes positive ionisation of the argon. The argon ions are then driven by the negative
bias in the cathode dark space to impact the sample, causing erosion (sputtering) o f the
sample surface. These sputtered atoms move away from the surface of the sample and
are excited in the negative glow region through collisions with the electrons and
correspond to those of electrons in the atoms falling from a higher level to a lower level.
Hence, the emitted photons have the characteristic wavelength of the elements from
which they were emitted. These photons pass through the window of the source and
their energy is detected to analyse the materials being sputtered from the sample
surface. The processes of glow discharge, cathode sputtering and de-excitation with the
emission of light in the Grimm source are shown in Figure 2.3 (Bouchacourt and
Schwoehrer, 1997). During an analysis, most of the sputtered material is deposited on
the inside of the anode tube and the edge of the sputtered crater of the sample. After the
analysis, the deposited materials inside the tube must be removed by a high speed drill.
anode tube water
circulation vacuum water
circulation
emission lens
argon ions air jack
O-ring cathode
block insulator vacuum argon (I) inlet
Figure 2.2. A schematic cross-section of the Grimm source
Cathode Surface
Cathodic dark space
Cathode Sam ple
%
Negative glow
Anode
Gas Electrons
Positive ionised species Cathode atoms in fundamental state
Cathode atoms in excited state Photons
~ Positive ions —► Sputtered atoms - -► Electrons
I | Re-deposited material
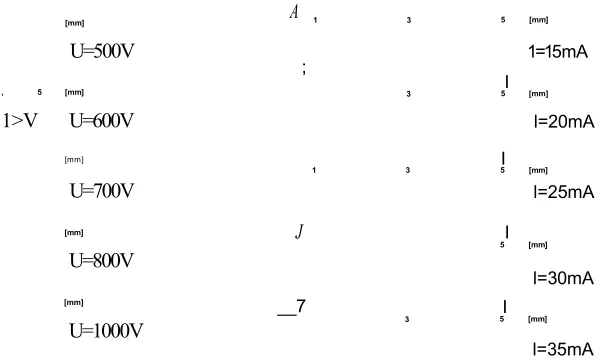
[image:20.612.89.490.250.661.2]2.2.2 Current-voltage-pressure characteristics of glow discharge source
The glow discharge process and hence the sputtering o f the cathode (sample) can becontrolled by three operating parameters: voltage, current and gas pressure from outside
of the source. In the abnormal glow region, the maintaining voltage Ug, i.e. the voltage
between the anode and the cathode, is given by Weston (1968) as
Ug * U ' +igRg , (2.1)
where U f is the turn-on potential; ig is the source current and Rg is the source resistance.
No current flows until Ug exceeds U f. Comparing the effects o f the gas pressure (Pg),
cathode area and distance between the anode and the cathode, Eqn. (2.1) can be
expressed in the GDOES system by (Payling, 1994 a and 1997a) as
Ak'ia
£ / * £ / ' + ---
8-r ,
(2
.2
)g nDmp \ K }
where A:'is a constant relating to the distance o f anode to cathode; a is a constant
between land 2; m and b are both approximately 2 and D is the inside diameter o f the
anode. Most o f the constants in the equation appear to be dependent on the sample
matrix. However, the three parameters, voltage, current and argon pressure, are not
independent o f each other. If two of the three parameters are kept constant, the third
one will find its own value depending on the cathode matrix. In theory, the source can
only work under the one o f three operating modes: with either current, voltage or argon
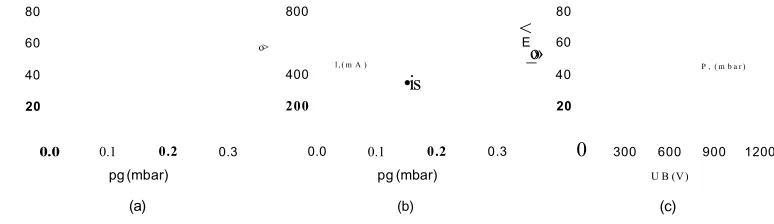
pressure as a variable. Figure 2.4 shows the current-voltage-pressure characteristics o f
the source operating with a steel sample. In practice, all o f the three operating modes
have been applied in GDOES measurements. For example, the mode of variable
current could be used in a bulk analysis because o f the rapid cleaning o f the sample
during a pre-bum which is required to remove surface contamination o f the sample
prior to analysis, and the mode o f variable argon pressure is becoming increasingly
important in quantitative analyses following improvements in quantitative theories of
GDOES. Which mode is optimal will depend on the application and samples to be
120 1200 120
1000 100
100
800 80
<E 60 80
<E 60
o> _o»
l , ( m A ) P , ( m b a r )
400 40
40 •is
200 20
20
0.0 0.2 300 600 900 1200
0.1 0.2 0.3 0.1 0.3 0
0.0
pg (mbar)
(a)
pg (mbar) (b)
U B (V)
(c)
Figure 2.4. The current-voltage-pressure characteristics of the Grimm source in GDOES using steel as the cathode sample (Payling, 1994).
2.2.3 Instrumentation of GDOES
Figure 2.5 shows a schematic layout of the GDOES instrument used in the work
presented in this thesis (Leco Corporation, 1992). The emitted photons pass through the
window of the source, which is capable of transmitting photons in the wavelength range
of 110-800 nm, and then into the optical spectrometer through an entrance slit. The
photons with different characteristic wavelengths (and hence energy) are converted into
intensity signals by the photomultiplier tubes in the spectrometer. The intensity signals
for the elements to be analysed can be converted into elemental concentrations of the
sample (for bulk analysis), or into the elemental concentrations as the function of
sputtered depth (for depth profiling analysis), based on GDOES bulk or depth profiling
calibration procedure using certified reference samples with known compositions and
sputtering rates.
PHOTOMULTIPLIER
GLOW DISCHARGE SOURCE
Figure 2.5. Schematic layout of the GDOES instrument used in this study.
[image:22.612.100.487.49.161.2]There are two kinds o f spectrometer. The first is a polychromator, with many fixed
channels. It can record many elemental signals simultaneously. Another is a
monochromator. It has only one channel but is tuneable over a wide wavelength range.
The GDOES (Leco GDS 750), which was employed in this study, is equipped with a
polychromator which is able to detect 44 individual elements and can analyse 24
elements in a single measurement.
2.3 Glow Discharge in GDOES
2.3.1 Structure of the glow discharge
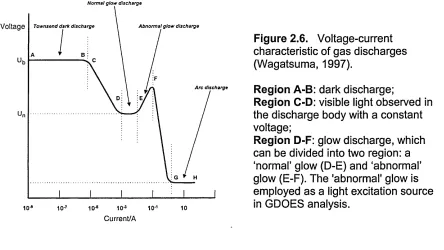
Discharge is a breakdown phenomenon in a conducting ionised gas. In a
voltage-current characteristic o f gas discharges, as shown in Figure 2.6 (Wagatsuma, 1997),
when the voltage increases to Ub, called the breakdown voltage, the discharge current
increases rapidly and a dark discharge (region A-B) is produced. Gas discharge is a
self-sustaining process. Initially electrons accelerate and collide with gas particles
causing ionisation o f the gas. The resultant charged particles can also contribute to the
ionisation collision. When the discharge current is increased further, the voltage
decreases and reaches a constant value U„ (the region C-D). In such discharges, a zone
with visible light in the discharge body can be observed. Glow discharge corresponds
to the region D-F, created at reduced pressures o f several hundred Pa and discharge
voltages o f a few hundred volts, with characteristic ‘glow ’, i.e. blue luminance in the
case o f argon as the carrier gas. The glow discharge can be divided into two regions,
i.e. ‘normal’ glow (D-E) and ‘abnormal’ glow (E-F). The 'normal' glow discharge has
the characteristic that the voltage remains constant as the current is changed by several
orders o f magnitude (e.g. from 10'4 to 10'2 A). Under these conditions, the current
density at the cathode remains constant, while the area o f the cathode covered by the
glow expands proportionally with the current. When the cathode is fully covered, an
larger cathode emission is required, and this again increases the cathode fall and the
potential. The region with the positive characteristic, i.e. where the voltage increases as
the current increases, is that o f the 'abnormal' glow discharge. In analytical application
of GDOES, it is the ‘abnormal’ glow discharge which is employed as a light excitation
source (Boumans, 1972).
Normal glow discharge
Voltage Townsend dark discharge Abnormal glow discharge
Arc discharge
[image:24.612.76.520.162.412.2]10'1 10
Figure 2.6. Voltage-current characteristic of gas discharges (Wagatsuma, 1997).
Region A-B: dark discharge;
Region C-D: visible light observed in the discharge body with a constant voltage;
Region D-F: glow discharge, which can be divided into two region: a ‘normal’ glow (D-E) and ‘abnormal’ glow (E-F). The 'abnormal' glow is employed as a light excitation source in GDOES analysis.
Current/A
The glow discharge process depends on carrier gas, gas pressure, voltage, current,
geometry and electrodes. In particular, the discharge structure may alter depending on
the distance between the anode and the cathode. As the space between the electrodes is
reduced, the positive column shrinks. When the space is reduced further (the space is
just a few times the cathode dark space thickness and the minimum separation is about
twice the dark space thickness), the positive column and the Faraday dark space finally
disappear whilst leaving the cathode dark space and negative glow unaffected. Such a
glow discharge is called the ‘obstructed’ glow, as described by Chapman (1980) and
shown as Figure 2.7(a). This structure o f glow discharge is a fundamental structure
model o f glow discharge, and is just the basic model in the Grimm source in GDOES.
As can been seen in Figure 2.7(b), Up is the plasma potential, which means that the
electrodes (the anode is grounded), there is an electric field produced in the cathode
dark space, called cathode fall, the potential difference being close to Ug.
Glow Region
Anode Dark Space Cathode Dark Space
Anode Cathode
(b) U,p 0 (ground)
D istance
Figure 2.7. (a) The ‘obstructed’ glow, which is a fundamental structure model of glow discharges and is the basic model in the Grimm source in GDOES. (b) The plasma potential in this model (Chapman, 1980).
2.3.2 Collision processes and behaviour of electrons in the plasma
2.3.2.1 Collision processes
Collision processes in the plasma have been reviewed by Chapman (1980) and Bogaerts
and Gijbels (1997), which include the most relevant processes in analytical glow
discharges, i.e. ionisation (and recombination) and excitation (and de-excitation), and
the plasma species playing a role in these processes: electrons, argon atoms, singly
charged positive argon ions, argon atoms excited to a variety of energy levels including
metastable levels, and atoms and ions of the cathode material. However, the collision
processes are much more complicated, for example the collision processes may involve
multiple-charged particles, clusters and negative ions, and probably not all processes are
known and understood. Some of the collision processes are believed to play a dominant
Electron impact ionisation of argon atoms is one o f the most important and
best-known processes in the glow discharge, simply expressed as
Ar° +e~ —> A r+ + 2e~ , (2.3)
where Ar° and A r+ are argon atoms in the ground state and argon ions with a single
charge respectively. This collision is the essential process for the plasma being
self-sustaining as it produces an extra electron which can ionise other argon atoms. The
collision can have two effects: one is the ionisation o f argon atoms from the ground
level, which needs a minimum energy o f 15.76 eV; the other is excitation to the
metastable levels at 11.55 eV or 11.72 eV.
The metastable levels o f an argon atom are created when energetic particles collide with
it. Electron impact excitation of argon atoms is expressed as
Ar° + e~ —» Ar* + e~ , (2.4)
where Ar* is the argon atom in the metastable levels. The minimum energy transferred
is 11.55 eV, which is less than the ionisation energy o f an argon atom (15.76 eV).
Therefore, the energy level is not high enough to eject an electron from the atom but
can only excite the electron to a higher energy level within the atom. Sputtered atoms
also can be excited to metastable levels. But the metastable argon atom has a longer
life-time before it returns to the ground state than the metastable sputtered atoms.
In addition to processes involving argon atoms there are processes involving the analyte
(sputtered) atoms. Electron impact ionisation and excitation of sputtered atoms are
another two important processes in the glow discharge
M ° + e ~ - > M + +2e~ , (2.5)
M ° +e~ - + M * +e~ , (2.6)
where M° , M + and M* represent sputtered atoms in the ground, a single positive
charged and excited states, respectively. The mechanisms of these two processes are
depend on the average temperature, density of electrons and cross-section of the
excitation. However, since the cross-section curve as a function of the electron energy
is of comparable shape and magnitude for all elements, the ionisation and excitation
processes are considered as rather unselective. Electron impact ionisation of sputtered
atoms can also produce an extra electron for the plasma being self-sustaining. Electron
impact excitation of sputtered atoms is one of the two excitation processes for sputtered
atoms (the other is metastable argon atom impact excitation of a sputtered atom). Any
excitation of the sputtered atom will directly affect its light emission and, hence, the
intensity of the element recorded in GDOES analysis.
Metastable argon atom impact excitation of sputtered atoms is of the form
M ° + Ar*n -> M* + Ar° . (2.7)
In the glow discharge in GDOES, the metastable argon atoms can also excite the atoms
in the source to produce emitted photons.
Penning ionisation involves a process such that
M ° + Ar* —> M + + Ar° + e~ , (2.8)
where Ar* is the argon atom in the metastable state with energy 11.55 eV or 11.72 eV.
Since most of the atoms of the periodic table have an ionisation potential lower than this
value, then sputtered atoms can be ionised by collision with argon metastable atoms.
Penning ionisation is another important process which results in the production of
charged particles. These charged particles can again contribute to ionisation collisions
for the self-sustained discharge. Elements that cannot be ionised by Penning ionisation
in argon include H, N, O, F, Cl and Br.
2.3.2.2 Behaviour of electrons in the glow discharge
Electrons in the glow discharge in GDOES have been classified into at least three
groups (Wagatsuma, 1997), i.e. the y-electron, secondary electron and slow electron.
ions impact the surface. Their energy is the highest among the electrons in the three
groups. After the glow discharge has built up, the y-electrons are the primary electrons,
maintaining the glow discharge to be self-sustaining by collisions with argon and
sputtered atoms in order to produce extra electrons which can contribute to the
ionisation processes. The secondary electrons are produced from the ionisation
processes o f argon and sputtered atoms and collide with the argon and sputtered atoms
in the plasma to cause the excitation o f the atoms. The slow electrons, which are
trapped by the plasma potential because o f their low kinetic energies, are the largest part
of the glow electrons. Electron temperature in the plasma is determined mainly by this
group o f electrons and is in the range o f a few eYs down to 0.1 eV. On the other hand,
the electrons are also lost mainly through electron-ion recombination. In fact, the glow
discharge is self-sustaining in a balance of the production and reduction o f electrons.
The energetic electrons also provide the only mechanism which enables energy
coupling from the external power supply to the bulk plasma. The energy in the plasma
is lost mainly through heating o f the electrodes by energetic particles. In view o f the
balance o f energy in the glow discharge, the lost energy must be compensated for
through the energetic electrons in order to obtain a steady state discharge.
2.3.3 Properties of particles in the glow discharge
The particles involved in GDOES include the electrons, the positive ions, the excited
atoms and the sputtered atoms. Fang and Marcus (1991) have investigated the
properties o f particles in the plasma using a single cylindrical Langmuir probe with a
computer-controlled voltage driving system. The glow discharge sputtering device has
a simple, diode-plane electrodes configuration. Different cathode matrices - copper,
copper-zinc alloys, molybdenum, nickel, titanium and stainless-steel were sputtered in
discharge conditions with constant current and argon pressure. The current and argon
pressure were 8 mA and 2.7 mbar, respectively, at which the glow discharge was
believed to be in the abnormal region. Axial distributions and the values o f electron
a particular sampling position have been investigated. In this sampling position, at
about 5.4 mm from the cathode, the plasma is quite luminous and the probe disturbs the
plasma least.
Particular areas o f interest lie within their experimental results about electron
temperature, average electron energy, and electron energy distribution due to the
relations to the discussion in Chapter 6 on hydrogen behaviours. Their experiments
showed that the electron temperature decreased as the current and the voltage increased
for the different cathode matrices, which was explained by the contribution o f electrons
produced by either Penning ionisation o f sputtered atoms or electron impact ionisation
o f sputtered and argon atoms in the negative glow region. The secondary electrons
produced by ionisation have quite low kinetic energy relative to the y-electrons that
have gained kinetic energy in the potential fall o f the cathode dark space. In the
abnormal glow region, the average electron energy increases with the current.
However, for the different samples, the average energy values converged to a relative
spread o f only ~10%. This spread was within the sample-to-sample deviations for the
analysis o f the same alloys, which means that the cathode matrices have little effect on
the average energy. The electron energy distribution functions for the different
cathodes in the constant-current operating mode were also very similar.
A combination o f different mathematical models for different plasma species in dc glow
discharge have been produced by Bogaerts and Gijbels (1997). The models were one
dimensional, i.e. the quantities vary only with distance from the electrodes. For a dc
glow discharge in argon with a copper cathode, at typical GDOES discharge conditions,
i.e. a gas pressure o f 500 Pa, a discharge voltage o f 800 V and an electrical current of
40 mA, some typical results o f the models were presented, such as density profiles of
the plasma species, the electric field and the potential distribution throughout the
discharge, different ionisation mechanisms in the plasma, energy distributions o f the
different plasma species and relative contribution to sputtering. The models are, in
intensities of different spectral lines if there are enough cross-sectional data for the
computer simulations, which are of interest for the glow discharge in GDOES.
In their further work, three-dimensional models for calculations of density profiles of
sputtered atoms and ions (Bogaerts et al., 1997a) and argon metastable atoms (Bogaerts
et al., 1997b) in a dc glow discharge have been established. The calculations, based on
the models, also included the profile of electrons, the current-voltage characteristics, the
flux energy distributions of positive ions, the profile of the sputtered crater on the
cathode and the argon atomic optical emission spectrum (Bogaerts and Gijbels, 1998;
Bogaerts et al., 2000 & 2001). The calculated results were compared with experimental
results obtained by laser-induced fluorescence spectroscopy (for the sputtered atoms,
the ions and the argon metastable atoms), and Langmuir probe and optical emission
spectrometry measurements (for the electrons). In general, satisfactory agreement has
been qualitatively reached for most of the particles except the argon metastable atoms.
Although exact quantitative agreement cannot be expected between the mathematical
calculations and the experimental data, however, the modelling gives a better insight
into the complex glow discharge as a complement to experimental plasma diagnostics.
2.4 Sputtering in GDOES
Most of the work described later in this study is related to sputtering of surfaces of
samples in GDOES. Sputtering is the ejection of target atoms following the impact of
energetic particles on the target surface. In GDOES, when the argon ions, driven by the
negative bias in the dark space, impact the surface of the cathode, sputtering occurs.
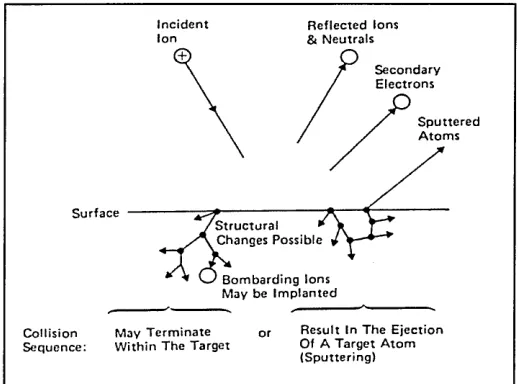
Figure 2.8 illustrates the interaction of an incident ion with a surface (Chapman, 1980).
Generally, when an incident ion impacts on a solid surface, one or all of the following
phenomena may occur:
• the ion may be reflected, probably in a neutralised state;
work they are called as the y-electrons);
• the incident ion may be implanted into the surface;
• the ion impact may be responsible for some structural rearrangements in the target
material;
• atoms may be ejected from the surface.
This ejection process of the atoms is known as sputtering. Most ejected atoms
(95-99%) are neutral, especially when the target material is a metal. It is these atoms
which are normally analysed in GDOES.
In c id e n t R e f le c te d Io n s
Io n & N e u tra ls
S e c o n d a ry E le c tr o n s
S p u tte r e d A to m s
S tr u c tu r a l *
C h a n g e s P o s s ib le
B o m b a rd in g Io n s M ay b e I m p la n te d
C o llisio n M ay T e r m in a te o r R e s u lt In T h e E je c tio n S e q u e n c e : W ith in T h e T a r g e t O f A T a r g e t A to m
[image:31.612.80.339.225.417.2]( S p u tte rin g )
Figure 2.8. A diagrammatic sketch of interaction of an incident ion with cathode surface (Chapman, 1980).
2.4.1 Sputtering models
Sputtering theory has been reviewed by Payling (1994b and 1997b). The simplest
model o f sputtering is based on single elastic collisions, which was developed by Stark
in 1909 (Payling, 1994b). In a simple binary collision the energy transferred from the
incident particle to the target particle is given by Chapman (1980) as
E, 4mm, 2 _ ^
= !- l t c o s2
e
, (2.9)E, («;,.+/»,)
where Et is the energy transferred to a target in a single collision; Ei is the energy o f an
incoming particle; /»,- and mt are the masses o f the incident and target particles,
mi and mt at the moment of collision. Therefore, for a head-on binary collision, Stark
determined a minimum threshold energy for sputtering, E0, given by
(2 J 0 ) 4 mjmt
where Us is the latent heat of sublimation, a measure of the energy required to break the
surface atomic bond. Us is typically 3-9 eV (Kaminsky, 1965), and for argon
mi = 40 amu, then m jm i varies from 0.1 to 5. So Eo in the Stark model typically varies
from 3 to 20 eV.
In fact, the sputtering process is much more complex than the binary collision model. A
single binary collision will only produce forward scattering of the target atom and not
back-scattering as required for sputtering. Thus, following the initial binary collision
between the incoming ion and the target atom, Langberg (1958) improved Eqn. (2.10)
by multiplying Eo with a factor L, which included the ejection of a near-neighbouring
atom,
i = 10(1.1 — + 0.2)(1 - — ln(l + 0.83N> ) ) '2 , (2.11)
n ad
where N is the number of bonds o f an atom in the lattice; n the number o f nearest
neighbours; a the Morse potential constant and d the closest-neighbour spacing. For
most elements, the average value of L = 16 ± 3 (2 SD). Calculated values for the
minimum threshold energy Eo in the Langberg model vary form 31 eV for lead up to
152 eV for aluminium, and are typically around 100 eV (Payling, 1997b).
Sigmund (1969) presented a more rigorous theory for ion beam sputtering. In the
Sigmund approach, a series of binary collisions occurs between the incident ion and the
atoms in the target, causing multiple scattering of target atoms, and subsequent ejection
of a neighbouring atom(s). Furthermore, Sigmund classified sputtering qualitatively by
three regimes: single-knock-on regime, linear cascade regime and spike regime, as
illustrated in Figure 2.9. In the single-knock-on, the atoms may be ejected from the
forces of the surface. In the linear cascade and spike regimes, the recoil atoms get the
energies from the impact ions, which are enough to produce secondary and higher-
generation recoils. Some of them may overcome the surface barrier and be ejected from
the target surface. The difference between the linear cascade and the spike regimes is
that the spatial density of moving atoms in a linear cascade is small but in the spike it is
large.
(b)
(a)
(c)
Figure 2.9. Three regimes of sputtering classified by Sigmund (1981): (a) Single-knockon regime.
(b) Linear cascade regime. (c) Spike regime.
2.4.2 Sputtering yield and sputtering rate
The sputtering yield S is defined as the number of sputtered atoms per incident ion, and
the sputtering rate q is defined as the sputtered mass per second (pg sec'1). For
sputtering in the Grimm source of a GDOES system, the ion current is related to the
total current by
i+ ~ ~~~ ? (2.12)
l + y
where ig is the glow discharge current (A); y is the secondary electron yield (i.e. the
number of extra electrons produced per incident ion). Then the sputter yield and the
where, mt is the atomic mass o f the sputtered atom; e the electronic charge (C); and Na
the Avogadro number (mole'1). In most cases, y = 0.14 ± 0.11 (2SD), so that (1 + y)
varies by only about ±10% for most elements and is often ignored (Payling, 1997b).
In the Langberg model o f sputtering, sputter yield is quadratic at energies near Eo and
linear at higher energies. For energies E » Eo and normal incidence, the sputter yield
was given as (Payling, 1997b)
S = b ( E - E 0) , (2.14)
where b is a constant and E the incident energy. Therefore, the sputter yield, in the
Langberg theory, is related to the energy above the minimum threshold energy.
The sputtering yield was given, in the Sigmund theory as (Payling, 1997b),
3
An m, U c
where a(mt/mi) is an energy-independent function and varies form ~0.1 to >2 depending
on the ratio m/mi', Sn(E) is the nuclear stopping cross-section and Us is the binding
energy o f the target material. For incident energies below about 1 keV, which are the
energies o f interest in GDOES, but well above the threshold;
Sn( E ) = , 4 mimt/ \ 2 E (2.16)
(m{ + m t)‘
Therefore, in the Sigmund theory, the sputtering yield is proportional to incident energy
rather than to the energy minus threshold value.
In the non-linear regime, experimental work showed that sputtering yields changed in a
complex way with incident ion energy. In the range 50-150 eV, the sputtering yield is
roughly quadratic with energy. In the range 150-250 eV, the sputtering yield is
approximately linear with energy, and above 250 eV, it begins to bend over and
eventually reaches a saturation level and then falls at much higher energies (Payling,
energy as was originally envisaged. Matsunami et al. (1980) altered Sigmund’s
expression of the sputtering yield by considering the different dependence o f sputtering
yield on incident energy and gave the sputtering yield which could apply to both the
near-threshold and linear regions by
S = S slgm, a - ( E j E ) ) ' /2 (2.17)
They also found it necessary to include higher order terms in their equations and
derived a sputtering yield equation as
5 = 0 . 0 4 2 a * ( ^ ) 7 ^ [ l - ( £ '0/£ '),,2f , (2.18) m, U s
where N « 2.8 (Payling, 1994b), and for argon ions in GDOES
( \*A
a « 0.257
and
\ mu (2.19)
5 „(£ )~ 4 .7 8 5 4w.-m' E 'n (2.20)
\m i + m t )
In the context of GDOES, the most important investigation of the sputtering yield and
sputtering rate could be the work produced by Boumans (1972), which introduced a
simple and well-known empirical relationship between the sputtering rate and the glow
discharge current and voltage in the Grimm source of the GDOES system:
q = CQig{Ug - U o ), (2.21)
where C q is the reduced sputtering constant (pg w att'1 sec'1); ig the discharge current; Ug
the operating voltage; and Uo the threshold voltage for cathode sputtering. C q and Uo
depend on the cathode material and the plasma gas but are independent of the current,
the voltage and the gas pressure. The Boumans equation now forms an essential part in
the understanding, calibration, bulk analysis and depth profiling o f GDOES. In his
work, the experimental results of some pure metals and binary alloys showed that a
linear relationship between the mass sputtered in unit time per unit of current strength
reduced sputtering constant Cq (i.e. slope of the linear relationship) for some pure
[image:36.612.98.438.122.329.2]metals and alloys is listed in Table 2.1.
Table 2.1. Results o f sputtering measurements fo r metals in the Grimm glow
discharge with argon as a carrier gas (Boumans, 1972).
Target Cq (pg W '1 sec'1) Uo (V) ig (mA)
Al 0.084 340 213-320
Cu 0.84 360 24-260
Mo 0.39 300 48-213
Ni 0.36 360 48-260
Ta 0.81 320 108-213
W 0.79 320 108-213
Zn 1.64 330 24-72
Brass 1.08 340 24-213
Cu-Ni 0.58 365 24-108
Cr-Ni-Steel 0.24 520 48-108
This linear relationship was confirmed in the experimental work by Bengtson (1985) by
measurements of the sputtering rates with different materials. The results are listed in
Table 2.2. Comparing the results o f Uo in Tables 2.1 and 2.2, the threshold voltages Uo
obtained by Bengtson were generally lower than those of Boumans. This was believed
to be due to slight differences in the geometry of the individual source.
Table 2.2. Experimental data o f C q and Uo o f some pure materials and alloys (Bengston, 1985).
Target CQ (pg W '1 sec'1) Uo (V)
Al 0.099 340
Fe 0.25 330
Cu 0.81 290
CuNi10 0.75 300
CuZn30 0.90 285
CuZnNi25/10 0.80 290
Sn 1.70 240
Zn 0.81 180
Payling and Jones (1993) measured the sputtering rates of zinc-iron and zinc-aluminium
alloys and concluded that, for pure elemental solids, Uo varies from 220 V for
chromium to 340 V for aluminium, and averages 308 ± 66V (2 SD) for 25 published
values of metals and alloys. Payling (1994a) also calculated the turn-on voltage U ' by
multiple linear regression of the data from steel, copper and aluminium standards. The
estimated values of U ' vary from 205 V to 265 V, i.e. a range of 235 ± 30 V. He
suggested that the threshold voltage Uo in the Boumans equation is thus a sum of the
turn-on voltage U ' and a minimum voltage above U ' for sputtering. As £ /'« 235 V and
the average of Uo is 308 V, this suggests that the minimum voltage for sputtering is
~73 V. From the equation of the incident ion energy related to voltage in GDOES
(Payling, 1994a), which was obtained by regression of the experimental data by Suzuki
(1988)
where k and U'are both constant with k = 0.5. The minimum sputtering voltage ~73 V
corresponds to ~37 eV of incident energy, which is sufficient to break atomic bonds at
the target surface and cause sputtering.
Equation (2.21) was also confirmed by Payling (1994b) by measurements of the
sputtering rates with copper alloys. The review and the experimental data in (Payling,
1994b) suggested that the argon gas pressures in the source have no effect on the
sputtering rate. It was also noted that in the experiments (Boumans, 1972) the
sputtering time was kept constant, which would then result in different sputtered depths
for different matrices. By keeping the sputtered depth constant, rather than the
sputtering time, the experimental data in (Payling, 1994b) indicated that the sputtering
rate is still proportional to the current ig, but no longer to the Ug when the sputtered
depth is in a range of 5-10 pm. Based on the non-linear dependence of sputtering with
the operating voltage in the glow discharge, which was presented by Yamamura et al.
(1983), Payling (1994b) altered the Boumans equation (2.21) as follows
E = k(U g - U ') , (2.22)
where Uo and n are constants, which were obtained by fitting the experimental data
from copper alloys, stainless steels, nickel and the Boumans data to Eqn. (2.23). These
values are listed in Table 2.3 and show a mean value for Uo of 396 V, and n of 0.74.
Table 2.3. Results o f fitting data to Eqn. (2.23) (Payling, 1994b).
Matrix Data points Uo (V) n R*
Copper alloy (/g40mA) 8 399 0.75 ±0.02 0.9990
Copper alloy (/g60mA) 8 397 0.73 ± 0.02 0.9994
Stainless 9 364 0.74 ±0.01 0.99992
Nickel 7 424 0.74 ± 0.04 0.998
Mean 396 ± 49 0.74 ±0.02
Zinc(Boumans) 5 373 0.72 ±0.01 0.99995
The experimental data (Payling, 1994b) showed that the sputtering rate increased with
sputtered depth in GDOES. Mechanisms for the changes with depth were explained by: <