DEVELOPMENT AND VALIDATION OF SPECTROPHOTOMETRIC
METHOD FOR ESTIMATION OF MEBENDAZOLE IN BULK AND
PHARMACEUTICAL FORMULATION
Durgesh Rameshlal Parakh1*, Moreshwar P. Patil1, Sandeep S. Sonawane2, Chetan P. Jain3
1Department of Pharmaceutics, MET’s Institute of Pharmacy, Bhujbal Knowledge City,
Adgaon, Nashik-422003, India.
2Department of Analysis, MET’s Institute of Pharmacy, Bhujbal Knowledge City, Adgaon,
Nashik-422003, India. 3
Department of Quality Assurance Techniques, M. G. V’s Pharmacy College, Panchavati, Nashik-422003, India.
ABSTRACT
A new simple and sensitive spectrophotometric method in UV region has been developed for the determination of Mebendazole in bulk and in pharmaceutical formulations. Mebendazole exhibits absorption maxima at 234 nm. The method obeys the Beer’s law in the concentration range of 1-10 µg/mL. The method is accurate, precise and economical. The percent recovery is near to 100%. This shows that the method was free from the interference of excipients. The results of validation study were analyzed with respect to accuracy, limit of detection, linearity, limit of quantification, precision, ruggedness, robustness and specificity were found to be satisfactory. The proposed method has been applied successfully of drug in bulk and pharmaceutical formulation.
KEYWORDS: Mebendazole, Anthelmintic, UV-Visible spectroscopy, Validation, Recovery.
INTRODUCTION
Mebendazole is broad spectrum anthelmintic agents against nematodes infections including whipworm (Trichuris trichura), threadworm (Enterobius vermicularis), roundworm (Ascaris lubricoides), hookworm (Ancylostoma duodenale, Necator americanus),
Volume 4, Issue 7, 2223-2235. Research Article ISSN 2277– 7105
*Correspondence for
Author
Durgesh Rameshlal
Parakh
Department of
Pharmaceutics, MET’s
Institute of Pharmacy,
Bhujbal Knowledge City,
Adgaon, Nashik. 422 003
(M.S) India.
Phone: +91(7588710318)
ORCID ID:
0000-0002-4015-5176 Article Received on 15 May 2015,
etc. It is BCS class II drug having low aqueous solubility (71.3 mg/L) and High permeability (Log P = 2.8) ultimately leads to variable absorption of mebendazole. It undergo extensive hepatic first pass metabolism. It has very low bioavailability (5-10%) and maximum amount of drug is protein bound (90-95%).
Analysis of the drug is the most important aspect of formulation development. A suitable method is essential for the estimation of bulk drug, of the drug in formulation, in dissolution studies and in biological samples. Chemically Mebendazole is methyl (5-benzoyl-1H-benzimidazol-2yl) carbamate. It is white to slightly yellow, amorphous powder, almost odourless. It is practically insoluble in water, alcohol, methylene chloride, ether, chloroform and in dilute mineral acids whereas freely soluble in formic acids. It irreversibly block glucose uptake in susceptible helminthes, thereby depleting glycogen stored in parasites. It is official in Chin., Eur., Int., US, British, Indian, and Viet. pharmacopoeia. It is available as chewable tablet, suspension and sachets in market. It is given as 100 mg twice daily for 3 consecutive days. Repeated after 2-3 weeks if needed (to kill ova developed later). There are many reported methods for analysis of Mebendazole either alone or in combination with other drugs in pharmaceutical dosage forms or individually in biological fluids. The quantification of Mebendazole in human plasma by LC-MS has been reported. The
estimation of Mebendazole in bulk and in tablet dosage form was done by UV and RP-HPLC method in alone or combination with forced degradation studies. There is a need for a simple, rapid, cost effective and reproducible method for development of Mebendazole. Therefore objective of the study was to develop a simple, accurate, precise, cost effective and reproducible UV-Visible method for estimation of mebendazole as per International Conference on Harmonization (ICH) guidelines Q2(R1).
INSTRUMENT AND MATERIALS Instrument
Materials
Mebendazole was gifted from Holden Pharmaceuticals (Sinnar, Nashik). Methanol was purchased from Merck (Mumbai). Aerosil 200 was purchased from Research lab fine chem Industries (Mumbai). Other Solvents were purchased from Fischer scientific co. (India). All the other chemicals and reagents used were of analytical grade.
EXPERIMENTAL Method Development Solvent Selection
Various solvents like water, methanol, 0.1 M Hydrochloric acid, chloroform, acetonitrile were selected for the solubility and stability study and it was found that Mebendazole was soluble in the following solvents; formic acid, N, N-dimethyl formamide, 0.5 M Methanolic Hydrochloride, etc. In the present investigation 0.5 M methanolic hydrochloride was selected as a solvent.
Preparation of standard solution
Standard stock solution was prepared by dissolving accurately weighed 10 mg of mebendazole in 50 mL of solvent (0.5 M Methanolic Hydrochloride). Keep it on sonicator bath for 15 min. After 15 minutes, the volume was made up to the mark with 100 mL
volumetric flask with same solvent to give a solution of 100 g/mL.
Selection of analytical wavelength
The standard solution of Mebendazole was scanned in the wavelength range of 200-400 nm. The absorption spectra obtained was showing the wavelength at different value for different solvent.
Selection of analytical concentration range and preparation of calibration curves
Analysis of formulation
Weight equivalent to 10 mg was weighed accurately. Transferred it to 100 mL volumetric flask, dissolved in 50 mL of 0.5 M Methanolic Hydrochloride by ultrasonication of the flask for 15 minutes and volume was made up to the mark with respective solvent. The solution was filtered through 0.45 μ filter. An aliquot of sample stock solution was transferred to 10
mL volumetric flask and volume was made up to mark with same solvent.
Validation
Linearity and range
The linearity of an analytical procedure is its ability (within a given range) to obtain test results which are directly proportional to the concentration (amount) of analyte in the sample. The range of an analytical procedure is the interval between the upper and lower concentration (amounts) of analyte in the sample (including these concentrations) for which it has been demonstrated that the analytical procedure has a suitable level of precision, accuracy and linearity.
The linearity of the analytical method was demonstrated over the concentration range of 1-10 µg/mL of the target concentration for both the drugs. Aliquots of 0.1, 0.2, 0.3, 0.4, ……, 1
mL were pipetted out from working standard solution into series of 10 mL volumetric flasks. The volume was made up to the mark with 0.5 M Methanolic Hydrochloride.
Limit of Detection (LOD)
The detection limit is the lowest amount of analyte in a sample which can be detected but not quantitated.
Where,
σ = Standard deviation
S = Slope
Limit of Quantification (LOQ)
The quantitation limit is the lowest amount of analyte in a sample which can be quantitatively determined.
LOD = 3.3 σ/S
Accuracy
The value which is accepted either as a conventional true value or an accepted reference value and the value found. This is sometimes termed trueness. Accuracy of proposed method was ascertained on the basis of recovery study. Recovery studies were carried out by spiking standard working solution to preanalyzed sample solution (formulation) at three different levels 80 %, 100 % and 120%. Final concentrations of mebendazole was determined. At each levels of the amount, three determinations were performed.
Precision
The precision of an analytical procedure expresses the closeness of agreement (degree of scatter) between a series of measurements obtained from multiple sampling of the same homogeneous sample under the prescribed conditions. Precision may be considered at three levels: repeatability, intermediate precision and reproducibility. It was ascertained by replicate estimation of samples. It involves intra-day and inter-day precision. For this three replicate of 4.8, 6, 7.2 µg/mL of mebendazole solution were prepared and analysis carried out three times on the same day and different day at each concentration levels. The precision of an analytical procedure is usually expressed as the variance, standard deviation or coefficient of variation of a series of measurements.
Ruggedness
The ruggedness is degree of reproducibility of test results under verify of condition like
different analysts, different instruments and different days.
To establish ruggedness of the proposed method the solutions of 6 µg/mL of mebendazole standard solution was prepared and analyzed with the change in the different analyst.
Robustness
The robustness of an analytical procedure is a measure of its capacity to remain unaffected by small, but deliberate variations in method parameters and provides an indication of its reliability during normal usage.
Specificity
Specificity is the ability to assess unequivocally the analyte in the presence of components which may be expected to be present. Typically these might include impurities, degradants, matrix, etc.
Specificity was done by using an excipient, aerosil 200 (adsorbent). The three different concentrations at three levels 80 %, 100 %, 120 % respectively are spiked in standard mebendazole solution (6 µg/mL). At each levels of the amount, three determinations were performed to check effect of Aerosil 200.
RESULTS AND DISCUSSION Selection of Analytical Wavelength
[image:6.595.73.525.339.660.2]The standard solution of mebendazole scanned showing the wavelength at different value for 0.5 M Methanolic Hydrochloride as shown below.
Fig. 1 UV spectrum of drug in 0.5 M methanolic hydrochloride (λmax= 234 nm)
The above spectrum of mebendazole in 0.5 M methanolic hydrochloride showed maximum absorption at 234 nm, which is complying with reported λmax. Hence, it was selected as λmax
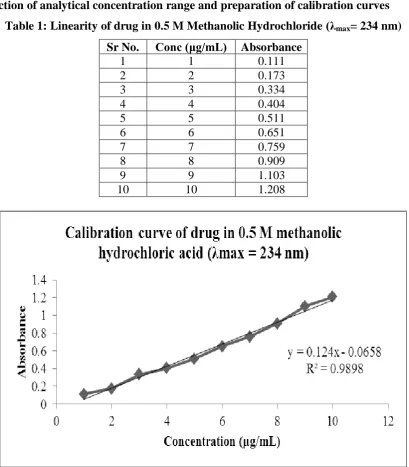
Selection of analytical concentration range and preparation of calibration curves Table 1: Linearity of drug in 0.5 M Methanolic Hydrochloride (λmax= 234 nm)
Sr No. Conc (μg/mL) Absorbance
1 1 0.111
2 2 0.173
3 3 0.334
4 4 0.404
5 5 0.511
6 6 0.651
7 7 0.759
8 8 0.909
9 9 1.103
10 10 1.208
Fig. 2 Calibration curve of drug in 0.5 M Methanolic Hydrochloride (λmax = 234 nm)
Validation
The Validation of drug was performed in 0.5 M Methanolic Hydrochloride depending upon good solubility, stability of wavelength and correlation coefficient.
Linearity and range
Limit of Detection (LOD)
The limits of detection (LOD) which represents the sensitivity of the proposed method were determined. The LOD value obtained was 0.1714 μg/mL, which indicates the high sensitivity of the proposed method.
Limit of Quantitation (LOQ)
The limits of quantitation (LOQ) which represents the sensitivity of the proposed method were determined. The LOQ value obtained was 0.5194 μg/mL, which indicates the high
sensitivity of the proposed method.
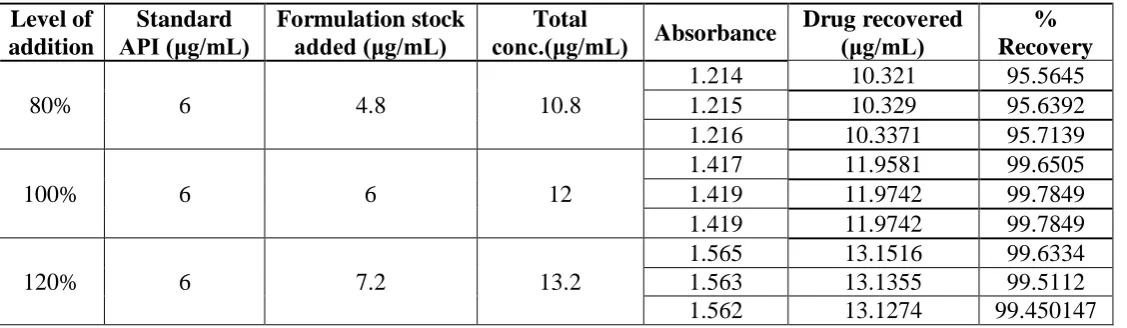
Accuracy
[image:8.595.20.584.402.566.2]The accuracy of method was ascertained by performing recovery study at three concentration levels i.e. 80%, 100% and 120%. The percent recovery obtained indicates non-interference from the excipients used in the formulation. The results of recovery study are given in Table 2 and Table 3.
Table 2: Recovery study of mebendazole Level of
addition
Standard API (μg/mL)
Formulation stock added (μg/mL)
Total
conc.(μg/mL) Absorbance
Drug recovered (μg/mL)
% Recovery
80% 6 4.8 10.8
1.214 10.321 95.5645
1.215 10.329 95.6392
1.216 10.3371 95.7139
100% 6 6 12
1.417 11.9581 99.6505
1.419 11.9742 99.7849
1.419 11.9742 99.7849
120% 6 7.2 13.2
1.565 13.1516 99.6334
1.563 13.1355 99.5112
1.562 13.1274 99.450147
Table 3: Statistical Validation of Recovery Studies Level of addition %Recovery (mean ± SD)* % RSD SE
80% 95.6392 ± 0.001 0.0823 0.00058
100% 99.7401 ± 0.00115 0.08141 0.00067 120% 99.5316 ± 0.00153 0.09771 0.00088 *(n=3)
Precision
respectively. Whereas, standard error were found in the range of 0.00058-0.00153 for both. Results of precision study are summarized in Table 4 and Table 5.
Table 4: Intra-day precision study
Conc. (μg/mL) Absorbance (mean ± SD)* SD %RSD SE
4.8 0.507 0.001 0.19724 0.00058
6 0.6507 0.00153 0.23475 0.00088
7.2 0.79 0.00265 0.33491 0.00153
*(n=3)
Table 5: Inter-day precision study
Conc. (μg/mL) Absorbace (mean ± SD)* SD %RSD SE
4.8 0.503 0.001 0.1988 0.00058
6 0.6477 0.0021 0.3214 0.0012
7.2 0.786 0.0026 0.3366 0.00153
*(n=3)
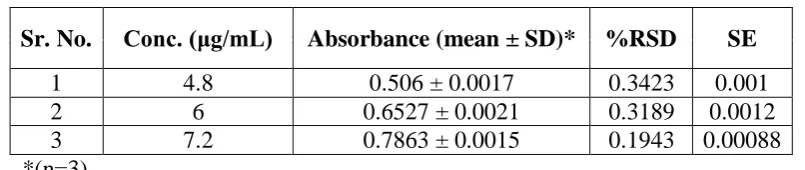
Ruggedness
[image:9.595.97.500.504.589.2]In the ruggedness study, the influence of small, deliberate variations of the analytical parameters on absorbance of drug was examined. The factor selected was change in analyst. Results of ruggedness study indicate that the selected factor remained unaffected by small variations with % RSD of 0.1943-0.3423, which confirms the ruggedness of method. Results are shown in Table 6.
Table 6: Ruggedness data for mebendazole
Sr. No. Conc. (μg/mL) Absorbance (mean ± SD)* %RSD SE
1 4.8 0.506 ± 0.0017 0.3423 0.001
2 6 0.6527 ± 0.0021 0.3189 0.0012
3 7.2 0.7863 ± 0.0015 0.1943 0.00088
*(n=3)
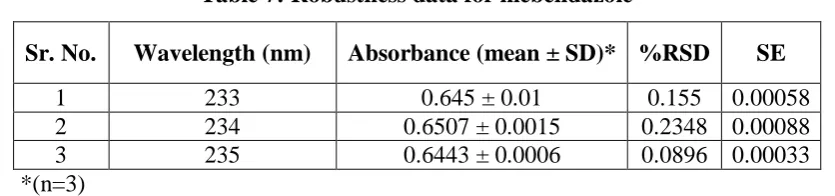
Robustness
Table 7: Robustness data for mebendazole
Sr. No. Wavelength (nm) Absorbance (mean ± SD)* %RSD SE
1 233 0.645 ± 0.01 0.155 0.00058
2 234 0.6507 ± 0.0015 0.2348 0.00088
3 235 0.6443 ± 0.0006 0.0896 0.00033
*(n=3)
Specificity
[image:10.595.23.581.379.543.2]The specificity of proposed method was ascertained by performing study at three concentration levels i.e. 80%, 100% and 120%. The mean recovery of added excipient at each level was found to be 93.9695-95.5376% with standard deviation of 0.00058-0.00153. The % RSD was found to be 0.0912-0.00153. The percent recovery obtained indicates non-interference from the excipients used in the formulation. The results of specificity study are given in Table 8 and Table 9.
Table 8: Specificity study Level of
addition
Standard API (μg/mL)
Aerosil 200 added (μg/mL)
Total
conc.(μg/mL) Absorbance
Drug recovered (μg/mL)
% Recovery
80% 6 4.8 6
0.645 5.7323 95.5376
0.644 5.7242 95.4032
0.646 5.7403 95.672
100% 6 6 6
0.641 5.7 95
0.642 5.7081 95.1344
0.639 5.6839 94.7312
120% 6 7.2 6
0.634 5.6435 94.0591
0.633 5.6355 93.9247
0.633 5.6355 93.9247
Table 9: Statistical validation of specificity studies Level of addition %Recovery (Mean ± SD)* % RSD SE
80% 95.5376 ± 0.001 0.0155 0.00058
100% 94.9552 ± 0.00153 0.2384 0.00088 120% 93.9695 ± 0.00058 0.0912 0.00033 *(n=3)
CONCLUSION
The developed UV spectrophotometric method was found to be simple, sensitive, accurate, precise, and reproducible. The values of % recovery was close to 100% indicating reproducibility and accuracy of the proposed method shows that the method could find practical application hence, utilized as routine quality control analysis.
ACKNOWLEDGEMENT
The author is thankful to principal, MET’S Institute of Pharmacy, Bhujbal Knowledge City, Nashik for providing facilities to carry out the research work. The author wishes to express his gratitude to Holden Pharmaceuticals (Sinner, Nashik) for providing gift sample of Mebendazole.
CONFLICT OF INTEREST
Author declares no conflict of interest regarding publication.
REFERENCES
1. Al-Kurdi, Z. I, Al-Jallad, T. and Jaber, A. M. Y., 1999, ‘High Performance liquid
chromatography method for determination of methyl 5-benzoyl-2 benzimidazole carbamate (mebendazole) and it’s main degradation product in pharmaceutical dosage forms’, Talanta, 1999; 50(5): 1089-1097.
2. Arafat, M., Kon, S. G. and Mikov, M., ‘The measurement of cefotaxime sodium in rat
plasma after oral administration: a sensitive HPLC-UV method’, International Journal of Pharmacy and Pharmaceutical Sciences, 2015; 7(4): 343-346.
3. Argekar, A. P., Raj, S. V., Kapadiya, S. U., ‘Simultaneous determination of mebendazole
and pyrantel pamoate from tablets by high performance liquid chromatography- reverse phase (RP-HPLC)’, Talanta, 1997; 44(11): 1959-1965.
4. Barar, F. S. K., ‘Essential of pharmacotherapeutics’, 6th ed. S. chand and company Ltd., New Delhi, 2011; 460.
5. Block, J. H. and Beale, J. M ‘Wilsons and grisvolds textbook of organic medicinal and pharmaceutical chemistry’, 11th
ed. Lippincott williams and Wilkins, Philadelphia, 2004; 953; 265-266.
6. British Pharmacopoeia, 1st ed. British Pharmacopoeia commission laboratory, London,
vol II, 2005; pp. 1262.
7. CIMS current index of medical specialities, world standard, UBM Media India Private
8. European pharmacopoeia 5.0, 5th ed. Published in accordance with the convection on the
elaboration of a European Pharmacopoeia, Council of Europe, Strasbourg (France), 2: 1981.
9. Florey, K., ‘Analytical profile of drug substances’, 1st ed. Academic press, 2005; 16: 293. 10. Foye, W. O., ‘Principles of medicinal chemistry’, 3rd
ed. Varghese publishing house, Bombay, 1989; 329.
11. Gide, M., Sharma, P., Saudagar, R. and Shrivastava B., ‘Method development and
validation for determination of febuxostat from spiked human plasma using RP-HPLC with UV detection’, Chromatography Research International, 2014; 1-5.
12. Government of India, Indian Pharmacopoeia Commision, Ministry of health and family welfare, 2014, ‘Indian Pharmacopoeia’, Controller of publications, Ghaziabad, vol I and
II, 2014; 498: 2154-2155.
13. ICH: Harmonised Tripartite Guideline, Validation of Analytical Procedures: Text and
Methodology Q2 (R1); Nov 2005; 4-5.
14. Kulik, A., Bialecka, W., Podolska, M., Puchniarz, B. K. and Mazurek, A., ‘HPLC method for identification and quantification of benzimidazole derivatives in antiparasitic drugs’,
2011; 68(6): 823–829.
15. Lemke, T. L. and Williams, D. A., ‘Foye’s Principles of Medicinal Chemistry’, 6th ed. Wolters kluwer Lippincott Williams and Wilkins, New Delhi, 2010.
16. Maryadele, J. O., ‘The Merck Index’, 14th
ed. Merck research laboratories, Merck & Co., Inc., Whitehouse station, NJ, USA, 2006; 5768.
17. Mills, T., Roberson, J. C., Matchett, C. C., Simon, M. J., Burns, M. D. and Ollis, R. J., 2006, ‘Instrumental data for drug analysis’, 3rd
ed. CRC press, Taylor & Francis Group, NW, Suite, USA, 2006; 3: 1800-1801.
18. Moffot, A., Osselton, M. and Widdop, B., ‘Clarke’s Analysis of drug and poisons’, 3rd ed. pharmaceutical press, London vol II, 2004; 1201-1202.
19. Orsine, E. M., Kedor-Hackmann, E. R. and Santoro, M. I., ‘Simultaneous determination
of thiabendazole and mebendazole in tablets by high performance liquid chromatography’, Drug Development and Industrial Pharmacy, 2000; 26(8): 879-883.
20. Paula, N. K. and Sena, M. M., 2007, ‘Validation of analytical methodology for
simultaneous evaluation of mebendazole and thiabendazole in tablets by high performance liquid chromatography’, Quimica Nova, 2007; 30(5): 1-5.
21. Pavia, D. L., Lampman, G. M., Kriz, G. S. and Vyvyan, J.R., ‘Spectroscopy’, 6th ed.
22. Rang, H. P., Dale, M. M., Ritter, J. M., Flower, R. J. and Henderson, G., ‘Rang and Dale’s Pharmacology’, 7th
ed. Elsevier Churchill Livingstone, London, 2012; 669.
23. Rao, R. K., Agarwal, N. K., Pavami, K. H., Kumar, B. P. and Mallikarjuna, R ‘Analytical
method development and validation for the simultaneous estimation of levamisole and mebendazole in bulk & tablet formulation by RP-HPLC method.’, Indian Journal of Research in Pharmacy and Biotechnology, 2014; 952–957.
24. Snyder, L. R., Kirkland, J. J. and Glajch J. L., ‘Practical HPLC method development’, 1st
ed. A wiley interscience publication, John Wily and sons, Inc., New York, 1997; 1-19: 110-119.
25. Su, S. C., Chang, C. L., Chang, P. C., Chou, S. S., ‘Simultaneous determination of albendazole, thiabendazole, mebendazole and their metabolites in livestock by high performance liquid chromatography’, Journal of Food and Drug Analysis, 2003; 11(4):
307–319.
26. Swamy, N., Prashanth, K. N. and Basavaiah, K., ‘Spectrophotometric assay of mebendazole in dosage forms using sodium hypochlorite’, Journal of applied
spectroscopy, 2014; 81(3): 525-533.
27. Sweetman, S. C., ‘Martindale The complete drug reference’, 36th
ed. Pharmaceutical press, London, 2009; 108.
28. Tripathi, K. D., ‘Essentials of Medical Pharmacology’, 6th
ed. Jaypee brothers, medical publishers Pvt Ltd, New delhi, 2008; 808-810.
29. Turabi, Z. M., Khatatbeh, O. A., Al-Abed, D. N., ‘RP-HPLC method development and
validation for the simultaneous determination of mebendazole and the two preservatives methylparaben and propylparaben in pharmaceutical oral suspension dosage form’,
International Journal of Pharmaceutical Sciences and Drug Research, 2014; 6(1): 70-74. 30. United States Pharmacopoeial Convention, ‘The United States Pharmacopoeia 29,
National Formulary 24’, Twinbrook parkway, Rockville MD, 2006; 1316.
31. US Food and Drug Administration, Center for Drug Evaluation and Research, Center for
Veterinary Medicine Guidance for industry- Bioanalytical method validation. Rockville, MD, 2013; 1-27.
32. Validation of Compendial Procedures. The United State Pharmacopoeia (USP30-NF25).