PERCEIVING PROPENSITY FOR AGGRESSION ANALYZING
FACIAL ANTHROPOMETRY, FWHR & LUNG FUNCTION
PARAMETERS AMONGST CHILDREN OF ATHLETIC AND
NON-ATHLETIC TYPES IN WEST BENGAL
Subrata Ghosh1*, Titlee Majumder2, Gopi Krishna Mondal3, Anandi Bagchi4, Sudip Sundar Das5 and Somnath Gangopadhyay6
1
Associate Professor, Department of Physiology, Hooghly Mohsin College, West Bengal, India, Pin: 712101.
2
Research Scholar, Department of Physiology, University of Calcutta, 92, APC Road, Kolkata, West Bengal, India, Pin: 700009.
3
Research Scholar, Department of Physical Education, Jadavpur University, Kolkata, West Bengal, India, Pin: 700032.
4Assistant Professor, Department of Physiology, Jhargram Raj College (Girl‟s Wing), West
Bengal, India, Pin: 721507.
5
Professor, Department of Physical Education, Jadavpur University, Kolkata, West Bengal, India. Pin: 700032
6
Professor & Head of the Department, Department of Physiology, University of Calcutta, 92, APC Road, Kolkata, West Bengal, India, Pin: 700009.
ABSTRACT
Background: Aggression is an offensive action, w h i c h i n c l u d e s the practice of doing a s s a u l t o r attack, p h ys i c a l l y or
verbally to other in general. Facial-width-to-height ratio (fWHR),
Farka‟s craniofacial landmarks and dynamic lung function parameters
are found to be correlated amongst pre-pubertal child athletes & non
athletes in West Bengal. Objectives: Comparing and contrasting
phenotypic bio-markers of aggression amongst pre- pubertal child
athletes and non-athletes in West Bengal depending on cognitive
anthropometric parameters, facial anthropometry, aggression score,
fWHR & LFT data.
Materials and Methods:
a. Physical & Cranio-facial Anthropometric parameters.
b. Dynamic lung function parameters
c. Cognitive task analysis methods by BPAQ scale.
Volume 7, Issue 12, 778-792. Research Article ISSN 2277– 7105
Article Received on 26 April 2018,
Revised on 16 May 2018, Accepted on 06 June 2018
DOI: 10.20959/wjpr201812-12650
*Corresponding Author
Subrata Ghosh
Associate Professor,
Department of Physiology,
Hooghly Mohsin College,
West Bengal, India, Pin:
Results: All statistical results emerged, showed clear indications towards meaningful phenotypic trait markers of aggression amongst pre-pubertal child athletes & non-athletes of
this area. Discussion: Social dominance hierarchies play a pivotal role in shaping athletic performances. To date, however, few physical and cognitive markers of dominance have
been identified. Such markers would be valuable in terms of understanding the etiology of
dominant behavior and changes in social hierarchies over time. Conclusion: Two sample t tests ensure the developing differences amongst athletic and non athletic children. Facial
height, head length, vital capacity, verbal aggression, physical aggression and hostility
scores are found to be instrumental re gard i ng cor rel at ed phenotypic biomarkers
amongst child athletes. However En-Ex, VA, PA and FEV-1/SVC are found to be equally
instrumental amongst child non athletes at least in this part of the world.
KEYWORDS: Facial anthropometry, aggression, Spirometry, fWHR.
INTRODUCTION
Anthropometry is a conglomeration of scientific artistry extensively used nowadays for
assessing soft tissue proportions with respect to skeletal back up. While it is true that error is
found in measurements of this kind, a great many trends of growth and development and
therapy changes can be recorded with a significant degree of accuracy. Recent studies and
innovations regarding facial anthropometry has widen up the ways to identify several facts
which includes physiological changes, nutritional status, social practices and cognitive
changes. People with different values of facial dimensions sometimes conclude various
positive correlations with other psychological signs. Identification of such facial dimensions
can be much useful in analysis of the cognitive changes. Aggression defines the unpredictable
behavior of a person who can cause harm to own or others, sometimes that harm can be
caused in a very large scale from a community to a nation.[I] Children are the future of nation and they need a healthy environment to grow, with lots of love, care and hospitality. Without
all these lots of cruelties may grow within a child. Children from their childhood show their
interest in various extracurricular activities like: sports, singing, dancing and recitation etc,
which give them refreshment from studies or daily activities. Sometimes those hobbies or
passions enforce them to become famous in later life. Amongst all these activities, sports are
liked by the boys most. Boys of all ages, races and socioeconomic status love to play games
of any types whether it is indoor or outdoor. Involvement in various sports activity gives
became competitive, passionate and also became aggressive to achieve something. This cross
sectional study is mainly based to find this behavioral differentiation amongst the athletic and
non athletic boys, in correlation with various facial dimensions as well as unique pulmonary
[image:3.595.157.430.173.415.2]functions, which can be known as the predictor of aggressive behavior.
Fig. 1: Cranio-facial dimensions of human.[10]
Amongst all the facial anthropometric parameters facial width to height ratio (fWHR) is one
of the potent markers to determine irrational behavior amongst children. Distance between
left and right Zygoma is considered as facial width and distance between upper lips to mid of
eyebrows is considered as the facial height.[2] Several research works have already done to draw some relation between the facial dimensions and aggression. Though proofs regarding
these are merely found but some significant works are still there to generate clear ideas
regarding identification of cruelty by fWHR.[3] Study of fWHR is much evident in generating
aggression amongst the boys those who are involved in various kinds of sports than that of
athletic girls.[4] FWHR also show positive predictions of fouls within midfielders and forwards, and goals and assists them in taking challenges to beat opponents.[5] The aggression not only defines non cooperation and selfishness but also have some other shades, like
competing mentality, uncontrollable desire to generate strength or effort regarding some good
work, getting passionate to achieve something etc, which may be recognized as the positive
Farka‟s has also taken into account to identify whether these Farka‟s land marks are able to
predict any behavioral irrationality amongst atheletes or not.[6]
Pulmonary function test (PFT) is a part of patho-physiology, which measures how much and
how quickly a person can move air out of lungs. In this test the person has to breathe into a
mouthpiece attached to a machine called a Spirometer. Spirometric assessments can be
divided into two types i)static pulmonary function test, which totally depends upon the
consumption of air inside the lungs, called Slow vital capacity (SVC) & ii) dynamic function
test consider the consumption of air volume inside the lungs according to the time, which is
also known as Forced vital capacity(FVC). PFT includes many values, which help to assess
the abnormal condition of a person‟s lungs, which are explained at Table no: 2.[7]
Ideology generated from the early works state that Men‟s facial width to height ratio is said to
be a reliable predictor of aggressive tendencies, though it is indicated very shortly but still a
significant positive relationship is observed.[8] Studies regarding facial anthropometry are changing day by day and opening up several frontiers in medical as well as ergonomic
researches. Psychological assessments are also most of the times done on the basis of facial
indexes, whether in cases of children or in adults. Expressions in both the cases are different
from each other depending upon age. Similarly primary age can be considered as the age of
learning, so children at this age are in various growth spurts which show different types of
behavioral projections in them.[9] Children at the age of pre puberty mostly show behavioral
irrationality, which become vanished at post puberty along with the growing age.[10] On the
other hand calm and quiet children can also become aggressive at their adult age. Several
strains of aggression can‟t be controlled genetically with growing age but also get reduced
with proper counseling methods, which may include numerous extracurricular activities
including sports. Pattern of breathing can also be different within an aggressive person,
which can be assessed with the help of lung function test or Spirometry. There are numerous
factors present within lung function test (LFT) and all these factors vary of an individual with
their certain biological factors and also cause cognitive changes. Cognitive changes like
stress for any reason can also influence the pattern of breathing, through which alteration in
pulmonary gas exchanges occur.[10,13] Amalgamation of facial anthropometric parameters along with the parameters of pulmonary function test may unfold some newer predictors of
aggression, by which an aggressive individual can be easily identified from their childhood.
1. Whether values of fWHR ratio is able to correlate with other facial anthropometric
parameters, especially with five major facial dimensions of Farka‟s.
2. Whether the values of fWHR shows any direct or indirect correlation with aggression
amongst the children of both groups.
3. To identify the pattern of aggression amongst the children who are regularly exposed to
sports or other physical exercises in comparison to the control counterparts.
4. Whether fWHR correlates with any of the parameters of lung function test.
MATERIALS AND METHODS
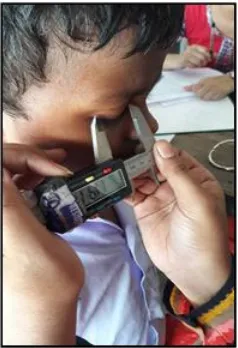
[image:5.595.238.357.307.481.2]Ethics: This study was performed following the human ethical guideline of Institutional ethical committee (Human), Hooghly Mohsin College, as per ICMR, (GOI) directions.
Fig. 2: Measuring En-Ex, Farka’s landmark.
136 boys of 10 to 12 years are selected randomly from two different schools for this
particular study. Amongst them 57 students are volley ball players who are placed at a single
group considered to be the experimental or athletic group and rest 79 students are those who
are not involved in any sports; are considered to be the control group or non athletic group.
Parameters of facial and physical anthropometry are assessed, aggression questionnaire
(revised, Buss & Perry, Aggression questionnaire, BPAQ)[12] and pulmonary function test are performed to subjects of both the groups.
Parents of the children and all the teachers of both the schools had supported and cooperated
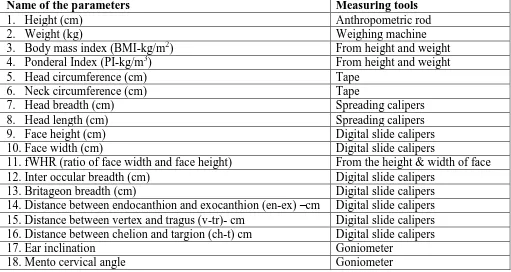
tremendously in fulfillment for this piece of work. Measured cranio-facial anthropometric
parameters are listed below in Table 1 with some basic physical parameters and their
Name of the parameters Measuring tools
1. Height (cm) Anthropometric rod
2. Weight (kg) Weighing machine
3. Body mass index (BMI-kg/m2) From height and weight
4. Ponderal Index (PI-kg/m3) From height and weight
5. Head circumference (cm) Tape
6. Neck circumference (cm) Tape
7. Head breadth (cm) Spreading calipers
8. Head length (cm) Spreading calipers
9. Face height (cm) Digital slide calipers
10.Face width (cm) Digital slide calipers
11.fWHR (ratio of face width and face height) From the height & width of face
12.Inter occular breadth (cm) Digital slide calipers
13.Britageon breadth (cm) Digital slide calipers
14.Distance between endocanthion and exocanthion (en-ex) –cm Digital slide calipers
15.Distance between vertex and tragus (v-tr)- cm Digital slide calipers
16.Distance between chelion and targion (ch-t) cm Digital slide calipers
17.Ear inclination Goniometer
18.Mento cervical angle Goniometer
Table 2: Parameters that are assessed in lung function test or Spirometry, assessing respiratory fitness, are enlisted.
Lung Function Test Instrument Measures Function
Spirometry Chestgraph 801 Computerised Spirometer Forced vital capacity(FVC)
Volume of air that is exhaled after maximum inhalation.
Forced expiratory
Volume(FEV) Volume of air exhaled in one breadth
Forced expiratory flow, 25
to 75% Air flow in the middle of exhalation.
Peak expiratory flow(PEF) Rate of exhalation. maximum voluntary
ventilation (MVV)
Volume of air that can be inspired and expired in 1 minute.
Slow vital capacity(SVC)
Volume of air that can be slowly exhaled after inhaling past the tidal volume
Total lung capacity(TLC) Volume of air in the lungs after
maximum inhalation. Functional residual
capacity (FRC)
Volume of air left in the lungs after normal expiration.
Residual Volume (RV) Volume of air in the lungs after
maximum exhalation
Total lung capacity (TLC) Maximum volume of air that the lungs
can hold. Expiratory Reserve
Volume (ERV)
[image:6.595.43.554.74.346.2]Comparisons are done of measured facial anthropometric parameters, parameters of lung
function test to find out, whether both the group possesses any significant changes difference
or not. Aggression score is also assessed with the help of Buss and Perry Aggression
questionnaire and all the aggression scores are correlated with measured facial and
physiological parameters. Parameters of aggression are physical aggression (PA), verbal
aggression (VA), Anger and Hostility.
All the measured parameters are compared by a statistical method namely, two sample t test
and correlated with the help of Pearson‟s correlation by Minitab software of statistics version
17.
RESULTS AND OBSERVATIONS Graphical presentation
Bar Diagram 1: Shows that non athletes have significantly higher BMI than that of athletes (p<0.05).
Bar diagram 3: Shows that non-athletes have significantly higher head circumference than that of athletes (p<0.05).
Bar diagram 4: Shows that athletes have significantly higher face height than that of non-athletes (p<0.05).
Bar diagram 6: Shows that athletes have significantly higher inter occular breadth than that of non athletes (p<0.05).
Bar diagram 7: Shows that athletes have significantly higher PA than that of non athletes (p<0.05).
Bar diagram 9: Shows that non athletes have significantly higher FEV than that of athletes (p<0.05).
Bar diagram 10: Shows that athletes have significantly higher FEV-1/FVC than that of non athletes (p<0.05).
Bar diagram 12: Shows that non athletes have significantly higher FVC than that of athletes (p<0.05).
Bar diagram 13: Shows that non athletes have significantly higher PEF than that of athletes (p<0.05).
After comparing all the assessed parameters with the help of two sample t test, the following
observations are obtained,
1. Physical Parameters like BMI, PI are significantly higher in the cases of non athletes than
that of athletic counterpart.
2. Craniofacial parameters of Farka‟s like, en-ex and v-tr are found to be significantly higher
amongst the non athletic boys group than that of athletic boys group.
3. Similarly craniofacial parameters like head circumference, inter occular breadth and face
height are found to be significantly higher in the athletic group than that of non athletic
group.
4. Cognitive parameter namely physical aggression is found to be significantly higher in the
From the comparison of different components of lung function test, it can be confirmed that
non athletes have significantly higher values of PEF, FVC, FEV as well as FEV-1/SVC ratio
than that of athletes of same age group. On the other hand athletic individuals contain
[image:12.595.20.582.190.391.2]significantly higher rate of FEV-1/FVC ratio than that of athletic counterpart.
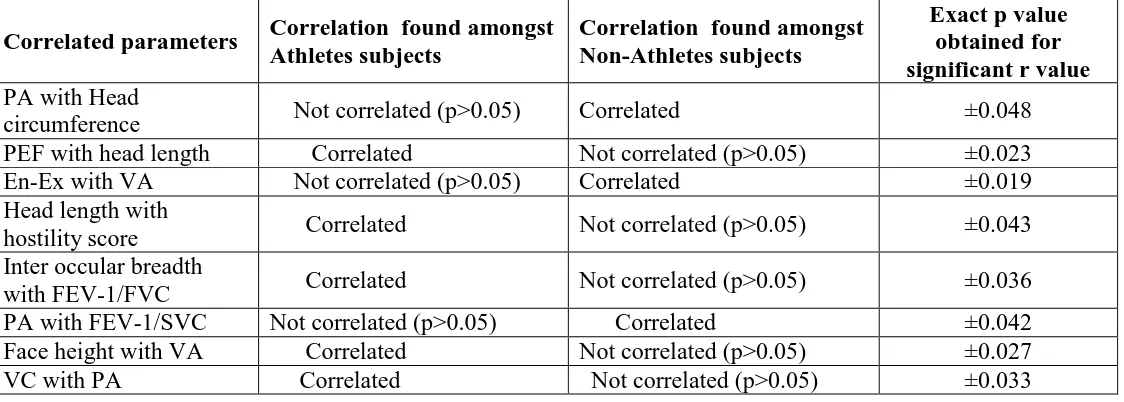
Table 3: Pearson’s Correlation amongst assessed Parameters. Correlated parameters Correlation found amongst
Athletes subjects
Correlation found amongst Non-Athletes subjects
Exact p value obtained for significant r value
1. PA with Head
circumference Not correlated (p>0.05) Correlated ±0.048
2. PEF with head length Correlated Not correlated (p>0.05) ±0.023
3. En-Ex with VA Not correlated (p>0.05) Correlated ±0.019
4. Head length with
hostility score Correlated Not correlated (p>0.05) ±0.043
5. Inter occular breadth
with FEV-1/FVC Correlated Not correlated (p>0.05) ±0.036
6. PA with FEV-1/SVC Not correlated (p>0.05) Correlated ±0.042
7. Face height with VA Correlated Not correlated (p>0.05) ±0.027
8. VC with PA Correlated Not correlated (p>0.05) ±0.033
1. Mean value of physical aggression of non athletic subjects are found to be significantly
correlated with their mean scores of head circumference where, p<0.048.
2. Mean scores of peak expiratory flow (PEF) rates in athletes are found to be significantly
correlated with their mean head length, where p<0.023.
3. Mean value of en-ex in non athletes are found to be significantly correlated with their
mean scores of verbal aggression, where p<0.019
4. Similarly mean value of head length in athletes are found to be significantly correlated
with their mean hostility scores where, p<0.043.
5. Mean Inter occular breadths of athletic subjects are found significantly correlated with
mean scores of FEV1/FVC ratio, where p<0.036.
6. Mean score of Physical aggression amongst non athletic subjects are found to be
significantly correlated with the mean ratio of FEV-1/SVC where p<0.042.
7. Mean scores of facial height in athletic subjects are found to be significantly correlated
with verbal aggression of them, where p<0.027.
8. Mean scores of Vital capacity of the athletic subjects are also found to be significantly
DISCUSSION
From the statistical analyses some newer dimensions emerge for the study of facial
anthropometry as well as physiology and cognitive ergonomics. In one hand compared data
are enough sound to prove that facial as well as body dimensions of athletic and non athletic
persons is not same.[14] Regarding this comparative observations amongst physical
parameters like height, weight, BMI & PI, it has been surprisingly found that BMI & PI are
found to be much higher in non athletes than athletes, although both the data fall within
normal limits. It is axiomatic that child athletes who are utilizing additional calories with
much higher workload show reduced BMI & PI. It indicates that proper & sufficient fueling
and feeding are absent amongst these class. It has been also found that only FEV-1/FVC
percentage is higher amongst the athletic subjects than that of its non athletic counterpart. All
other studied dynamic lung function variables are found to be much higher in non athletes
than that of athletes at least in this study.
On the other hand one of the most important findings amongst the child athletes and non
athletes are specific facial anthropometric parameters, which are found to be typically and
significantly correlated with specific, a) pulmonary function parameters, b) specific other
facial data and c) aggression scores namely: verbal aggression, physical aggression and
hostility. Cognitive aggression score showed all the three parameters have much authentic
correlation with the anthropometric and physiological score amongst the athletes and are not
much dominant amongst the non athletes. Therefore it can be said that respiratory health and
cognitive scores are found to be reciprocal in this part. Researchers specifically found that
most of the child athletes are belonging from very poor families with very big family sizes.
This burgeoning truth reminds us that our nation is not that much fortunate economically,
here “Reproductive success” is converted to “Reproductive excess” and depreciates individual‟s cost of nutrition as a result development of negative intuition rather aggression.
On the contrary it can be said that hyper sensation rather aggression in any individual not
only converges them towards negativity but also it can work in a positive manner especially
for the athletes who may give effort to fetch victory for themselves or for the team. Though
still researches are needed to propagate in this field to segregate the type of aggression and
generate more parameters which may help to identify the pattern of aggressiveness whether it
is helpful and harmful. Apart from this it can be also said that patterns of breathing can be
is an athlete or non athlete. It may also appear that probably nutritional assurance,
socioeconomic paradox and parental care are probably the major key factors for this kind of
outcome. Further in depth study is required in this direction near future.
CONCLUSION
Numerous studies take place globally in identifying the aggression traits amongst the pre and
post pubertal children, whether they are sedentary or athletic in nature. This particular study
is a special one that attempts to recognize the pattern, amplitude and types of aggression in
normal as well as athletic person in correlation with other physiological and anthropometric
parameters.
Amongst several findings of the study few major findings are came in the limelight which
include the following:
i) Identification of verbally aggressive athletes by specific range of vital capacities
ii) Face height can be another indicator for physical aggression amongst athletes as, fWHR
do not show any significant correlation with any of the aggression scores
iii) None of the Farka‟s land marks possess any significant correlation with any of the
aggression scores amongst the athletes, but in non athletes one of the Farka‟s parameters
namely En-Ex show significant correlation with verbal aggression and lastly
iv) All the respiratory variables possess much higher values in non athletes except
FEV-1/FVC.
ACKNOWLEDGEMENT
We are indebted to convey our deepest sense of gratitude and sincere appreciation to all the
students of both the schools at Kolkata as well as Serampore and my co workers for their
support and cooperation.
REFERENCES
1. Wayne A Warburton, Craig A Anderson, “Aggression, Social Psychology of”, International
Encyclopedia of the Social & Behavioral Sciences, 2nd edition, Volume 1, pp. 295–299,
doi.org/10.1016/B978-0-08-097086-8.24002-6.
2. Rappaport N1, Thomas C., „Recent research findings on aggressive and violent behavior in
youth: implications for clinical assessment and intervention”, 2004 Oct.; 35(4): 260-77.
3. Haselhuhn MP, Ormiston ME, Wong EM Men‟s Facial Width-to-Height Ratio Predicts
4. Robin S. S. Kramer, School of Psychology, University of Aberdeen, Aberdeen, UK;
Department of Psychology, University of York, “Facial Width-to-Height Ratio in a Large
Sample of Commonwealth Games Athletes”, Evolutionary Psychology, 2015; 13(1):
197-209.
5. Keith M. Welker & Stefan M. M. Goetz & Shyneth Galicia & Jordan Liphardt & Justin M.
Carré, “An Examination of the Associations Between Facial Structure, Aggressive Behavior,
and Performance in the 2010 World Cup Association Football Players” Adaptive Human
Behavior and Physiology, Springer International Publishing 2014, DOI
10.1007/s40750-014-0003-3.
6. Farkas, LG & Munro IR (1997),. Facial Anthropometric Differences among Gender,
Ethnicity, and Age Groups, Charles C Thomas: Springfield. Ilunious. USA, 1997; 344.
7. Shobha Rani Vedala, Niranjan Paul, Abhay B Mane., Difference in pulmonary function test
among the athletic and sedentary population; Natl J Physiol Pharm Pharmacol., 2013; 3(2):
118-123.
8. Yu Yang1*, Chen Tang2, Xiaofei Qu1, Chao Wang3 and Thomas F. Denson4, Group Facial
Width-to-Height Ratio Predicts Intergroup Negotiation Outcomes, ORIGINAL RESEARCH
published: 21 February 2018 doi: 10.3389/fpsyg.2018.00214.
9. Majumder Titlee, Bagchi Anandi, Gangopadhyay Somnath, Ghosh Subrata, “Finger digit
ratio: predicting aggression amongst school children of biphasic growth in Eastern part of West Bengal”. IOSR Journal of Pharmacy and Biological Sciences; 2017; 12(4): Ver. VIII,
PP 17-22.
10.Ramanathan, N Chellappa, Rama, “Modeling Age Progression in Young Faces”, 2006;
Volume: 1, Volume: 1, DOI: 10.1109/CVPR.2006.187, 387-394.
11.Lixian Cui, Amanda Sheffield Morris, Amanda W. Harrist, Robert E. Larzelere, Michael M.
Criss, and Benjamin J. Houltberg, Adolescent RSA Responses during an Anger Discussion
Task: Relations to Emotion Regulation and Adjustment, Emotion, 2015 Jun; 15(3): 360–372.
12."Buss, A.H., Perry, M., “The aggression questionnaire”. Journal of Personality and Social
Psychology, 1992; 63: 452– 459.
13.Steven M. Gillespie, Artur Brzozowski & Ian J. Mitchell Self-regulation and aggressive
antisocial behaviour: insights from amygdala-prefrontal and heart-brain
interactions, Psychology, Crime & Law, 2017; 24(3): 243-257.
14.Berwig, Luana Cristina, Marquezan, Mariana, Trevisan, Maria Elaine, Chiodelli, Lais,
Rubim, Andrielle, orrêa, Eliane Castilhos Rodrigues, Silva, Ana Maria Toniolo da; “Facial
![Fig. 1: Cranio-facial dimensions of human.[10]](https://thumb-us.123doks.com/thumbv2/123dok_us/862674.597650/3.595.157.430.173.415/fig-cranio-facial-dimensions-of-human.webp)