The Economic and Social Review, Vol. 27, No. 2, January, 1996, pp. 181-186
A V i s u a l Test for a Unit Root: Geary's Count of
Sign Changes Revisited
P A T R I C K H O N O H A N *
The Economic and Social Research Institute
Abstract: Prompted by Geary's (1970) suggestion in a different context, the stationarity of a
plotted time series can be assessed by simply counting the number of times the plot crosses the trend line linking the first and last observations. The 95 per cent critical value is conveniently approximated by twice the square root of the sample size. Despite its simplicity, the test has surprisingly good power.
eary (1970) proposed a s i m p l e c o u n t o f sign-change t e s t for s e r i a l \-A independence of regression residuals. H i s test-statistic x has t h e m e r i t o f being very easy to calculate - i t can be done by h a n d w i t h even a f a i r l y large time-series. Subsequent research ( H a b i b a g a h i a n d Pratschke, 1972; H a r r i s o n , 1975; S c h m i d t a n d G u i l k e y , 1975) revealed t h a t t h e p o w e r o f Geary's t e s t was generally l o w e r t h a n t h a t o f tests based on t h e D u r b i n -Watson or V o n N e u m a n n statistic.
I n recent years practical focus o f m u c h macroeconometric w o r k has shifted f r o m i d e n t i f y i n g t e s t i n g for serial c o r r e l a t i o n to t e s t i n g for n o n - s t a t i o n a r i t y . M a n y macroeconomic t i m e series are now t h o u g h t to be n o n - s t a t i o n a r y (cf. Nelson a n d Plosser, 1982; de J o n g and W h i t e m a n , 1991), a n d t h e question o f l o n g - t e r m r e l a t i o n s h i p s b e t w e e n such n o n - s t a t i o n a r y v a r i a b l e s has been examined u s i n g the concept o f co-integration, i t s e l f i m p l y i n g t h e existence o f a stationary l i n e a r combination o f t h e variables.
*I am grateful to Denis Conniffe, Mike Harrison and an anonymous referee for very helpful comments.
T e s t i n g for n o n - s t a t i o n a r i t y or for lack o f cointegration has r e q u i r e d new procedures, such as those developed by D i c k e y a n d F u l l e r (1979; 1981), P h i l l i p s a n d P e r r o n (1988), E n g l e a n d Granger (1987), a n d Johansen (1988; 1991). N o one test statistic has emerged as d o m i n a n t : a lack o f power b e i n g a common complaint.
A l t h o u g h these t e s t s are q u i t e sophisticated, a n d some r e q u i r e special tables o f c r i t i c a l values, t h i s need n o t be a n obstacle to t h e i r use by applied economists as t h e y are b e i n g w r i t t e n i n t o s t a n d a r d econometric packages. B u t i t w o u l d seem convenient t o have a q u i c k v i s u a l check o f s t a t i o n a r i t y . T h e s i g n change t e s t (Geary's x) c e r t a i n l y offers convenience ( i t can be done w i t h j u s t a r u l e r f r o m a p l o t o f t h e t i m e series to be checked for n o n
-s t a t i o n a r i t y ) , b u t can i t be u-sed for non--stationarity w i t h a-s m u c h effect a-s for its o r i g i n a l purpose, a test for serial independence?
A n o n - s t a t i o n a r y t i m e series tends to deviate away from i t s s t a r t i n g point. W h i l e r e t u r n t o t h e s t a r t i n g p o i n t is possible, indeed i n e v i t a b l e , for a d r i f t -less (trend--less) r a n d o m w a l k , t h e p r o b a b i l i t y of m u l t i p l e r e t u r n s w i t h i n a g i v e n epoch ( d u r a t i o n o f sample) is v e r y s m a l l . A d o u b l i n g of t h e epoch by no means doubles t h e expected n u m b e r o f r e t u r n s . I n contrast, a drift-less s t a t i o n a r y t i m e series tends t o have a h o m i n g i n s t i n c t and w i l l t e n d to r e t u r n t o s t a r t i n g p o i n t r e l a t i v e l y frequently. F u r t h e r m o r e , a d o u b l i n g o f t h e epoch w i l l e v e n t u a l l y t e n d t o double the expected n u m b e r of r e t u r n s .
M o s t tests for n o n - s t a t i o n a r i t y are based on estimates o f local r e l a t i o n ships b e t w e e n adjacent observations i n t h e t i m e series ( a n exception is t h e approach used by Cochrane, 1988). B y l o o k i n g at the global properties of a r e a l i s a t i o n Geary's t m a y r e g a i n some of t h e power i n e v i t a b l y lost t h r o g h i t s s i m p l i c i t y .
T h e purpose of t h i s note is t o consider t h e use of t h e Geary x statistic i n t e s t i n g for n o n - s t a t i o n a r i t y . F i r s t , we review k n o w n a n a l y t i c a l results for t h e n u m b e r o f s i g n changes i n t h e simple r a n d o m w a l k . We t h e n t u r n t o com p u t a t i o n o f c r i t i c a l values a n d power for a t e s t of non-stationarity against a first-order autoregressive process, u s i n g a Monte-Carlo procedure.
I I M E T H O D
W e begin w i t h a simple first-order autoregressive process:
x ( t ) = oc + p x ( t - l ) + u ( t ) • (1)
Geary's o r i g i n a l a p p l i c a t i o n was t o test t h e hypothesis p = 0. O u r problem i n contrast is to t e s t t h e hypothesis p = 1.
w i t h j u s t a r u l e r ,1 we propose t o e s t i m a t e i t as t h e m e a n change i n t h e
sample:
( x ( T ) - x ( 0 ) ) / T .
I n fact, u n d e r the n u l l hypothesis p = 1, t h i s estimate of a is asymptotically m a x i m u m l i k e l i h o o d .2 U s i n g t h i s e s t i m a t e o f a for t h e s i g n change t e s t
amounts to p l a c i n g the r u l e r o n t h e f i r s t a n d last observations before c o u n t i n g t h e n u m b e r of times t h e sample p a t h crosses the r u l e r i n either d i r e c t i o n . T h a t n u m b e r is the test statistic t .
I l l C R I T I C A L V A L U E S
For t h e case o f a simple r a n d o m w a l k w i t h o u t d r i f t (i.e., w h e r e u ( t ) is 1 or - 1 , a = 0 , p = l ) , Feller (1968), p. 86, shows t h a t , g i v e n a fixed v a l u e z, for T large, the p r o b a b i l i t y of h a v i n g fewer t h a n x* = z^T sign changes tends to
2N(2z) - 1
as T tends t o i n f i n i t y , w h e r e N represents t h e N o r m a l (Gaussian) d i s t r i b u t i o n .
C o n s u l t i n g t h e N o r m a l d i s t r i b u t i o n tables, we can o b t a i n a one-sided 95 per cent confidence i n t e r v a l for x. T h e c r i t i c a l v a l u e i s j u s t 0.98 t i m e s t h e square r o o t o f t h e epoch. (1.16 t i m e s VT for t h e 99 per cent confidence interval.)
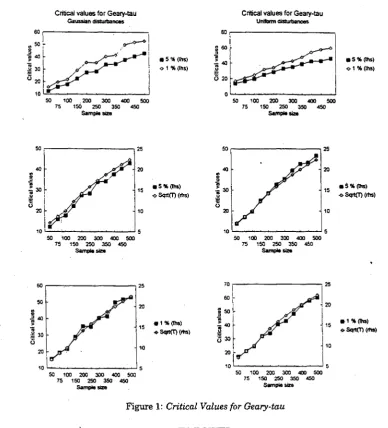
F o r u n i f o r m a n d n o r m a l disturbances, t h i s f o r m u l a does n o t a p p l y .3 B u t
M o n t e C a r l o s i m u l a t i o n establishes t h a t t h e c r i t i c a l values are s t i l l p r o p o r t i o n a l t o t h e square r o o t o f t h e sample size, b u t about t w i c e as l a r g e (Figure 1). F o r 95 per cent confidence i n t e r v a l t h e u n i f o r m gives 2.07 V T : t h e N o r m a l gives 1.88 VT (for 99 per cent confidence: 2.61 V T a n d 2.36 VT respectively). T h i s simple f o r m u l a for t h e c r i t i c a l value is v e r y convenient as i t does away w i t h the need for u s i n g critical value tables.
I t is n o t s u r p r i s i n g t h a t t h e n u m b e r of sign changes should be about double r e l a t i v e t o t h e simple r a n d o m w a l k , as t h e n u m b e r o f occasions w h e n t h e simple r a n d o m w a l k touches zero exactly w i t h o u t crossing i t ( a n e v e n t u a l i t y of negligible p r o b a b i l i t y i n t h e more general case) is twice t h e n u m b e r of sign changes.4
L Unlike the otherwise similar test proposed by Boero and Burridge (1991). I am grateful to Mike Harrison for drawing this paper to my attention.
2. I am grateful to Denis Conniffe for pointing this out to me.
3. Though Burridge and Guerre (forthcoming, 1996) have recently established the asymptotic normality of the sign-change count normalised by the square-root of the sample size.
Critical values for Geary-tau Critical values for Geary-tau
Gaussian disturbances Uniform disturbances
• 5 % ( l h s )
o 1 % (Ihs)
50 100 . 200 300 400 500 50 100 200 300 400 500 75 150 250 350 450 75 150 250 350 450
Sample siza S a m p t * size
[image:4.480.37.426.68.497.2]S a m p l e s ™ S a m p l e s * .
Figure 1: Critical Values for Geary-tau
TV P O W E R
W e have computed t h e power o f t h e t a u s t a t i s t i c for b o t h u n i f o r m a n d N o r m a l disturbances. W e assumed a = 0 i n E q u a t i o n 1 above a n d computed 1,000 realisations for a v a r i e t y of sample sizes T. The results are shown i n Table l .5 T h e l o w power w h i c h plagues other test statistics i n t h i s area is
evident here again.
VISUAL T E S T FOR A UNIT ROOT
Table 1: Power of Geary-tau
Power of tau test (Uniform disturbance)
T tau rho=l 0.99 0.975 0.95 0.9 0.8
5%
500 46.6 0.05 0.089 0.271 0.641 0.917 0.997
250 32.8 0.05 0.067 0.123 0.270 0.679 0.942
200 28.6 0.05 0.066 0.103 0.211 0.539 0.897
100 19.7 0.05 0.057 0.076 0.129 0.238 0.571
50 13.7 0.05 0.060 0.074 0.091 0.158 0.331
1%
500 60.3 0.01 0.025 0.088 0.394 0.828 0.984
250 40.5 0.01 0.014 0.033 0.096 0.364 0.821
200 34.0 0.01 0.020 0.031 0.085 0.284 0.789
100 24.5 0.01 0.011 . 0.020 0.025 0.072 0.249
50 16.9 0.01 0.014 0.014 0.020 0.029 0.117
Power of tau test (Gaussian disturbance)
T tau rho=l 0.99 0.975 0.95 0.9 0.8
5%
500 43.1 0.05 0.099 0.286 0.650 0.926 0.991
250 28.4 0.05 0.082 0.152 0.338 0.703 0.936
200 27.5 0.05 0.043 0.087 0.188 0.506 0.879
100 17.8 0.05 0.061 0.081 0.113 0.240 0.571
50 12.3 0.05 0.061 0.061 0.093 0.137 0.266
1%
500 53.0 0.01 0.020 0.087 0.324 0.790 0.965
250 35.3 0.01 0.017 0.043 0.134 0.408 0.845
200 35.5 0.01 0.006 0.015 0.035 0.156 0.592
100 21.8 0.01 0.017 0.022 0.041 0.086 0.318
50 15.6 0.01 0.016 0.010 0.018 0.029 0.069
V C O N C L U S I O N
O u r conclusion i s t h a t t h e s i m p l e sign change t e s t is a useful t o o l for i n f o r m a l analysis, n o t only because the s t a t i s t i c can be c a l c u l a t e d b y h a n d , b u t also because a n a p p r o x i m a t e 5 per cent c r i t i c a l v a l u e can be o b t a i n e d , w i t h o u t c o n s u l t i n g tables, by s i m p l y d o u b l i n g t h e square root o f t h e sample size.
REFERENCES
BOERO, G., and P. BURRIDGE, 1991. "A Simple Non-parametric Test for a U n i t Root", University of Birmingham Department of Economics Discussion Paper 9 1 -26, mimeo.
BURRIDGE, P., and E. GUERRE, 1996. T h e Limit Distribution of Level Crossings of a Random Walk, and a Simple U n i t Root Test", University of Birmingham Department of Economics Discussion Paper 95-19, mimeo; forthcoming i n Econometric Theory.
COCHRANE, W.J., 1988. "How Big is the Random Walk i n GNP?", Journal of Political Economy, Vol. 96, No. 5, pp. 893-920.
de JONG, D.N., and C.J. W H I T E M A N , 1991. "Reconsidering 'Trends and Random Walks i n Macroeconomic Series'", Journal of Monetary Economics, Vol. 28, No. 2, pp. 221-254.
DICKEY, D.A., and W.A. F U L L E R , 1979. "Distribution of the Estimators for Autogressive Time Series W i t h a U n i t Root", Journal of the American Statistical Association, Vol. 74, No. 366, Part 1, pp. 427-431.
D I C K E Y , D.A., and W.A. F U L L E R , 1981. "Likelihood Ratio Statistics for Autoregressive Time Series W i t h a U n i t Root", Econometrica, Vol. 49, No. 4, pp.
1,057-1,072.
ENGLE, R.F., and C.W.J. GRANGER, 1987. "Cointegration and Error-Correction: Representation, Estimation and Testing", Econometrica, Vol. 55, No. 2, pp. 251-276. FELLER," W., 1968. An Introduction to Probability Theory and its Applications, Vol. 1,
3rd Edh., New York: Wiley.
GEARY, R.C., 1970. "Relative Efficiency of Count of Sign Changes for Assessing Residual Autoregression i n Least Squares Regression", Biometrika, Vol. 57, No. 1, pp. 123-127.
H A B I B A G A H I , H . , and J.L. PRATSCHKE, 1972. "A Comparison of the Power of the Von Neumann Ratio, Durbin-Watson and Geary Tests", Review of Economics and Statistics, Vol. 54, No. 2, pp. 179-185.
HARRISON, M . J . , 1975. "The Power of the Durbin-Watson and Geary Tests: Comment and Further Evidence", Review of Economics and Statistics, Vol. 57, No. 3, pp. 377-379.
JOHANSEN, S., 1988. "Statistical Analysis of Cointegration Vectors", Journal of Economic Dynamics and Control, Vol. 12, No. 2/3, pp. 231-254.
JOHANSEN, S., 1991. "Estimation and Hypothesis Testing of Cointegration Vectors i n Gaussian Vector Autoregressive Models", Econometica, Vol. 59, No. 6, pp.
1,551-1,580.
NELSON, C.R., and C. PLOSSER, 1982. "Trends and Random Walks i n Macro-economic Time Series", Journal of Monetary Economics, Vol. 10, No. 2, pp. 139-162. PHILLIPS, P.C.B., 1987. "Time Series Regression w i t h a U n i t Root", Econometrica,
Vol. 55, No. 2, pp. 277-303.
PHILLIPS, P.C.B., and P. PERRON, 1988. "Testing for a Unit Root i n Time Series Regression", Biometrika, Vol. 75, No. 2, pp. 335-346.