DEVELOPMENT AND VALIDATION OF A STABILITY INDICATING
METHOD BY ULTRA PERFORMANCE LIQUID
CHROMATOGRAPHY FOR THE DETERMINATION OF
VANCOMYCIN DRUG IN VANCOMYCIN INJECTION
A. Mallibabu*1, C. Hazarathaiah Yadav2 and P. Janaki Pathi3 1,2
Department of Chemistry, Vel Tech Rangarajan Dr. Sagunthala R&D Institute of Science
and Technology, Avadi, Chennai-600062, India.
3
Analytical Department, Vishnu Chemicals Limited, Jeedimetla, Hyderabad.
ABSTRACT
The Analytical Method Development and Validation of Vancomycin
drug in Vancomycin Injection is particularly designed to intended
purpose of Pharmaceutical Industries. A simple, precise, rapid and
accurate reverse phase UPLC method was developed for the estimation
of Vancomycin drug in Vancomycin Injection. Waters xterra RP18,
150mm x 3.9mm, 5µm with mobile phase consisting of monobasic
ammonium phosphate buffer 0.05M and acetonitrile were mixed in the
ratio 90:10 (v/v) respectively and degassed for about 10 minutes.
Isocratic mode of chromatography technique was used. The flow rate
was 0.7 mL/min and the eluents were monitored at 230 nm. The
retention time of the Vancomycin peak is about 3.5 minutes. The
detector response was linear in the concentration of 5.03 to 15.08
mcg/mL, Y-intercept is -49657 and slop is 754605.4. The percentage assay of Vancomycin
was 100%. The method was validated by determining its accuracy, precision and linearity
with inline of International Council on Harmonization guidelines, ICH Q2R1.
KEYWORDS: Vancomycin Injection, Analytical Method by UPLC, Reverse Phase Chromatography, Stability Indicating, Isocratic mode of Chromatography Technique and
Industrial Intended Purpose.
Volume 7, Issue 19, 1100-1108. Research Article ISSN 2277– 7105
Article Received on 07 October 2018,
Revised on 27 October 2018, Accepted on 17 Nov. 2018
DOI: 10.20959/wjpr201819-13766
*Corresponding Author
A. Mallibabu
Department of Chemistry,
Vel Tech Rangarajan Dr.
Sagunthala R&D Institute of
Science and Technology,
Avadi, Chennai-600062,
INTRODUCTION
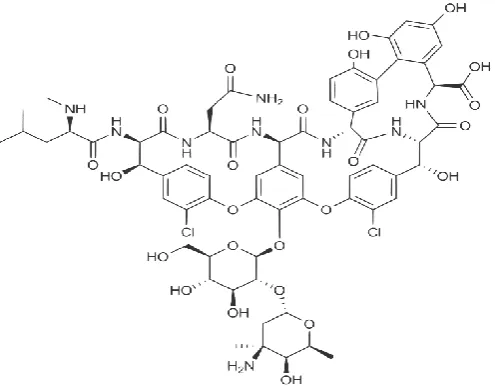
Vancomycin is a Glycopeptide Antibacterial. The chemical classification of vancomycin is
Glycopeptides. Vancomycin is a branched tricyclic glycosylated peptide with bactericidal
activity against most organisms and bacteriostatic effect on enterococci. At a site different
from that of penicillins and cephalosporins, vancomycin binds tightly to the
D-alanyl-D-alanine portion of cell wall precursors, thereby interfering with bacterial cell wall synthesis.
This leads to activation of bacterial autolysins that destroy the cell wall by
lysis. Vancomycin may also alter the permeability of bacterial cytoplasmic membranes and
[image:2.595.175.423.272.465.2]may selectively inhibit RNA synthesis.
Fig. 1: Structure of Vancomycin.
The molecular formula is C66H75Cl2N9O24
Vancomycin is an antibiotic used to treat a number of bacterial infections. It is used as the
treatments of complicated skin infections, bloodstream infections, endocarditis, bone and
joint infections and meningitis caused by methicillin-resistant Staphylococcus
aureus. Vancomycin Injection is available in market as 5 mg/mL concentration.
In the literature, several analytical techniques like HPLC, GC, UPLC, ICP-MS, ICP-OES
methods including Voltammetric and UV spectrophotometric methods have been referred for
determination of Vancomycin drug in Vancomycin Injection. The main purpose of the
present study was to establish relatively simple, sensitive and validated liquid
chromatographic method for the determination of Vancomycin in Vancomycin Injection. The
method was validated by determining its accuracy, precision and linearity as per ICH
Experiment
Materials and Methods: Procured commercially available Vancogen 500mg/mL from Alkem Laboratories as a sample, Waters xterra RP18, 150mm x 3.9mm, 5µm HPLC column,
Acetonitrile, Methanol, monobasic ammonium phosphate and HPLC grade water (Qualigens)
were procured from market. Vancomycin Working standard was procured from the Centaur
Laboratories Pvt. Ltd as a gift material.
Instrumentation: UPLC, Waters ACQUITY UPLC H-Class system with equipped Diode Array Detector and automatic injector with injection volume 5µl. The UPLC data was
analysed with Empower-3 Software, SARTOURIUS Analytical balance with model of
MSA225P-100-DA and FISHER SCIENTIFIC pH METER with model of XL15.
UPLC Conditions: The contents of mobile phase were mixture of 0.05M monobasic ammonium phosphate in Water and Acetonitrile in the ratio of 90:10 (v/v) respectively and
degassed for about 10 minutes. The run time was set about 8 minutes and the column
temperature was 45ºC. Prior to injection of Blank solution and sample solution, the column
was equilibrated for at least 60 minutes with the mobile phase flowing through the system.
The eluents were monitored at 230 nm.
Preparation of Diluent: Mixed HPLC grade water and methanol in the ratio of 90:10 (v/v).
Preparation of standard solutions (10 µg/mL): A standard stock solution of the Vancomycin drug was prepared by 10.0 mg of Vancomycin working standard was weighed
and transferred into a 100 mL volumetric flask and diluted to volume with the diluent and
mixed well. 10.0 mL of the above standard stock solution was pipetted into 100 mL
volumetric flask, diluted to volume with diluent and mixed well.
Preparation of Sample solution (10 mcg/mL): Accurately 1.0 mL of the sample solution (Vancogen 500mg/mL) was taken and diluted with diluent up to 250 mL and mixed well. 1.0
mL of this solution was pipetted into 200 mL volumetric flask, diluted to volume with diluent
and mixed well.
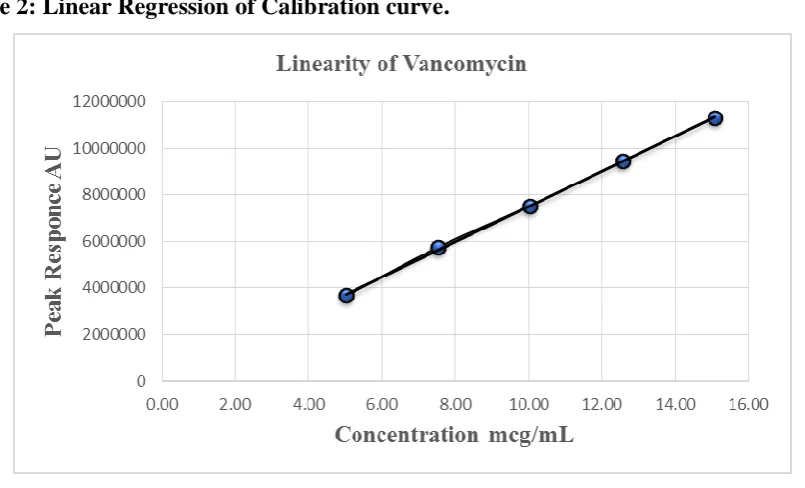
Linearity: Linearity of Detector response was established by plotting a graph of concentration (in mcg/mL) versus peak area and determining correlation coefficient,
y-intercept and slope. Vancomycin linearity solutions were prepared in the concentration range
(10 mcg/mL) and injected into the UPLC system. The detector response was found to be
[image:4.595.96.499.295.539.2]linear and the results were found to be within limit, refer table 1 and 2.
Table 1: Linearity data.
% of Linearity Level Concentration (mcg/mL) Peak Area
50 5.03 3664051
75 7.54 5746088
100 10.05 7528106
125 12.56 9431133
150 15.08 11301259
Correlation coefficient, NLT 0.997 0.999
Y-intercept -49657
Slope 754605.4
Table 2: Linear Regression of Calibration curve.
Precision studies: The precision of test method was evaluated by preparing six homogeneous sample preparations under prescribed conditions from the same sample lot and analysed as
per the developed procedure within the short interval time. 5 µL of sample solutions were
injected into the UPLC system, which was pre-saturated by the mobile phase and analytical
column. Before injecting the sample solutions in the sample set or sample sequence, system
suitability parameters were verified, which are related to UPLC system and the particular
analytical method integral limitations. All the system suitability parameters were within the
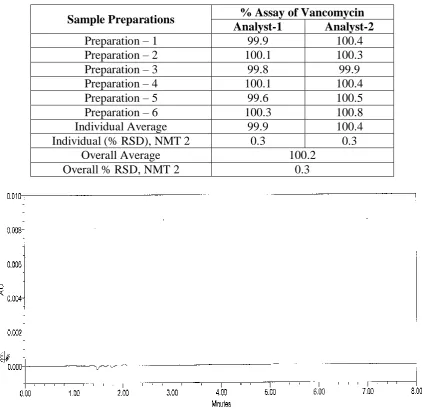
acceptance criteria and blank injection was represented to its good base line and
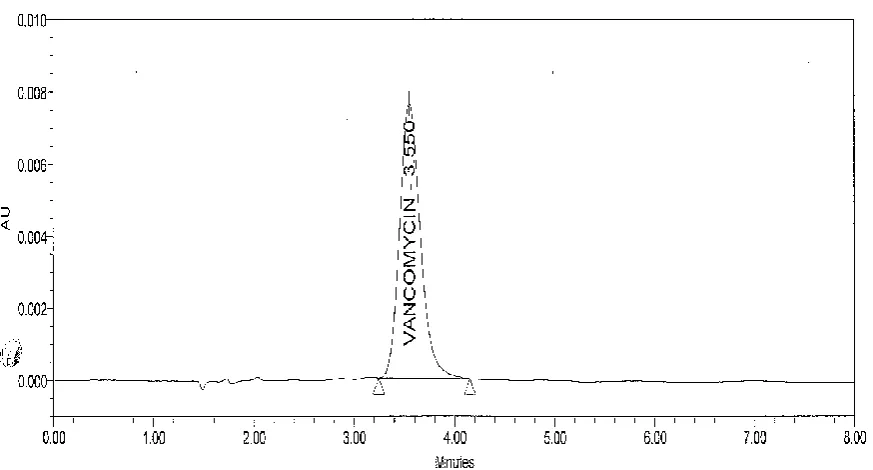
chromatography. The retention time was found as 3.5 minutes for Vancomycin active moiety.
peak area of the sample solution with that of the standard solution. The data are presented in
table 3. Typical chromatograms of Blank solution and Vancomycin sample solution as shown
[image:5.595.85.508.164.573.2]in fig 2 & 3.
Table 3: Results of Precision studies.
Sample Preparations % Assay of Vancomycin Analyst-1 Analyst-2
Preparation – 1 99.9 100.4
Preparation – 2 100.1 100.3
Preparation – 3 99.8 99.9
Preparation – 4 100.1 100.4
Preparation – 5 99.6 100.5
Preparation – 6 100.3 100.8
Individual Average 99.9 100.4
Individual (% RSD), NMT 2 0.3 0.3
Overall Average 100.2
Overall % RSD, NMT 2 0.3
Fig. 3: Typical Chromatogram of Vancomycin sample solution by UPLC.
Recovery Studies
Accuracy is the closeness of agreement between the conventional true value and the values
found. The value accepted as a conventional true value or the accepted reference value.
several methods of determining accuracy are available, at this analytical method development
of Vancomycin was verified by spiking method. Accuracy is often considered quantitatively
expressed as measurement uncertainty. There are different approaches for measurement
uncertainty estimation, but in practice the approach based on validation data is often the most
convenient.
The Vancomycin drug was prepared as recovery solutions with respective concentrations of
method range and injected into the UPLC system. Results of recovery study are shown in
table 4. The study was done from about 50% (5 mcg/mL) to about 150% (15 mcg/mL) level
Table 4: Results of Recovery studies. Recovery
Level Preparations
% RECOVERY
Injection-1 Injection-2 Mean Overall Mean 50% Level
Preparation -1 100.3 100.6 100.2
100.3
Preparation -2 100.6 100.5 100.4
Preparation -3 100.1 100.2 100.1
100% Level
Preparation -1 100.2 100.3 100.8
100.4
Preparation -2 100.7 100.5 100.2
Preparation -3 100.5 100.3 100.1
150% Level
Preparation -1 100.3 100.2 100.1
100.3
Preparation -2 100.4 100.5 100.6
Preparation -3 100.5 100.1 100.4
System Suitability: The system suitability tests were carried out on freshly prepared standard solution of Vancomycin. The parameters studied to evaluate the suitability of the system are
given in table 5.
Table 5: Validation Summary.
System suitability parameters Observed Values
Analyst- 1 Analyst-2 USP Tailing factor for Vancomycin peak in
standard solution (NMT 2.0) 1.1 1.1
Relative Standard Deviation for peak areas of Vancomycin from five replicate injections of standard solution (NMT 2.0%)
0.1 0.3
USP Plate count for Vancomycin peak in standard
solution (NLT 2000) 16653 11235
RESULTS AND DISCUSSION
The results of the study showed that the proposed RP-UPLC method is simple, rapid, precise
and accurate, which is useful for the routine determination of Vancomycin drug in
Vancomycin Injection. In this present developed of UPLC method, the standard and sample
preparation required less time and no tedious extraction were involved. A good linear
relationship (r2=0.999) was observed between the concentration range of 5.03 mcg/mL to
15.08 mcg/mL. Low values of standard deviation are indicative of the high precision of the
method. The assay of Vancomycin Injection was found as 100%. From the recovery studies it
was found that the Vancomycin was recovered which indicates high accuracy of the method.
The absence of additional unknown peaks in the chromatogram indicates non-interference of
CONCLUSION
Evaluated the critical process paraments of UPLC Analytical method development of
Vancomycin drug in Vancomycin Injection and optimised. Analytical method validation was
performed with suitable GMP and GLP guidelines. This analytical method is accurate,
precise, linear and robust. The developed and validated method is exactly suitable to regular
quality control testing at pharmaceutical industries.
ACKNOWLEDGEMENTS
The author is grateful to the Management of VelTech University for their encouragement and
providing the necessary facilities to carry out the research work.
REFERENCES
1. United States National Institutes of Health, 2011, http://clinicaltrials.gov/
ct2/results?term=bendamustine&no unk=Y (accessed 1.11.11).
2. J. Teichert, F. Baumann, Q. Chao, C. Franklin, B. Bailey, L. Hennig, K. Caca, K.
Schoppmeyer, U. Patzak, R. Preiss, Cancer Chemother. Pharmacol, 2007; 59: 759.
3. US FDA, 2001, w.fda.gov/downloads/Drugs/GuidanceComplianceRegulatory
Information/Guidances/ucm070107.
A. Mirkou, B. Vignal, S. Cohen, M. Guillaumont, O. Glehen, J. Guitton, J. Chromatogr. B:
Analyt. Technol. Biomed. Life Sci., 2009; 877: 3089.
4. E. Watson, P. Dea, K.K. Chan, J. Pharm. Sci., 1985; 74: 1283.
5. Vancomycin injection http://www.empr.com/vancomycin-injection/drug/3196/
6. Farber BB. Vancomycin: Renewed interest in an old drag. Eur J Clin Microbiol, 1984; 3:
1. doi: 10.1007/BF02032805.
7. West BC. Vancomycin-induced neutropenia. South Med J., 1981 Oct; 74(10):
1255–1256.
8. Aronoff GR, Sloan RS, Dinwiddie CB, Jr, Glant MD, Fineberg NS, Luft FC. Effects of
vancomycin on renal function in rats. Antimicrob Agents Chemother, 1981 Feb; 19(2):
306–308.
9. Cantu T, Yamanaka-Yuen N, Leitman P. Serum vancomycin concentrations: reappraisal
of their clinical value. Clin Infect Dis., 1994; 18: 533–543. doi: 10.1093/clinids/18.4.533.
10.Cutler N, Narang P, Lesko L, Ninos M, Power M, et al. Vancomycin disposition: the
importance of age. Clin Pharmacol Ther., 1984; 36(6): 803–810. doi:
11.Wold JS, Turnipseed SA. Toxicology of vancomycin in laboratory animals. Rev Infect
Dis., 1981 Nov-Dec; 3 Suppl: S224–S229.
12.FDA, Food and drug administration, Centre of drug evaluation and research, 1994.
13.ICH, International conference on harmonization, Harmonised tripartite guideline, Text
and methodology on validation of analytical procedures Q2(R1).
14.United states pharmacopoeia (USP), 2006; 1218.
15.C.Hazarathaiah Yadav; Periyasamy Murugan; International Journal of ChemTech
Research, CODEN (USA): IJCRGG ISSN: 0974-4290, 2015; 8(2): 860-868.
16.C. Hazarathaiah Yadav; D. Munirajasekhar; Journal of Chemical and Pharmaceutical
Research, 2014; 6(7): 109-116.
17.C. Hazarathaiah Yadav; Journal of Chemical and Pharmaceutical Research, 2015; 7(6):
562-567.
18.Mallibabu; P. Janakipathi; N. Appala Raju; International Journal of Chemistry and
Pharmaceutical Sciences IJCTPR, 2014; 2(3): 468-472.
19.Mallibabu; P. Janakipathi; N. Appala Raju; International Journal of Chemistry and
Pharmaceutical Sciences IJCPS, 2014; 2(6): 878-882.