ALMA RESOLVES THE PROPERTIES OF STAR-FORMING REGIONS IN A DENSE GAS DISK AT
z
∼
3
A. M. Swinbank1,2, S. Dye3, J. W. Nightingale3, C. Furlanetto3,4, Ian Smail1,2, A. Cooray5, H. Dannerbauer6,L. Dunne7,8, S. Eales9, R. Gavazzi10, T. Hunter11, R. J. Ivison8,12, M. Negrello13, I. Oteo-Gomez8,12, R. Smit1,2,
P. van der Werf14, and C. Vlahakis15,16 1
Institute for Computational Cosmology, Department of Physics, Durham University, South Road, Durham DH1 3LE, UK;a.m.swinbank@dur.ac.uk 2
Center for Extragalactic Astronomy, Department of Physics, Durham University, South Road, Durham DH1 3LE, UK 3
School of Physics and Astronomy, Nottingham University, University Park, Nottingham NG7 2RD, UK 4
CAPES Foundation, Ministry of Education of Brazil, Brasília/DF, 70040-020, Brazil 5
Astronomy Department, California Institute of Technology, MC 249-17, 1200 East California Boulevard, Pasadena, CA 91125, USA 6
Institut fur Astrophysik, Universitat Wien, Türkenschanzstrasse 17, 1180 Wien, Austria 7
Department of Physics and Astronomy, University of Canterbury, Private Bag 4800, Christchurch 8140, New Zealand 8
Institute for Astronomy, Royal Observatory Edinburgh, Blackford Hill, Edinburgh, EH9 3HJ, UK. 9
School of Physics and Astronomy, Cardiff University, Queen’s Buildings, The Parade, Cardiff CF24 3AA, UK 10
Institut d’Astrophysique de Paris, UMR7095 CNRS-Universite Pierre et Marie Curie, 98bis bd Arago, F-75014 Paris, France 11
National Radio Astronomy Observatory, 520 Edgemont Road, Charlottesville, VA, 22903, USA 12
European Southern Observatory, Karl-Schwarzschild-Str. 2, Garching, Germany 13
INAF, Osservatorio Astronomico di Padova, Vicolo Osservatorio 5, I-35122 Padova, Italy 14Leiden Observatory, Leiden University, P.O. Box 9513, NL-2300 RA Leiden, The Netherlands
15
Joint ALMA Observatory, Alonso de Cordova 3107, Vitacura, Santiago, Chile 16
European Southern Observatory, Alonso de Cordova 3107, Vitacura, Santiago, Chile
Received 2015 May 1; accepted 2015 May 18; published 2015 June 9
ABSTRACT
We exploit long baseline ALMA submillimeter observations of the lensed star-forming galaxy SDP 81 atz=3.042 to investigate the properties of the interstellar medium(ISM)on scales of 50–100 pc. The kinematics of the12CO gas within this system are welldescribed by a rotationally supported disk with an inclination-corrected rotation speed,vrot=320±20 km s−1,and a dynamical mass ofMdyn= (3.5± 1.0)× 1010Mwithin a radius of 1.5 kpc. The disk is gas-rich and unstable, with a Toomre parameter,Q=0.30±0.10, and so into star-forming regions with Jeans lengthLJ~130 pc. We identifyfive star-forming regions within the ISM on these scales and show that
their scaling relations between luminosity, line widths, and sizes are significantly offset from those typical of molecular clouds in local galaxies(Larson’s relations). These offsets are likely to be caused by the high external hydrostatic pressure for the ISM, Ptot/kB~ 40-+3020 × 107K cm−3, which is ∼104× higher than the typical ISM
pressure in the Milky Way. The physical conditions of the star-forming ISM and giant molecular clouds appear to be similar to those found in the densest environments in the local universe, such as those in the Galactic center.
Key words:galaxies: evolution –galaxies: high-redshift– galaxies: starburst
1. INTRODUCTION
Giant molecular clouds in local galaxies follow well-known scaling relations between CO velocity line width(σ)and their physical extent, R, with sµR1 2, and mean molecular gas density scales and sizeán(H )2 ñ µR-1(Larson1981; Bolatto
et al. 2008). These scalings reflect the dynamical state of the turbulent molecular gas in the interstellar medium(ISM). Since most of the stars in local,massive spheroids and elliptical galaxies appear to have formed early in the history of the universe (z~2–3), examining the physical, dynamical, and thermal state of the molecular gas within the ISM of galaxies at this epoch acquires special importance. However, to measure the properties of individual star-forming regions requires a spatial resolution of at least∼100 pc(sufficient to resolve sizes and velocity dispersions of the most massive giant molecular clouds). To date, this has only been achieved in a few rare examples of high-redshift galaxies whose images have been gravitationally lensed by massive galaxy clusters (see, e.g., Jones et al.2010; Livermore et al.2012,2015).
To test whether the scaling relations that govern the structure of local giant molecular clouds(GMCs)are valid in the dense and rapidly evolving ISM of high-redshift, gas-rich galaxies, in this Letter we exploit ALMA observations of SDP 81—a
star-forming galaxy at z = 3.042 whose image has been
gravitationally lensed by a factor 15.8 ± 0.7× by a massive,
foreground (z~0.299) galaxy (Dye et al. 2015). The
combination of long baselines, together with gravitational lensing means we are able to resolve the largest giant molecular clouds within the ISM (Solomon et al. 1987; Scoville & Good1989)on scales approaching 50 pc. We use the spatially resolved 1.0 mm (rest-frame 250μm)continuum imaging to identify the brightest star-forming regions, and measure their sizes, luminosities, and velocity dispersions. We use aΛCDM cosmology with H0=72 km s−1Mpc−1,Wm=0.27, andWL=1
m
- W (Spergel et al.2003), and a Chabrier IMF.
2. OBSERVATIONS AND SOURCE-PLANE RECONSTRUCTION
SDP 81 was identified from theH-ATLASsurvey as a bright submillimeter source atz =3.042 by Negrello et al. (2010). Optical imaging and spectroscopy also revealed the presence of
a massive foreground galaxy at z = 0.299 that lenses the
background galaxy (Negrello et al. 2014). Observations of SDP 81 with ALMA in its long baseline configuration (up to
15 km)were taken in 2014 October. These observations and
reduction are described by Vlahakis et al.(2015). Briefly, the
ALMA Band 7 (1.0 mm) continuum observations have a
resolution of 31 × 23 mas and reach a 1σ depth of 11μ
Jy beam−1. At the redshift of the galaxy, these observations
sample the rest-frame 250μm emission. Lower-frequency
observations of the 12CO(5-4) and continuum emission at 2.1 mm were also made, reaching a resolution of 56 × 50 mas. Dye et al. (2015) construct a detailed lens model for the
system using both the ALMA submillimeter andHubble Space
Telescope (HST) imaging (see also Rybak et al. 2015). The
best-fit lens model suggests that the background source
comprises three dominant components, a dense gas disk (that lies inside the caustic and gives rise to the bright submillimeter emission in the image plane)and two galaxy nuclei(which lie on—or just outside—the caustic), which are visible in theHST JH-band imaging. Dye et al. interpret the complex morphology as a merging system in which the gas disk is a result of an early stage interaction. In their model, the luminosity weighted amplification ismsubmm=15.8±0.7 andmopt=10.2±0.5 for the submillimeter and rest-frame optical emission, respectively.
Thus, correcting for lensing amplification, the observed
850μmflux density of the galaxy isS850 mm ~1.2mJy, which
is representative of the SMG population that has recently been studied in detail, in particular with ALMA(Hodge et al.2013;
Karim et al. 2013; Simpson et al. 2014). However, the
amplifications mean that the average sourceplane resolution is ∼50–100 pc—a factor∼30 × higher than that so far achieved in the non-lensed case(see, e.g., Ikarashi et al.2014; Simpson et al.2015).
3. ANALYSIS AND DISCUSSION
Using the lens modeling from Dye et al. (2015), we
reconstruct the source-plane morphology of SDP 81 at 1.0 mm
and 2.1 mm and show these in Figure 1. The dust continuum
morphology appears clumpy, and we isolate five of the
brightest star-forming regions from the highest-resolution
(1.0 mm)image(using the criteria that they are 5σabove the local background), and label these A–E. Independently, we also use theCLUMPFINDalgorithm(Williams et al.1994), which isolates clumps A–D, although it misses clump E. However,
none of our conclusions significantly change if we
include / exclude region E from the analysis below.
To measure the source-plane point-spread function(PSF)we reconstruct the beam in a grid of positions in the image plane and measure the PSF at each reconstructed position in the source plane. On average, the source-plane PSF has a
FWHM∼60 pc (Figure 1). In Figure 1 we also show the
one-dimensional 1.0 mm, 2.1 mm, and 12CO(5-4) emission
profiles extracted from the major morphological axis of the source. The dust continuum and12CO emission profiles are not perfectly aligned. However, at this resolution, offsets between the CO-emitting gas and continuum may be expected in regions with high star formation density where the12CO(5-4) (which
traces the warm and dense gas) is shock-heated, which
efficiently raises the gas temperature and density through mechanical heating, but does not heat the dust. Indeed, if the disk fragments into a number of large star-forming regions(as we discuss below), we expect large-scale shocks where the complexes interact.
In Figure 1 we also show the source-plane 12CO(5-4)
velocity field (see also Dye et al. 2015), which resembles a rotating system with a peak-to-peak velocity of 210 10 km
s−1 within 1.5 kpc. The best-fit disk model suggests an
inclination of θ = 40° ± 5°and thus a dynamical mass of
Mdyn= (3.5± 1.0)× 1010Mwithin a radius of 1.5 kpc. The
total gas mass for the disk, estimated from either the
(amplification corrected) 12CO(1-0) luminosity, or using the far-infrared SED and an appropriate dust-to-gas ratio is 2.7–3.9 × 10¹⁰M (Dye et al. 2015). Together these indicate that the central regions of the disk are baryon-dominated with a gas fraction of fgas ~ Mgas/Mdyn~70%–90%.
The Toomre parameterQcharacterizes the stability of a disk against local axisymmetric perturbations. Gas-rich disks with
Q<1should fragment and collapse into star-forming regions. Numerical simulations have also suggested that tidal interac-tions and dynamical friction should force the resulting star-forming regions toward the center of the galaxy, where they should coalesce to form a bulge(which in turn stabilizes the disk against further collapse; see, e.g., Genzel et al. 2008; Ceverino et al.2010). The Toomre parameter is calculated by Q=s kr /pGSgas, whereκ=a Vmax/Ris the epicycic frequency (witha = 3),sr is the line of sight velocity dispersion, and
gas
S is the mass surface density of the gas(Toomre1964). For
SDP 81, we derive Q = 0.30 ± 0.10, which is lower than
typical for the gas in local ULIRGs (Q~1; Downes &
Solomon1998), and slightly lower than the average ToomreQ of other gas-rich star-forming z~2 galaxies (á ñQ = 0.85 ± 0.13; Genzel & Förster Schreiber2014—although their sample also extend down to comparable values,Q=0.18±0.02).
This global instability will cause large, dense gas clouds to form in the molecular gas. The fragmentation of the gas occurs on scales of the Jeans length,LJwhich can be estimated using
the gas surface density and average gas velocity dispersion according toLJ=psr2 8GSgas. For SDP 81, withSgas=4±
1 × 10⁹M kpc2 and sr= 30–35 km s−1 we estimate
LJ 130 60 200
= -+ pc. If the gas fragments on these scales, the
corresponding masses of the clouds that form should be
G
r 4 2
gas
s S ~1–2 × 10⁸M.
Given that our source-plane resolution is at least comparable to the Jeans length, we investigate the properties of the star-forming regions on these scales. As Figure 1 shows, the disk contains several bright star-forming regions (A–E) and we measure their sizes, luminosities, and velocity dispersions
(using the beam-corrected velocity dispersion map for the
velocity dispersions; Davies et al.2011). In allfive regions the 12
CO(5-4)hasintrinsic velocity dispersions of 10–35 km s−1
(Table1). To estimate sizes for the molecular gas associated with these regions, we use two approaches. First, we fit the submillimeter light profile with Gaussian profiles(centered on each star-forming region; Figure1). Second, we measure the
area subtended by a contour that is 5σ above the local
background. The resulting sizes(deconvolved for the source-plane PSF)are FWHM=170–310 pc, which is comparable to theinitialfragmentation scale. We also estimate the molecular gas mass in the vicinity of the star-forming regions using the 12CO(5-4) line luminosity and account for both the local
background and the12CO(1-0)/12CO(5-4)luminosity ratio in velocity bins (see Dye et al. 2015), obtaining gas masses of
Mgas,clumps = 1–5 × 10⁸M. These masses are consistent with
those derived from using their line width and sizes withMdyn =Cs2 R/G withC =5—as approriate for a uniform density sphere—with Mdyn/MCO =1.5±0.5).
In Figure2 we compare the velocity dispersions, luminos-ities, and sizes of the star-forming regions in SDP 81 with similar measurements for GMCs in the local universe
quiescent galaxies; Bolatto et al.2008), and with the properties of GMCs and star-forming regions in more extreme environ-ments, including the Galactic center and the ISM of
SMM J2135−0102—a star-forming galaxy at z = 2.32
where similar measurements have been made (Swinbank
et al. 2011). At a fixed size, the velocity dispersions of the star-forming regions in SDP 81 appear to be ∼4× larger than those of GMCs in quiescent environments, but more similar to
those found in the Galactic center and other gas-rich environments. In the local universe, these offsets are usually attributed to high external pressures on the cloud surfaces due to high gas densities (Blitz & Rosolowsky 2004,2006; Keto et al.2005).
[image:3.612.52.560.50.348.2]To interpret the offsets in the properties of the star-forming regions in SDP 81, we use the dynamics and surface density of the molecular gas to estimate the ISM pressure (the kinetic
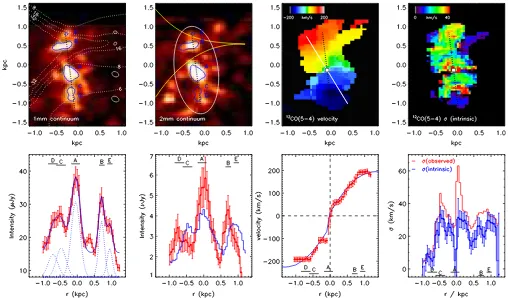
Figure 1.Source-plane images of SDP 81. Top left: source-plane 1.0 mm(rest-frame 250μm image)continuum image of SDP 81. The star-forming clumps, A–E, are identified by the solid contours. The black dashed line defines the major morphological axis and the white contours indicate the amplification map. The luminosity weighted amplification at 1.0 mm is 16.0±0.7. The white ellispes show the source-plane PSF at the location of the clumps(offset to the right-hand side of the image for clarity). Center left: source-plane 2.1 mm image with the clumps identified at 1.0 mm also highlighted. The solid line denotes the caustic curve from the best-fit lens model. Center right:12CO(5-4)velocityfield. The gas disk has an observed peak-to-peak velocity gradient of 210±10 km s−1. The solid white line shows the major kinematic axis and the dotted line denotes the major 1.0 mm morphological axis. Top right: beam-corrected12CO(5-4)line of sight velocity dispersion. Bottom left: one-dimensional profile of the 1.0 mm continuum emission extracted across the major morphological axis. We label thefive bright star-forming regions(A–E). The best-fit profiles are shown as dashed lines. Center left: one-dimensional profile of the 2.1 mm intensity extracted along the major axis of the 1.0 mm continuum with the12CO(5-4)intensity profile overlaid for comparison(blue). Center right: one-dimensional velocity profile of the gas disk with a best-fit dynamical model
overlaid. Right: one-dimensional velocity dispersion profile(red)and intrinsic, beam-corrected(ΔV/Δr)velocity dispersion profile(blue). In all of the lower panels we show the positions of the star-forming regions. The source-plane submillimeter morphology appears complex / clumpy, but with the star-forming regions embedded in a dense, rotating disk.
Table 1
Clump Properties
ID vclump Amplification FWHMclump sclump fCO(5 4)‐ r54 Mgas
(kms-1) (μ) (pc) (kms-1) (mJy km s−1
) (× 108M)
A −42±65 7.2±0.8 282±25 30±9 57±4 0.28±0.05 1.2
B 162±12 40.1±1.0 188±25 35±3 24±4 0.30±0.12 2.8
C −150±28 6.2±0.18 305±95 31±7 46±4 0.28±0.08 4.8
D −176±2 5.9±0.15 300±70 11±7 35±4 0.36±0.05 0.8
E 204±5 30.4±7.4 170±40 31±3 28±4 0.18±0.04 0.7
Notes.vclumpdenotes the velocity of the disk at the position of the star-forming region with respect to the systemic redshift. The amplifications are 1.0 mm emission
luminosity weighted values.FWHMclumphave been deconvolved for the source-plane PSF.sclumpis the velocity dispersion of the clump as measured from the intrinsic 12CO(5-4)velocity dispersion map.r
54is the ratio of the12CO(5-4)/12CO(1-0)luminosities derived from velocity and amplification maps(Dye et al.2015).Mgas
[image:3.612.41.577.497.581.2]pressure resulting from non-ordered mass motions). In a rotating gas disk, the mid-plane hydrostatic pressure is given by
P G
2 , (1)
tot gas gas
gas
p s
s
» S é
ë ê ê
êS +
æ è çç çç
ö ø ÷÷÷ ÷S
ù
û ú ú ú
whereSgas,S, andsgas,sare the surface density and velocity
dispersion of the gas and stars, respectively. In the Milky Way,
Ptot kB~1.4´104 cm−3 K (Elmegreen 1989). The stellar
mass of SDP 81 estimated from the rest-frame UV/optical photometry isM= (6.6 1.9
2.6
-+ )× 1010M(Negrello et al.2014), although the stars appear to be offset by∼1.5 kpc from the dust and gas emission (Dye et al.2015), and thus we adoptM
3 × 10¹⁰Mas an upper limit on the stellar contribution within the gas disk. We also assume that the velocity dispersions of the gas and stars are comparable,sgas/s~1(although we allow
this to vary from 0.5–2 in the calculation below). Given the high gas surface density, the mid-plane hydrostatic pressure is high, Ptot/kB~ 40 20
30
-+ × 107K cm−3, and although we caution
that this value has considerable uncertainty, this pressure is 104× higher than the typical pressure in the Milky Way disk
(104K cm−3). This pressure is also∼10× higher than inferred for the ISM in more extreme environments, such as in the Galactic center or the Antennae(Keto & Myers1986; Wilson et al.2003; Rosolowsky & Blitz2005). However, the compact disks of some ULIRGs, with high gas surface densities
(5´103M pc−2; Downes & Solomon 1998), may also result in comparably high pressures. Finally, we note that the implied pressure in SDP 81 is compatible with recent hydrodynamic models, which suggests that the typical pressure in the ISM of star-forming galaxies should increase from ∼104K cm−2atz=0.1 to∼106–107K cm−2atz=2, reaching ∼109K cm−2in some systems(Crain et al.2015).
To relate the pressure to the properties of the star-forming regions, we use “Larson’s relations” for turbulent molecular
clouds. Following Elmegreen(1989), the velocity dispersion– size and mass–size relations can be cast as
P k R
10 K cm pc (2)
ext B
4 3
1 4 1 2 s=sæ
è
ççç öø÷÷÷ æ è çç ç
ö ø ÷÷÷ ÷
-◦
and
( )
M H 290 P k R M
10 cm K pc , (3)
2
ext B 4 3
1 2 2
= æ
è
ççç öø÷÷÷ æ è çç ç
ö ø ÷÷÷ ÷
-
with s◦ = 1.2 km s−1 (Larson 1981). Using Equation (2), a pressure of 104× that of the Milky Way therefore suggests that the velocity dispersions of the clouds within the ISM of SDP 81 should be10× those in the Milky Way, respectively(at afixed size). The average velocity dispersion of the clumps in SDP 81 is four times larger at afixed size than predicted from GMCs in the Milky Way, and although this is lower than the factor of 10× predicted for pressure induced offsets alone, we reiterate that this is a simplified model that nevertheless relates the offsets in the scaling relations for GMCs with the gas densities and pressures in the ISM. Finally, in Figure 2 we plot the mass– radius relation for a similar range of quiescent and extreme environments in both the Milky Way and other nearby galaxies and plot the positions of star-forming regions in SDP 81, which are again offset to higher masees by a factor∼10×(at afixed size)with respect to those of GMCs in quiescent environments. This can also be attributed to the high turbulent pressure
(Equation(3)). However, it is interesting to note that they do not appear as massive as the star-forming regions in SMM J2135
−0102, although the latter is a natural consequence of the mass scale for collapse within the disk given their relative velocity dispersions and gas surface densities (sSMM J2135/sSDP81~ 2.3
[image:4.612.91.529.52.235.2]andSgas,SMM J2135/Sgas,SDP81~2), which results in a mass scale
difference for the clumps of Mcl,SMMJ2135/Mcl,SDP81~ 25—
consistent with Figure1.
4. CONCLUSIONS
Using long baseline ALMA observations, we have mapped the distribution of star formation and molecular gas in the
lensed, star-forming z = 3.042 galaxy, SDP 81, on physical
scales of ∼50–100 pc. The 12CO(5-4) dynamics suggest that the molecular gas is located in a disk with an inclination-corrected rotation speed of vrot = 320 ± 20 km s−1 and a
dynamical mass of Mdyn = (3.5 ±1.0)× 1010M within a radius of 1.5 kpc.
The gas disk appears to be Toomre unstable, Q= 0.30±
0.10. This instability will cause large, dense star-forming regions to collapse on scales of the Jeans length,LJ=130 60
200
-+
pc. We identifyfive star-forming regions on these scales in the
rest-frame 250μm continuum and measure their sizes,
luminosities, and CO velocity dispersions. We show that these star-forming regions do not lie on the local relations for GMCs, but are instead systematically offset such that the velocity dispersion is∼4× higher than typical GMCs at afixed size.
The gas dynamics and surface density suggest that the ISM should be highly pressurized, and we estimate a mid-plane hydrostatic pressure that is ∼104× higher than typically found in the Milky Way. These high pressures appear to be responsible for the offsets in the scaling relations of the star-forming regions compared to those of typical GMCs in galaxies in the local universe. Within the star-forming ISM of this dense gas disk, the physical conditions appear to be similar to those only seen in the densest environments in the local universe
(see, e.g., Kruijssen & Longmore2013).
We would like to thank the anonymous referee for a constructive report on this paper. A.M.S. acknowledges an
STFC Advanced Fellowship (ST/H005234/1) and the
Lever-hume foundation. I.R.S. acknowledges STFC(ST/I001573/1), the ERC Advanced Grant DUSTYGAL 321334, and a Royal Society/Wolfson Merit Award. C.F. acknowledges CAPES funding(proc. 12203-1). We also thank Padelis Papadopoulos for useful discussions. This paper uses data from ALMA program ADS/JAO.ALMA#2011.0.00016.SV. ALMA is a
partnership of ESO, NSF (USA), NINS (Japan), NRC
(Canada), NSC and ASIAA (Taiwan), and KASI (Republic of Korea)and the Republic of Chile. The JAO is operated by ESO, AUI/NRAO and NAOJ.
REFERENCES
Blitz, L., & Rosolowsky, E. 2004,ApJL,612, L29 Blitz, L., & Rosolowsky, E. 2006,ApJ,650, 933
Bolatto, A. D., Leroy, A. K., Rosolowsky, E., Walter, F., & Blitz, L. 2008, ApJ,686, 948
Ceverino, D., Dekel, A., & Bournaud, F. 2010,MNRAS,404, 2151 Crain, R. A., Schaye, J., Bower, R. G., et al. 2015,MNRAS,450, 1937 Davies, R., Förster Schreiber, N. M., Cresci, G., et al. 2011,ApJ,741, 69 Downes, D., & Solomon, P. M. 1998,ApJ,507, 615
Dye, S., Furlanetto, C., Swinbank, A. M., et al. 2015, MNRAS, submitted (arXiv:1503.08720)
Elmegreen, B. G. 1989,ApJ,344, 306
Genzel, R., Burkert, A., Bouché, N., et al. 2008,ApJ,687, 59
Genzel, R., Förster Schreiber, N. M., Rosario, D., et al. 2014,ApJ,796, 7 Hodge, J. A., Karim, A., Smail, I., et al. 2013,ApJ,768, 91
Ikarashi, S., Ivison, R. J., Caputi, K. I., et al. 2014, ApJ, submitted (arXiv:1411.5038)
Jones, T. A., Swinbank, A. M., Ellis, R. S., Richard, J., & Stark, D. P. 2010, MNRAS,404, 1247
Karim, A., Swinbank, A. M., Hodge, J. A., et al. 2013,MNRAS,432, 2 Keto, E., Ho, L. C., & Lo, K. 2005,ApJ,635, 1062
Keto, E. R., & Myers, P. C. 1986,ApJ,304, 466
Kruijssen, J. M. D., & Longmore, S. N. 2013,MNRAS,435, 2598 Larson, R. B. 1981,MNRAS,194, 809
Livermore, R. C., Jones, T., Richard, J., et al. 2012,MNRAS,427, 688 Livermore, R. C., Jones, T. A., Richard, J., et al. 2015,MNRAS,450, 1812 Negrello, M., Hopwood, R., De Zotti, G., et al. 2010,Sci,330, 800 Negrello, M., Hopwood, R., Dye, S., et al. 2014,MNRAS,440, 1999 Rosolowsky, E., & Blitz, L. 2005,ApJ,623, 826
Rybak, M., McKean, J. P., Vegetti, S., Andreani, P., & White, S. D. M. 2015, MNRAS, in press(arXiv:1503.02025)
Scoville, N. Z., & Good, J. C. 1989,ApJ,339, 149
Simpson, J. M., Smail, I., Swinbank, A. M., et al. 2015,ApJ,799, 81 Simpson, J. M., Swinbank, A. M., Smail, I., et al. 2014,ApJ,788, 125 Solomon, P. M., Rivolo, A. R., Barrett, J., & Yahil, A. 1987,ApJ,319, 730 Spergel, D. N., Verde, L., Peiris, H. V., et al. 2003,ApJS,148, 175 Swinbank, A. M., Papadopoulos, P. P., Cox, P., et al. 2011,ApJ,742, 11 Toomre, A. 1964,ApJ,139, 1217
Vlahakis, C., Hunter, T. R., Hodge, J. A., et al. 2015, ApJL, in press (arXiv:1503.02652)
Williams, J. P., de Geus, E. J., & Blitz, L. 1994,ApJ,428, 693