Surgical lung biopsy for the diagnosis of interstitial lung disease in England: 1997-2008
Supplementary material
Additional methods
Selection of codes for interstitial lung disease
ICD-10 codes
J84.1 – Other interstitial pulmonary diseases with fibrosis
J84.8 – Other specified interstitial pulmonary diseases
J84.9 – interstitial pulmonary disease, unspecified
D86.0 – sarcoidosis of lung
J67.9 – hypersensitivity pneumonitis due to unspecified organic dust
J99.0 – rheumatoid lung disease
J99.1 – respiratory disorders in other diffuse connective tissue disorders
ICD-9 codes – used for initial search, but not required as admissions prior to 1997 featuring these
codes were dropped
515 – Post-inflammatory pulmonary fibrosis
5163 – Idiopathic fibrosing alveolitis
517.2 – Lung involvement in systemic sclerosis
517.8 – lung involvement in other diseases classified elsewhere
Exclusion of patients where surgical lung biopsy was not the primary operation coded
The Hospital Episodes Statistics dataset contains records for up to 24 procedures carried out during
an inpatient episode. The first operation record is generally the main or most resource intensive
procedure. We initially identified all patients with
any
record for a surgical lung biopsy. In the vast
majority of cases this was coded as the primary operation, but in some cases it was coded as the
second or subsequent operation. In some of these cases, it was clear that surgical lung biopsy was
the most significant procedure, despite not being coded in the primary position.
where the surgical lung biopsy seemed a reasonable ‘secondary’ procedure - for example, alongside
a cardiac operation, where a lung biopsy might be performed at the same time. Any cases where
there was doubt about the nature of the biopsy - for example, where the primary code was for
biopsy of pleural lesion - were excluded.
Details of distinction between ‘elective’ and ‘non-elective’ operations
[image:2.595.139.365.399.584.2]The Hospital Episodes Statistics dataset contains a variable specifying whether procedures are
elective or non-elective (‘admission method’) but this was not available in our extract. We therefore
used the ‘waiting time’ variable as a surrogate: this gives the length of time between the ‘decision to
admit’ and the actual admission date. This variable was only valid for elective admissions: when it
was missing, we assumed this was a non-elective admission. These records either had no valid
decision-to-admit date or a decision-to-admit date that was identical to the admission date.
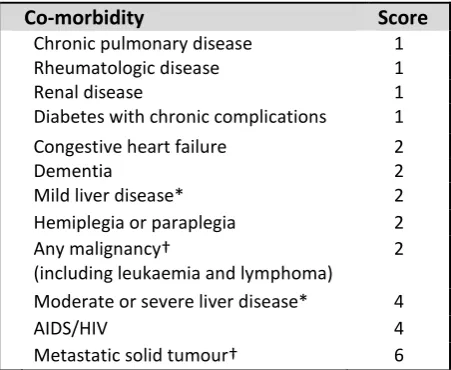
Figure E1
How to calculate the updated Charlson score (used with permission of Oxford University
Press).
Co-morbidity
Score
Chronic pulmonary disease 1
Rheumatologic disease 1
Renal disease 1
Diabetes with chronic complications 1
Congestive heart failure 2
Dementia 2
Mild liver disease* 2
Hemiplegia or paraplegia 2
Any malignancy†
(including leukaemia and lymphoma)
2
Moderate or severe liver disease* 4
AIDS/HIV 4
Metastatic solid tumour† 6
*Patients can score for either ‘mild liver disease’ or ‘moderate to severe liver disease’ †Patients can score for either ‘any malignancy’ or ‘metastatic solid tumour’
Quan H
et al.
Updating and Validating the Charlson Comorbidity Index and Score for Risk
Adjustment in Hospital Discharge Abstracts Using Data from 6 Countries.
Am J
Additional results
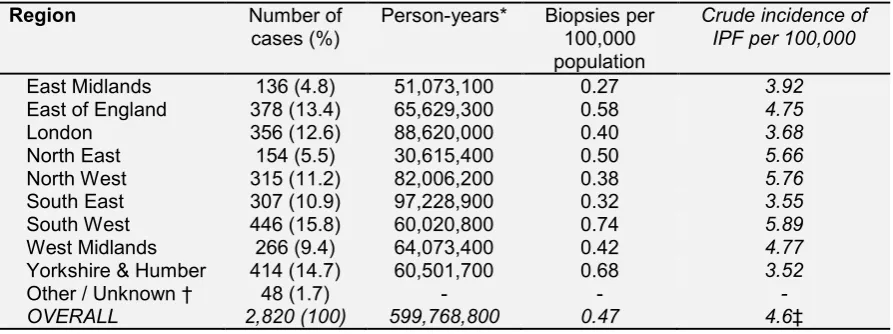
Table E1 – Number of biopsies per region
Region Number of
cases (%) Person-years* Biopsies per 100,000 population
Crude incidence of IPF per 100,000
East Midlands 136 (4.8) 51,073,100 0.27 3.92
East of England 378 (13.4) 65,629,300 0.58 4.75
London 356 (12.6) 88,620,000 0.40 3.68
North East 154 (5.5) 30,615,400 0.50 5.66
North West 315 (11.2) 82,006,200 0.38 5.76
South East 307 (10.9) 97,228,900 0.32 3.55
South West 446 (15.8) 60,020,800 0.74 5.89
West Midlands 266 (9.4) 64,073,400 0.42 4.77
Yorkshire & Humber 414 (14.7) 60,501,700 0.68 3.52
Other / Unknown † 48 (1.7) - - -
OVERALL 2,820 (100) 599,768,800 0.47 4.6‡
*Person-years: this was calculated by adding together mid-year population estimates for each region for each year from 1997-2008, rounded to the nearest hundred persons – for example, the mid-year population estimate for the East Midlands for 1997 was 4.1 million, rising to 4.4 million in 2008, giving a cumulative total of 51 million person-years as shown above. Population statistics from the Office of National Statistics, accessed November 2015 from
http://www.ons.gov.uk/ons/publications/re-reference-tables.html?edition=tcm%3A77-162632 and http://www.ons.gov.uk/ons/publications/re-reference-tables.html?edition=tcm%3A77-315018.
Biopsies per 100,000 calculated by dividing cases by person-years for each region, then multiplying by 100,000.
† ‘Other’ includes patients with a postcode from Scotland or Wales who attended English hospitals.
‡ Overall incidence across United Kingdom (ie including Scotland/Wales/N Ireland). Data from Gribbin et al (2006) Incidence and mortality of idiopathic pulmonary fibrosis and sarcoidosis in the UK. Thorax. 61:980-985. doi:
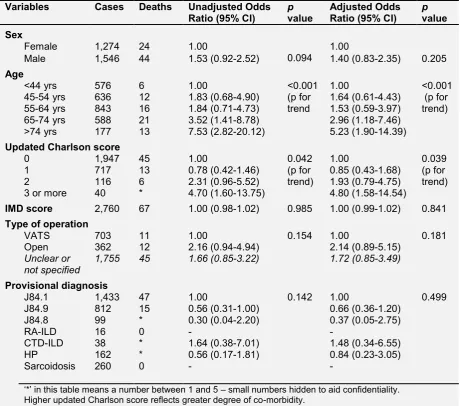
Table E2– Multivariable analysis – associations with death within 30 days of surgical lung
biopsy for interstitial lung disease
Variables Cases Deaths Unadjusted Odds
Ratio (95% CI) pvalue Adjusted Odds Ratio (95% CI) pvalue Sex
Female 1,274 24 1.00
0.094 1.00
Male 1,546 44 1.53 (0.92-2.52) 1.40 (0.83-2.35) 0.205
Age
<44 yrs 576 6 1.00 <0.001
(p for trend
1.00 <0.001
(p for trend)
45-54 yrs 636 12 1.83 (0.68-4.90) 1.64 (0.61-4.43)
55-64 yrs 843 16 1.84 (0.71-4.73) 1.53 (0.59-3.97)
65-74 yrs 588 21 3.52 (1.41-8.78) 2.96 (1.18-7.46)
>74 yrs 177 13 7.53 (2.82-20.12) 5.23 (1.90-14.39) Updated Charlson score
0 1,947 45 1.00 0.042
(p for trend)
1.00 0.039
(p for trend)
1 717 13 0.78 (0.42-1.46) 0.85 (0.43-1.68)
2 116 6 2.31 (0.96-5.52) 1.93 (0.79-4.75)
3 or more 40 * 4.70 (1.60-13.75) 4.80 (1.58-14.54)
IMD score 2,760 67 1.00 (0.98-1.02) 0.985 1.00 (0.99-1.02) 0.841 Type of operation
VATS 703 11 1.00 0.154 1.00 0.181
Open 362 12 2.16 (0.94-4.94) 2.14 (0.89-5.15)
Unclear or
not specified 1,755 45 1.66 (0.85-3.22) 1.72 (0.85-3.49)
Provisional diagnosis
J84.1 1,433 47 1.00 0.142 1.00 0.499
J84.9 812 15 0.56 (0.31-1.00) 0.66 (0.36-1.20)
J84.8 99 * 0.30 (0.04-2.20) 0.37 (0.05-2.75)
RA-ILD 16 0 - -
CTD-ILD 38 * 1.64 (0.38-7.01) 1.48 (0.34-6.55)
HP 162 * 0.56 (0.17-1.81) 0.84 (0.23-3.05)
Sarcoidosis 260 0 - -
‘*’ in this table means a number between 1 and 5 – small numbers hidden to aid confidentiality. Higher updated Charlson score reflects greater degree of co-morbidity.
IMD: index of multiple deprivation (lower score = least deprived); VATS: video-assisted thoracoscopic surgery; J84.1: other interstitial pulmonary disease with fibrosis; J84.9: interstitial pulmonary disease, unspecified; J84.8: other specified interstitial pulmonary disease; RA-ILD (J99.0): rheumatoid lung disease; CTD-ILD (J99.1): respiratory disorders in other diffuse connective tissue disorders; HP (J67.9):
hypersensitivity pneumonitis due to unspecified organic dust; Sarcoidosis (D86.0): sarcoidosis of lung.
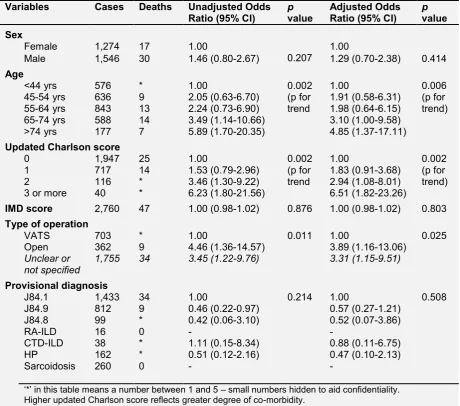
Table E3– Multivariable analysis – associations with in-hospital death following surgical
lung biopsy for interstitial lung disease
Variables Cases Deaths Unadjusted Odds
Ratio (95% CI) pvalue Adjusted Odds Ratio (95% CI) pvalue Sex
Female 1,274 17 1.00
0.207 1.00
Male 1,546 30 1.46 (0.80-2.67) 1.29 (0.70-2.38) 0.414
Age
<44 yrs 576 * 1.00 0.002
(p for trend
1.00 0.006
(p for trend)
45-54 yrs 636 9 2.05 (0.63-6.70) 1.91 (0.58-6.31)
55-64 yrs 843 13 2.24 (0.73-6.90) 1.98 (0.64-6.15)
65-74 yrs 588 14 3.49 (1.14-10.66) 3.10 (1.00-9.58) >74 yrs 177 7 5.89 (1.70-20.35) 4.85 (1.37-17.11) Updated Charlson score
0 1,947 25 1.00 0.002
(p for trend
1.00 0.002
(p for trend)
1 717 14 1.53 (0.79-2.96) 1.83 (0.91-3.68)
2 116 * 3.46 (1.30-9.22) 2.94 (1.08-8.01)
3 or more 40 * 6.23 (1.80-21.56) 6.51 (1.82-23.26)
IMD score 2,760 47 1.00 (0.98-1.02) 0.876 1.00 (0.98-1.02) 0.803 Type of operation
VATS 703 * 1.00 0.011 1.00 0.025
Open 362 9 4.46 (1.36-14.57) 3.89 (1.16-13.06)
Unclear or
not specified 1,755 34 3.45 (1.22-9.76) 3.31 (1.15-9.51)
Provisional diagnosis
J84.1 1,433 34 1.00 0.214 1.00 0.508
J84.9 812 9 0.46 (0.22-0.97) 0.57 (0.27-1.21)
J84.8 99 * 0.42 (0.06-3.10) 0.52 (0.07-3.86)
RA-ILD 16 0 - -
CTD-ILD 38 * 1.11 (0.15-8.34) 0.88 (0.11-6.75)
HP 162 * 0.51 (0.12-2.16) 0.47 (0.10-2.13)
Sarcoidosis 260 0 - -
‘*’ in this table means a number between 1 and 5 – small numbers hidden to aid confidentiality. Higher updated Charlson score reflects greater degree of co-morbidity.
IMD: index of multiple deprivation (lower score = least deprived); VATS: video-assisted thoracoscopic surgery; J84.1: other interstitial pulmonary disease with fibrosis; J84.9: interstitial pulmonary disease, unspecified; J84.8: other specified interstitial pulmonary disease; RA-ILD (J99.0): rheumatoid lung disease; CTD-ILD (J99.1): respiratory disorders in other diffuse connective tissue disorders; HP (J67.9):
hypersensitivity pneumonitis due to unspecified organic dust; Sarcoidosis (D86.0): sarcoidosis of lung.
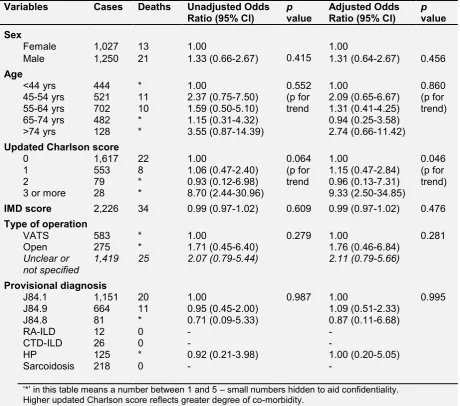
Table E4– Multivariable analysis – associations with death within 90 days of surgical lung
biopsy for interstitial lung disease – elective patients only
Variables Cases Deaths Unadjusted Odds
Ratio (95% CI) pvalue Adjusted Odds Ratio (95% CI) pvalue Sex
Female 1,027 23 1.00
0.161 1.00
Male 1,250 40 1.44 (0.86-2.43) 1.31 (0.77-2.23) 0.321
Age
<44 yrs 444 8 1.00 0.169
(p for trend
1.00 0.408
(p for trend)
45-54 yrs 521 16 1.73 (0.73-4.07) 1.42 (0.59-3.41)
55-64 yrs 702 20 1.60 (0.70-3.66) 1.32 (0.57-3.05)
65-74 yrs 482 12 1.39 (0.56-3.44) 1.12 (0.45-2.79)
>74 yrs 128 7 3.15 (1.12-8.87) 2.33 (0.81-6.68)
Updated Charlson score
0 1,617 43 1.00 0.112
(p for trend
1.00 0.036
(p for trend)
1 553 14 0.95 (0.52-1.75) 1.21 (0.63-2.33)
2 79 * 0.95 (0.23-4.00) 1.00 (0.24-4.27)
3 or more 28 * 6.10 (2.03-18.35) 7.20 (2.28-22.75)
IMD score 2,226 62 0.99 (0.97-1.01) 0.288 0.99 (0.97-1.01) 0.223 Type of operation
VATS 583 8 1.00 0.036 1.00 0.039
Open 275 8 2.15 (0.80-5.80) 1.87 (0.65-5.33)
Unclear or
not specified 1,419 47 2.46 (1.16-5.24) 2.49 (1.15-5.38)
Provisional diagnosis
J84.1 1,151 40 1.00 0.411 1.00 0.568
J84.9 664 20 0.86 (0.50-1.49) 0.94 (0.53-1. 66)
J84.8 81 * 0.35 (0.05-2.56) 0.41 (0.06-3.05)
RA-ILD 12 0 - -
CTD-ILD 26 0 - -
HP 125 * 0.45 (0.11-1.89) 0.47 (0.10-2.15)
Sarcoidosis 218 0 - -
‘*’ in this table means a number between 1 and 5 – small numbers hidden to aid confidentiality. Higher updated Charlson score reflects greater degree of co-morbidity.
IMD: index of multiple deprivation (lower score = least deprived); VATS: video-assisted thoracoscopic surgery; J84.1: other interstitial pulmonary disease with fibrosis; J84.9: interstitial pulmonary disease, unspecified; J84.8: other specified interstitial pulmonary disease; RA-ILD (J99.0): rheumatoid lung disease; CTD-ILD (J99.1): respiratory disorders in other diffuse connective tissue disorders; HP (J67.9):
hypersensitivity pneumonitis due to unspecified organic dust; Sarcoidosis (D86.0): sarcoidosis of lung.
For type of operation, ‘unclear or not specified’ mainly reflects older data from before a specific code for VATS was available. These cases are likely to be a combination of open and VATS procedures, with increasing numbers of VATS in later years.
Table E5– Multivariable analysis – associations with death within 30 days of surgical lung
biopsy for interstitial lung disease – elective patients only
Variables Cases Deaths Unadjusted Odds
Ratio (95% CI) pvalue Adjusted Odds Ratio (95% CI) pvalue Sex
Female 1,027 13 1.00
0.415 1.00
Male 1,250 21 1.33 (0.66-2.67) 1.31 (0.64-2.67) 0.456
Age
<44 yrs 444 * 1.00 0.552
(p for trend
1.00 0.860
(p for trend)
45-54 yrs 521 11 2.37 (0.75-7.50) 2.09 (0.65-6.67)
55-64 yrs 702 10 1.59 (0.50-5.10) 1.31 (0.41-4.25)
65-74 yrs 482 * 1.15 (0.31-4.32) 0.94 (0.25-3.58)
>74 yrs 128 * 3.55 (0.87-14.39) 2.74 (0.66-11.42) Updated Charlson score
0 1,617 22 1.00 0.064
(p for trend
1.00 0.046
(p for trend)
1 553 8 1.06 (0.47-2.40) 1.15 (0.47-2.84)
2 79 * 0.93 (0.12-6.98) 0.96 (0.13-7.31)
3 or more 28 * 8.70 (2.44-30.96) 9.33 (2.50-34.85)
IMD score 2,226 34 0.99 (0.97-1.02) 0.609 0.99 (0.97-1.02) 0.476 Type of operation
VATS 583 * 1.00 0.279 1.00 0.281
Open 275 * 1.71 (0.45-6.40) 1.76 (0.46-6.84)
Unclear or
not specified 1,419 25 2.07 (0.79-5.44) 2.11 (0.79-5.66)
Provisional diagnosis
J84.1 1,151 20 1.00 0.987 1.00 0.995
J84.9 664 11 0.95 (0.45-2.00) 1.09 (0.51-2.33)
J84.8 81 * 0.71 (0.09-5.33) 0.87 (0.11-6.68)
RA-ILD 12 0 - -
CTD-ILD 26 0 - -
HP 125 * 0.92 (0.21-3.98) 1.00 (0.20-5.05)
Sarcoidosis 218 0 - -
‘*’ in this table means a number between 1 and 5 – small numbers hidden to aid confidentiality. Higher updated Charlson score reflects greater degree of co-morbidity.
IMD: index of multiple deprivation (lower score = least deprived); VATS: video-assisted thoracoscopic surgery; J84.1: other interstitial pulmonary disease with fibrosis; J84.9: interstitial pulmonary disease, unspecified; J84.8: other specified interstitial pulmonary disease; RA-ILD (J99.0): rheumatoid lung disease; CTD-ILD (J99.1): respiratory disorders in other diffuse connective tissue disorders; HP (J67.9):
hypersensitivity pneumonitis due to unspecified organic dust; Sarcoidosis (D86.0): sarcoidosis of lung.
For type of operation, ‘unclear or not specified’ mainly reflects older data from before a specific code for VATS was available. These cases are likely to be a combination of open and VATS procedures, with increasing numbers of VATS in later years.
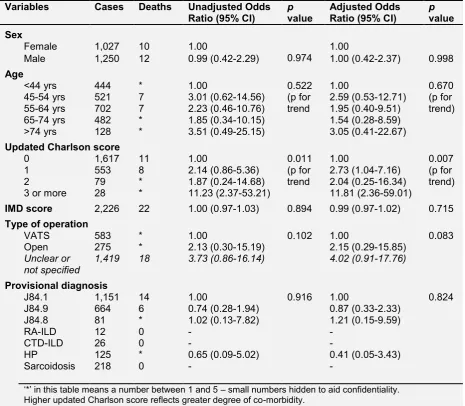
Table E6– Multivariable analysis – associations with in-hospital death following surgical
lung biopsy for interstitial lung disease – elective patients only
Variables Cases Deaths Unadjusted Odds
Ratio (95% CI) pvalue Adjusted Odds Ratio (95% CI) pvalue Sex
Female 1,027 10 1.00
0.974 1.00
Male 1,250 12 0.99 (0.42-2.29) 1.00 (0.42-2.37) 0.998
Age
<44 yrs 444 * 1.00 0.522
(p for trend
1.00 0.670
(p for trend)
45-54 yrs 521 7 3.01 (0.62-14.56) 2.59 (0.53-12.71)
55-64 yrs 702 7 2.23 (0.46-10.76) 1.95 (0.40-9.51)
65-74 yrs 482 * 1.85 (0.34-10.15) 1.54 (0.28-8.59)
>74 yrs 128 * 3.51 (0.49-25.15) 3.05 (0.41-22.67) Updated Charlson score
0 1,617 11 1.00 0.011
(p for trend
1.00 0.007
(p for trend)
1 553 8 2.14 (0.86-5.36) 2.73 (1.04-7.16)
2 79 * 1.87 (0.24-14.68) 2.04 (0.25-16.34)
3 or more 28 * 11.23 (2.37-53.21) 11.81 (2.36-59.01)
IMD score 2,226 22 1.00 (0.97-1.03) 0.894 0.99 (0.97-1.02) 0.715 Type of operation
VATS 583 * 1.00 0.102 1.00 0.083
Open 275 * 2.13 (0.30-15.19) 2.15 (0.29-15.85)
Unclear or
not specified 1,419 18 3.73 (0.86-16.14) 4.02 (0.91-17.76)
Provisional diagnosis
J84.1 1,151 14 1.00 0.916 1.00 0.824
J84.9 664 6 0.74 (0.28-1.94) 0.87 (0.33-2.33)
J84.8 81 * 1.02 (0.13-7.82) 1.21 (0.15-9.59)
RA-ILD 12 0 - -
CTD-ILD 26 0 - -
HP 125 * 0.65 (0.09-5.02) 0.41 (0.05-3.43)
Sarcoidosis 218 0 - -
‘*’ in this table means a number between 1 and 5 – small numbers hidden to aid confidentiality. Higher updated Charlson score reflects greater degree of co-morbidity.
IMD: index of multiple deprivation (lower score = least deprived); VATS: video-assisted thoracoscopic surgery; J84.1: other interstitial pulmonary disease with fibrosis; J84.9: interstitial pulmonary disease, unspecified; J84.8: other specified interstitial pulmonary disease; RA-ILD (J99.0): rheumatoid lung disease; CTD-ILD (J99.1): respiratory disorders in other diffuse connective tissue disorders; HP (J67.9):
hypersensitivity pneumonitis due to unspecified organic dust; Sarcoidosis (D86.0): sarcoidosis of lung.
For type of operation, ‘unclear or not specified’ mainly reflects older data from before a specific code for VATS was available. These cases are likely to be a combination of open and VATS procedures, with increasing numbers of VATS in later years.
Table E7– Multivariable analysis – associations with death within 90 days of surgical lung
biopsy for interstitial lung disease – data from 2005-2008 only
Variables Cases Deaths Unadjusted Odds
Ratio (95% CI) pvalue Adjusted Odds Ratio (95% CI) pvalue Sex
Female 568 17 1.00
0.652 1.00
Male 667 23 1.16 (0.61-2.19) 0.96 (0.49-1.90) 0.905
Age
<44 yrs 243 * 1.00 0.001
(p for trend
1.00 0.010
(p for trend)
45-54 yrs 255 * 0.95 (0.27-3.33) 0.93 (0.26-3.32)
55-64 yrs 373 11 1.45 (0.50-4.22) 1.46 (0.49-4.38)
65-74 yrs 281 9 1.58 (0.52-4.76) 1.50 (0.48-4.69)
>74 yrs 83 10 6.52 (2.16-19.69) 4.97 (1,53-16.19) Updated Charlson score
0 798 26 1.00 0.192
(p for trend
1.00 0.077
(p for trend)
1 366 9 0.75 (0.35-1.61) 1.05 (0.47-2.31)
2 45 * 0.67 (0.09-5.09) 0.62 (0.08-4.84)
3 or more 26 * 5.40 (1.74-16.79) 6.87 (2.02-23.39)
IMD score 1,196 39 1.00 (0.97-1.02) 0.733 1.00 (0.97-1.02) 0.819 Type of operation
VATS 631 14 1.00 0.071 1.00 0.119
Open 137 8 2.73 (1.12-6.65) 2.60 (1.01-6.71)
Unclear or
not specified 467 18 1.77 (0.87-3.59) 1.74 (0.83-3.67)
Provisional diagnosis
J84.1 548 25 1.00 0.128 1.00 0.531
J84.9 459 14 0.66 (0.34-1.28) 0.83 (0.41-1.68)
J84.8 43 0 - -
RA-ILD * 0 - -
CTD-ILD 14 0 - -
HP 73 0 - -
Sarcoidosis 93 * 0.23 (0.03-1.70) 0.38 (0.05-2.92)
‘*’ in this table means a number between 1 and 5 – small numbers hidden to aid confidentiality. Higher updated Charlson score reflects greater degree of co-morbidity.
IMD: index of multiple deprivation (lower score = least deprived); VATS: video-assisted thoracoscopic surgery; J84.1: other interstitial pulmonary disease with fibrosis; J84.9: interstitial pulmonary disease, unspecified; J84.8: other specified interstitial pulmonary disease; RA-ILD (J99.0): rheumatoid lung disease; CTD-ILD (J99.1): respiratory disorders in other diffuse connective tissue disorders; HP (J67.9):
hypersensitivity pneumonitis due to unspecified organic dust; Sarcoidosis (D86.0): sarcoidosis of lung.
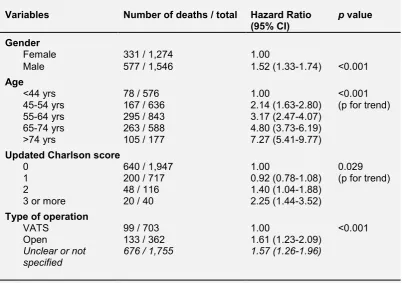
Table E8 –
Cox regression model for survival following surgical lung biopsy for ILD(multivariable model adjusted for gender, age, updated Charlson score and type of operation)
Variables Number of deaths / total Hazard Ratio
(95% CI) p value Gender
Female 331 / 1,274 1.00
Male 577 / 1,546 1.52 (1.33-1.74) <0.001
Age
<44 yrs 78 / 576 1.00 <0.001
(p for trend)
45-54 yrs 167 / 636 2.14 (1.63-2.80)
55-64 yrs 295 / 843 3.17 (2.47-4.07)
65-74 yrs 263 / 588 4.80 (3.73-6.19)
>74 yrs 105 / 177 7.27 (5.41-9.77)
Updated Charlson score
0 640 / 1,947 1.00 0.029
(p for trend)
1 200 / 717 0.92 (0.78-1.08)
2 48 / 116 1.40 (1.04-1.88)
3 or more 20 / 40 2.25 (1.44-3.52)
Type of operation
VATS 99 / 703 1.00 <0.001
Open 133 / 362 1.61 (1.23-2.09)
Unclear or not
specified 676 / 1,755 1.57 (1.26-1.96)
Higher updated Charlson score reflects greater degree of co-morbidity. VATS: video-assisted thoracoscopic surgery