The control and maintenance of desired
fl
ow patterns in bends of
different orientations
D. Zhao
a, R. Omar
b, M. Abdulkadir
c, L.A. Abdulkareem
d, A. Azzi
e, F. Saidj
e,
V. Hernandez Perez
f, B.N. Hewakandamby
b, B.J. Azzopardi
b,na
School of Engineering, London South Bank University, London, United Kingdom b
Fluids and Thermal Engineering Research Group, Faculty of Engineering, University of Nottingham, Nottingham, United Kingdom c
Department of Chemical Engineering, Federal University of Technology, Minna, Niger State, Nigeria d
Department of Petroleum Engineering, University of Zakho, Zakho, Northern Iraq
eFGMGP/LTPMP, University of Sciences and Technology Houari Boumedien (USTHB), Algiers, Algeria f
Department of Mechanical Engineering, National University of Singapore, Singapore
a r t i c l e i n f o
Article history: Received 3 March 2016 Received in revised form 30 July 2016
Accepted 14 September 2016 Available online 15 September 2016
Keywords: Gas-liquid Bends Void fraction Electrical tomography Conductance
a b s t r a c t
Multiphaseflows are common in industrial settings and bends in pipe lines cannot be avoided due to space limitations. Gas-liquid two phaseflows could form material discontinuities that could have adverse effect on productivity and the pipe network due to sudden variations resulting due to the rapid mo-mentumflux variations atfittings such as bends. Research into gas-liquidflow and bends can be mo-tivated by the effect of the bend on theflow downstream of it which could alter theflow pattern oc-curring and the performance of downstream equipment. Alternatively, the interest might come from what occurs in the bend itself, there could be dryout of thefilm on the walls and consequent damage to the heat transfer equipment. Here we present measurements made with a number of accurate and fast responding sensors on three cases, two on the effect of the bend and one considering effects in the bend. The results show that theflow transformations occur in two phaseflows depending on the orientation of the bend and the change could be captured using fast sweeping measurement techniques. We present the evidence of effectiveness of several types of measurement techniques that couldfit into various combinations of phases. The results, point to how to achieve certainflow patterns. Also recommenda-tions are provided regarding the position of any sensor installed to determineflow pattern.
&2016 The Authors. Published by Elsevier Ltd. This is an open access article under the CC BY license (http://creativecommons.org/licenses/by/4.0/).
1. Introduction
Gas-liquidflow occurs in a variety of industries in many pieces of equipment and the linking pipework between them as well as in the environment. Of the diverse geometries through which gas-liquidflows pass, bends are an almost overlooked component. Yet they are central to some equipment such as fired reboilers. It is also noted that volcanic conduits can include changes of direction, i.e., bends[1].
Now, bends, in many applications are just used to change the direction of a flow. However, it is important to understand the parameters required to define a bend. The first three parameters are the pipe diameter and the angle and radius of the bend. The angle of the bend, the angle between the inlet and outlet pipes, is most usually 90°or 180°. Because it is gas-liquidflow that is being considered where gravity can cause stratification, the orientation
of the inlet and outlet pipes must also be considered. It will be shown below that there are significant differences in going from horizontal to vertical and from vertical to horizontal. Finally there is the orientation of the bend. In the case of a 180°bend with both inlet and outlet pipes horizontal, whether the two pipes are in the same horizontal plane or whether the inlet or outlet pipe is on top can cause very noticeable difference to theflow as shown by Sa-kamoto et al.[2].
Control of the processes which affect the behaviour of gas-li-quidflows in bends and its consequences can be passive or active. The former can involve activities such as design prior to con-struction or via modifications. Active controls demands con-tinuous measurement of relevant variables and adjustments of flow rates or other parameters. Obviously, there is strong need for detailed knowledge of the distribution of the phases about the bend. This paper considers such information, that in the literature and particularly that generated by the authors of this paper. The implications for control will be discussed using two examples: (i) a fired reboiler with serpentine tubing and (ii) a novel combined bend/T-junction phase separator.
Contents lists available atScienceDirect
journal homepage:www.elsevier.com/locate/flowmeasinst
Flow Measurement and Instrumentation
http://dx.doi.org/10.1016/j.flowmeasinst.2016.09.003
0955-5986/&2016 The Authors. Published by Elsevier Ltd. This is an open access article under the CC BY license (http://creativecommons.org/licenses/by/4.0/). nCorresponding author.
U-bend case and 4 pipe diameter for the U-bend.
Fired reboilers are often used in refineries and other hydro-carbon processing plants to provide vapour where the boiling point of the hydrocarbon liquid is too high for steam to be used for heating. The tubing, usually of 0.1–0.15 m internal diameter, is fitted around the sides of the cylindrical or rectangular fire box. Theflow is divided into several streams in parallel and each of these passes through an up and down serpentine arrangement. A major problem that can affect these units is“coking”. Dry-out of the wallfilm in annular or churnflow in the tubes can result in a local increase of wall temperature which can lead to a breakdown of the higher molecular weight hydrocarbon and deposition of carbon, in the form of coke, on the walls. If not detected this can build up and block the pipes. It tends to occur at lower massflow rates. Indeed, a rule of thumb in the design of these units is that the massflux through each tube should be at least 1000 kg/m2s.
Chong et al.[6]developed a model for these units based on the annularflow model of Hewitt and Govan[7]which took into ac-count entrainment of liquid from the wallfilm and its redeposition back on to thefilm. For the serpentine geometry Chong et al. ad-ded the simplifying assumption that, at each U and inverted U bend, the drops entrained in the gasflow were deposited on to the film. This gave conditions at which thefilm dried out, which was usually just before a bend, and showed that theflow rate at which dryout occurs increases with increasing heatflux. For heatfluxes usually employed, the value 1000 kg/m2s was a conservative
va-lue. However, the calculations pointed out that if there was mal-distribution between the parallel flow paths, those with lower flow rates could suffer dryout and, hence, coking. Industry some-times uses a simple practical solution to prevent coking. The length of pipe just before the bend where dryout is most likely is insulated thus lowering the possibility of dryout.
Single or combinations of T-junctions, with one inlet and sev-eral outlets have been given serious consideration for use as gas-liquid phase separators. Azzopardi et al.[8]give details of apartial phase separator based on a bend/T-junction combination which was installed in a hydrocarbon processing plant and operated successfully until the plant shut down. It has been suggested that better positioning of the phases approaching the junction would improve separation efficiency. Sanchez-Silva et al. [9] have en-deavoured to do this by positioning a branch pipe on the outside of a 90°bend with inlet and outlet pipes placed horizontally. They studied the effect of gas and liquidflow rate and the angle of in-clination on the phase separation for slugflow approaching the bend. Increasing both gas and liquid flow rates increased the fraction of liquid taken off through the side arm. Baker et al. [10,11] used control of a valve on one of the outlet lines of a multiple T-junction separator to optimise the efficiency of phase separation. They determined that different valve settings were required for this optimum separation and used an ECT system to identify theflow pattern.
2. Review of previous work
Anderson and Hills[12], reported data on liquidfilm thickness, axial pressure profiles, gas velocity distribution, and droplet en-trainment in the annularflow regimes in a vertical inverted 180° return bend. The diameter and radius of curvature of the bend are 25 and 305 mm, respectively. They reported that an increase in film thickness on the inside of the bend can be attributed to the action of gravity and to the secondary flow existing in the gas phase. A change inflow pattern from annular to stratifiedflow in the bend at low liquidflow rates was observed. On the other hand, for the high liquidflow rates, a local maximum in thefilm thick-ness was seen on the inside and outside of the bend.
The distributions of waterfilms and entrained droplets in air– water annularflows in 180°horizontal bend were investigated by Balfour and Pearce[13]using sampling probes. The diameter and radius of curvature of the bend are 25 and 48.5 mm, respectively. They took a series of measurements with the probes positioned at 45°intervals around the tube exit and at varying radii. They con-cluded that in those annular flows where the air speed is high, many of the entrained droplets are thrown very rapidly to the wall and that the entrained fraction tends to be negligible for high quality annularflows where thefilms are thin.
Using needle probes to measure the local void fraction around an inverted U-bend attached to a 50.8 mm internal diameter pipe in the case of froth flow enabled Hoang and Davis [14] to de-termine the slip ratio, which was found to be greatly increased at the bend exit, relative to the entry, for low velocity conditions. These values diminished slightly in the downstream flow pipe. Later, Takemura et al. [5]presented experimental results on the flow behaviour, pressure drop characteristics and dryout char-acteristics from the Joule heating of gas-water two-phase flows through U-shaped and inverted U-shaped bends, each having an internal diameter of 18 mm. They compared the results obtained from both bends and concluded that for the U-shaped bends, the gas phaseflows along the inside of the bend, regardless of theflow rates of gas and water. Whilst in an inverted U-shaped bends, at lower gas and liquidflow rates, the tube wall at the outside of the bend at the angles of 150–180°around the bend is in contact with the gas phase. They also reported that the inverted U-shaped bends have a wider safety region against dryout than the U-shaped bends.
effect of the bend on the flow patterns is the considerable ex-pansion of the stratifiedflow regime. This conclusion confirmed the earlier work of Anderson and Hills[12].
James et al.[18]investigated the effect of a 90°horizontal bend on two-phaseflow using computational and experimental studies. In their simulations using the Eulerian-Lagrangian method, they presented a suggestion as to whether droplets of a given size de-posit in the bend. This they achieved by carrying out calculations using droplets in the size range of 10–500μmdiameters.
Experimental work in a horizontal 180° bend using air and water as the workingfluids was presented by Sakamoto et al.[2]. The diameter and radius of curvature of the bend are 24 and 135 mm, respectively. They employed the conductance type void probe to measure the liquid film thickness and an L-shaped stainless steel sampling tube to measure the local droplet flow rate. They reported the distributions of annular liquidfilm thick-ness and the local dropflow rate in the gas core in a straight pipe and at the end of three U-bends at horizontal to horizontal (up-ward), vertical upward, 45° upward to the horizontal. They claimed that the local flow rate of droplets in the gas core in horizontal pipeflow reaches a minimum near the lower wall of the pipe and a maximum near the upper wall.
The effect of 90°bends on two-phase air–silicone oilflows was investigated by Abdulkadir et al. [19] using advanced in-strumentation, electrical capacitance tomography (ECT), wire mesh sensor (WMS) and high speed camera. They mounted the ECT probes upstream of the bend while WMS was positioned immediately upstream or immediately downstream of the bend. The downstream pipe was maintained horizontal whilst the up-stream pipe was mounted either vertically or horizontally. The bend (R/D) was made of transparent acrylic resin. The superficial velocities of the air that they considered ranged from 0.05 to 4.73 m/s and for the silicone oil from 0.05 to 0.38 m/s. From an output from the tomographic equipment, they identified flow patterns using both the reconstructed images as well as the characteristic signatures of probability density function (PDF) plots of the time series of cross-sectional averaged void fraction.
The behaviour offilm fraction within a vertical 180°bend using air and water as the operating fluids has been investigated ex-perimentally by Abdulkadir et al.[20,21]. The diameter and radius of curvature of the bend are 127 and 381 mm, respectively. In the first paper they reported on measurements of cross-sectionalfilm fraction using conductance ring probes placed at 17 pipe dia-meters upstream of the bend, 45°, 90°and 135°into the bends and 21 pipe diameters downstream of the bend. They reported that the averagefilm fraction is higher in straight pipes than in bends and that the condition for which the liquid goes to the outside or in-side of the bend can be identified based on a modified form of Froude number, a proposalfirst made by Oshinowo and Charles [22]. The second paper [21] described measurements of film thickness distributions of film thickness around the pipe cir-cumference at different points around the bend. They employed air superficial velocities of 3.5–16.1 m/s and water superficial ve-locities from 0.02 to 0.2 m/s. The liquidfilm thickness distribution in the bend was measured with pin and wire probes. With the former for measuring thinfilms (up to 2.5 mm) outside the bend while the latter for thick liquid films inside the bend. These measurements have been supplemented by visual observation.
Kerpel et al.[23]investigated the behaviour of two-phaseflow up- and downstream of a sharp return bend. They used a return bend with a radius of curvature of 1 mm and an inner diameter of 8 mm. The refrigerant used is R134a; the mass flux was varied between 200–400 kg/m2and the vapour quality varied between
0 and 1. The bend orientation is vertical. Upwardflow as well as downwardflow through the bend was studied. Eight capacitance sensors were placed at several locations upstream and
downstream of the return bend. The series of void fraction from the sensors were compared in order to determine the presence and extent of the bend effect. They concluded that the disturbance due to the return bend stretches out, to at least 21.5 tube dia-meters downstream of the bend. Upstream of the bend, an effect was absent for downwardflow, for upwardflow a limited effect was observed.
Experimental measurements of single-phase and two-phase frictional characteristics and associated observations offlow pat-terns associated with a 90°bends were discussed in the paper by Hsu et al.[24]. The two bends have inner diameters of 5.5 and 9.5 mm with tube curvature ratio (2R/D) of 5.4 and 4.2, respec-tively. The bends were installed upward, horizontal or downward arrangement. They found that for single-phase flow, the bend friction factor was always greater than that of the straight tubes at the same Reynolds number. On the other hand, the bend friction factor values for a pipe diameter of 9.5 mm with smaller curvature ratio are greater than those from a diameter of 5.5 mm. the re-sultant two-phase frictional pressure drops of 90°bend were well predicted by the correlation of Sanchez-Silva [9]. For the two-phase frictional pressure gradient, the upward arrangement is greater than that of the horizontal arrangement due to swirled motion and liquidflow reversal.
Yadav et al. [25] reported experimental investigations con-cerning air–water two phase flow through a 2.25 mm circular mini-channel U-bend. They established the influence of radius of curvature by developing 2 mini-channel U-bends with radius of curvature as 6 mm and 12 mm. A T-junction was used as mixing geometry for air and water. The superficial gas and liquid velocities were in the range 0.0419–0.4192 m/s. At theseflow rates,fiveflow patterns were identified including plug, slug, bubbly, bubbly-plug and deformed plug. Flow pattern transition maps were developed as a function of radius of curvature. The influences of radius of curvature on hydrodynamics of Taylor bubbleflow such as void fraction, liquid hold up, Taylor bubble velocity, Taylor bubble and liquid slug length was investigated. The radius of curvature with otherflow parameters was found to have significant effect on two-phaseflow patterns, its transition boundaries and hydrodynamics of Taylor bubbleflow.
At Cranfield University, experiments have examinedflow in a serpentine geometry with vertical pipes[26,27]. The arrangement consisted of four pipes joined by U and inverted U bends starting with an upwards flow. Measurements were made on the first down and second up sections at 5, 30 and 46 pipe diameters from the preceding bend using Wire Mesh Sensor and local conductivity probes forfilm thickness which were mounted at very 90°around the circumference. It was reported that though there was an ob-vious asymmetry in the circumferentialfilm thickness profile at the 5D position, this was hardly noticeable by the 30D station.
3. Experimental instrumentation
A number of different of instruments and measurement sensors were used in this work. They are described below.
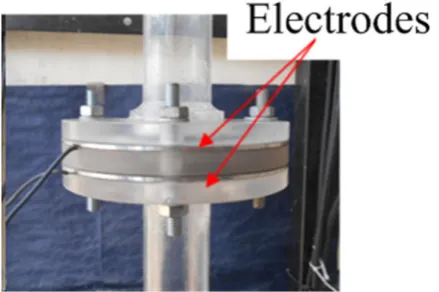
3.1. Electrical capacitance tomography (ECT)
system, whose electrodes are shown inFig. 1, was employed uti-lising software supported by TomoFlow Limited. More details can be found in Azzopardi et al.[31], Abdulkareem[32]and Abdulk-adir et al.[19].
A simplified variant of the approach has been proposed[33] which can be used to identifyflow patterns for a given set offlow rates using only selected electrode pairs.
3.2. Wire mesh sensor (WMS)
The capacitance WMS system, whose electrodes are shown in Fig. 2, is described in detail by da Silva et al.[34]can image the dielectric components in the pipeflow phases by measuring ra-pidly and continually the capacitances of the passingflow across several crossing points in the mesh. It consists of two planes of 24 stainless steel wires with 0.12 mm diameter, with a 2.78 mm wire separation within each plane and 2 mm axial plane displacement. It was noted that since the square sensor is installed in a circular tube, only 440 of the total 576 wire crossing points are within the radius of the tube. During the experiments, the transmitter lines are pulsed one after another. By measuring the signal of all crossing orthogonal receiver wires, the local capacitance at the crossing points in the mesh is determined. This capacitance signal is a measure for the amount of silicone oil, and thus indicates the local phase composition in the grid cell. Systematic tests have been carried out to test the accuracy of the WMS/ECT. Sharaf et al.[35] made simultaneous measurements with WMS and nuclear ab-sorption (gamma). The beam of the latter was positioned im-mediate below each of the wires in turn. The chordal average was obtained from both instruments and good agreement was achieved. Azzopardi et al.[36]made simultaneous measurements with WMS/ECT. Excellent agreement was found in the comparison of the time and cross-sectionally averaged void fractions.
3.3. Ring probes
Cross-sectionally averaged void fraction in two-phase gas-li-quid mixtures can be determined by measuring the conductance between twoflushed mounted ring probes. These werefirst em-ployed by Asali et al. [37], while Andreussi et al. [38] and Tso-chatzidis et al.[39]developed the theoretical bases regarding the response of this electrode configuration. Fossa[40]compared the phase distribution results measured with two flushed mounted parallel ring probes for annular, stratified and bubbleflow with the theoretical data available in the literature. The probes used in this work consist of two stainless steel ring electrodes mounted in acrylic resin housing (Fig. 3). They were carefully manufactured so that the electrodes had the same diameter as the test section. Details of the geometry can be found in Saidj et al.[41].
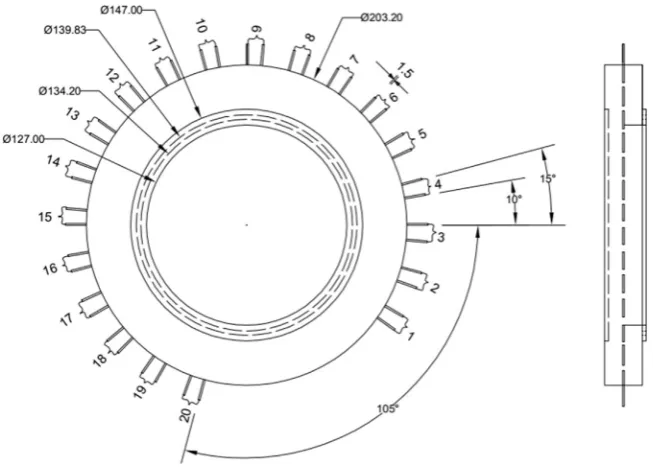
3.4. Pin probes
[image:4.595.61.274.55.368.2] [image:4.595.330.545.59.313.2] [image:4.595.329.549.586.732.2]For gas–liquid annularflow in which the liquid is electrically conducting, liquidfilm thickness can be determined by the mea-surements of the electrical conductance between two electrodes in contact with the liquidfilm. The measured liquidfilm thickness is Fig. 1. ECT sensor.
Fig. 2.WMS sensor.
assumed to be the value at the mid-point between the centres of the electrodes. Different electrode geometries of such as needle probes, parallel wire probes andflush mounted pin probes have been reported by researchers over the last decades[42–45]. Flush mounted pin probes are suitable for measuring very thin liquid films, typically up to 2.5 mm. If care is taken in the mounting of probes, the method is virtually non-intrusive. The electricfield is very weak away from the pipe surface and has a negligible con-tribution to the passage of current. The response of the pin probe is initially linear to the thickness of the liquidfilm (typically up to 2 mm) and then asymptoticallyflattens to a uniform value to the thicker liquidfilm. This phenomenon is called probe“saturation”. When the probe is saturated, its output signal is not sensitive to the change of liquidfilm thickness. To enlarge the range of mea-surement, the diameter and separation of pins needs to be in-creased. However, the greater the spacing, the more averaged is the result over space. To obtain an optimum measurement of the liquidfilm thickness therefore, a balance must be struck between range of operability and local character of the measurement[46]. The pin probe used in this work is shown in Fig. 4. The probe consists of 20 pairs of electrodes made of 1.5 mm diameter stainless steel welding rods. Every pair of pins is spaced 15°away from the neighbour pair while the space in the same pair is 5°. The flow of electrical current from a transmitter in one probe to the neighbour receivers and transmitters (cross–talk) will decrease the spatial resolution of the sensor[44], and thus increase the mea-surement errors of the liquidfilm thickness. To reduce the effect of cross–talking, the signals from the 20 pair of pins were taken as 4 groups: 1, 5, 9, 13 and 17 in group A; 2, 6, 10, 14 and 18 in group B; 3, 7, 11, 15 and 19 in group C and 4, 8, 12, 16, and 20 in group D. Details of probe calibration can be found in[21,46].
3.5. Parallel wire probe
When the liquidfilm thickness is greater than the upper limit of the pin probes, parallel wire probes can be used [47–49]. Ac-cording to Brown et al.[50]the response of these probes is linear in liquidfilm thickness and they provide a more localised mea-surements if thickerfilms are present. The wires are intrusive and may cause perturbations to theflowingfilm. Disturbances can be minimised by the use of very thin wires[50]. A more significant
disturbance may occur when the probe has to work in a wavyfilm. When the liquid height decreases, a thin liquid layer sticks to the probe which might indicate a liquid level higher than the actual level, thus introducing a certain amount of lag in the dynamic response of the probe. This phenomenon was investigated ex-perimentally[51]and errors were found to be negligiable and that the response of the probe is almost instantaneous. In this work, the parallel-wire probe (Fig. 5) is one in which we have experience [21,43,45,52,53]. It hasfive pairs of stainless steel wires with the diameter of 0.33 mm stretched along the chords of the cross-section of the pipe. The spacing between the two wires of each pair is of 5 mm and the distance between the centres of the neighbouring pairs is 25 mm, with the central pair placed sym-metrically about a diameter. Details of the electronic circuit and probe calibration can be found in[21,52].
4. Results and discussion
4.1. Horizontal to vertical upwards 90°bend with ID of 34 mm
Tap water drawn by a pump from a storage tank is injected into a mixer where it is mixed with the air supplied from a compressor. The air-water mixture flows through a horizontal pipe, a hor-izontal to vertical 90°bend with a curvature of 5, a vertical pipe andfinally to the storage tank, where the air and the water are separated. All the pipes have the same internal diameter of 34 mm and a length of 150 diameters of the pipe to ensure full develop-ment offlow. The water is recirculated and the air is released to the atmosphere. Nine ring probes shown in Fig. 3 were placed along the test section. Three before the bend, at 1175, 660 and 145 mm, and six after the bend, at 145, 660, 1175, 1690, 2205 and 2720 mm respectively from the bend. The position of the first probe was 3935 mm from the mixer. More details of rig setup and probe calibration can be found in[41].
Fig. 6shows an example of the average void fraction time series obtained from the nine conductance probes (CP) in theflow line and in the riser (CP1–CP9). The superficial velocities are 0.3 and 0.32 m/s for the liquid and the gas respectively. It is obvious that the bend affects theflow behaviour, which can be noticed in the time traces of the first conductance probe just downstream the
[image:5.595.130.457.500.736.2]bend. The flow then, tends to re-establish itself from practically the probe (CP7) where the time series remain the same.
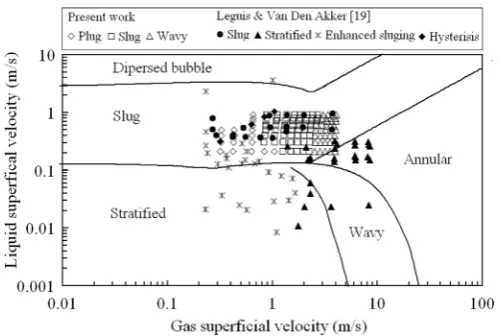
Based on the work of Jones and Zuber[54], theflow regime can be quantitatively identified by examining the signature of prob-ability density functions (PDF) of the cross sectional averaged void fraction data. For example, slugflow is featured by twin peak PDF, one at low void fraction corresponding to the void fraction in li-quid slug while the other at high void fraction representing Tylor bubble. The analysis of PDF characters provide clear evidence that stratified plug, wavy and slugflows were developed in theflow line while slug and churnflows occurred in the riser when the gas and liquid superficial velocities were operated from 0.3 to 4 m/s and from 0.21 to 0.91 m/s respectively. This is also confirmed by direct visualisation. The flow pattern maps of up- and down-streams of the bend are shown inFigs. 7and8respectively.
A flow is considered fully developed when its configuration does not change with the pipe diameter. In order to follow and quantify the minimum distance necessary for the development of theflow after the 90°bend, the Probability Density Function (PDF) of the void times series obtained from the six conductance probes after the bend (CP4–CP9) are plotted and analysed. The six probes are located 145, 660, 1175, 1690, 2205 and 2720 mm respectively 4, 19, 35, 50, 65 and 80 pipe diameters downstream the bend re-spectively. The plots corresponding to the minimal liquid and gas superficial velocities combinations are shown inFigs. 9and10. It appears from these figures that the shapes of the PDFs are
[image:6.595.54.283.50.441.2]changing along the downstream pipe of the bend and remain the same from the fourth conductance probe from the bend (CP7), situated 50 pipe diameters length from the bend. It is worth to note that this recovery length is in the order of that found by[55]. Indeed these latter, from the analysis of pressure drop of a com-bination of pipe components positioned horizontally, found that the two-phase flow is recovered at about 10–50 pipe diameters downstream the 90°bend depending on theflowrates.
[image:6.595.312.562.55.223.2]Fig. 5.Parallel wire probe.
[image:6.595.82.258.57.270.2]Fig. 6.Time series of cross-sectionally average void fraction along the test section (liquid superficial velocity¼0.3 m/s, gas superficial velocity¼0.32 m/s).
Fig. 7.Flow pattern map in theflow line upstream the 90°bend[41].
Fig. 8.Flow pattern map in the riser downstream of the 90°bend[41].
[image:6.595.315.559.248.401.2] [image:6.595.328.547.430.627.2]If the characteristic frequency obtained from the Power Spec-tral Density of the time series of void fraction are considered for the horizontal as well as the vertical pipe, it is seen inFig. 10that for the lower gas superficial velocities the frequencies are sub-stantially the same upstream and downstream of the bend. The liquid superficial velocity was 0.49 m/s in this case. Similar results at higher and lower liquid superficial velocities have been pre-sented elsewhere[41]. This is the persistence of frequency concept introduced by Azzopardi et al.[56]and considers that if the is slug flow in the horizontal pipe this will continue with the same fre-quency in the vertical pipe after the bend. In contrast, when the flow in the horizontal pipe is stratified, there is of necessity a change in flow pattern in the vertical pipe and the frequency changes across the bend.
4.2. 90°bends in series (vertical to horizontal then horizontal to horizontal)
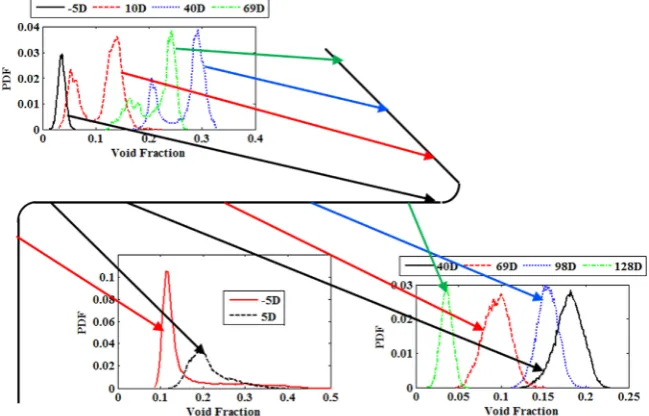
Experiments were carried out on the effect of two orientations of bends. Initially, a vertical to horizontal bend was investigated with measurements made just before and just after the bend. Subsequently, a more extensive arrangement was employed with a 4.5 m long vertical pipe followed by a vertical to horizontal bend 9.2 m long horizontal pipe leading to a bend in the horizontal plane and a further 5.5 m of horizontal pipe. In both cases the pipe diameter was 67 mm and thefluids utilised were air and a silicone oil with viscosity of 5 m Pa s. The ECT and WMS techniques were used. Data collection from the ECT was synchronised with that of the WMS by sharing one trigger command. A sampling time of 60 s was employed and sampling rates of 200 Hz (ECT) and 1000 Hz (WMS) utilised. The bends were manufactured from transparent acrylic resin and polished to enable high quality images to be obtained. Tests showed that the length of 4.5 m (66 pipe diameter) of vertical pipe was sufficient to provide a rea-sonably developedflow at the entrance to the bend.[19,57,58]. In these experiments the ECT was always placed at 5D upstream of the bends, while the WMS was located at 1, 10 40, 69, 98 and 128 diameters from vertical to horizontal bend and 10, 40, 69 and 75 diameters from the horizontal to horizontal bend.
Time averaged void fraction (sometimes considered as its compliment, liquid hold up) is important in calculation of pressure drop in piping. For a given liquid superficial velocity, it increases
with gas superficial velocity. If the values obtained from the data of ECT and wire mesh sensor for upstream and downstream of the bend, respectively, are considered it is seen that at intermediate liquid superficial velocities, 0.157 and 0.314 m/s, the mean void fractions follows the same trend and there is good agreement between the values upstream and downstream of the bend. However, at higher and lower liquid superficial velocities, 0.052 and 0.524 m/s, the void fractions decrease after the mixture passes the bend. This difference is probably due to the change offlow patterns caused by the change in direction of the effect of gravity. In stratifiedflow the controlling force is gas shear whilst in slug flow part of the liquid is pushed along by the gas.
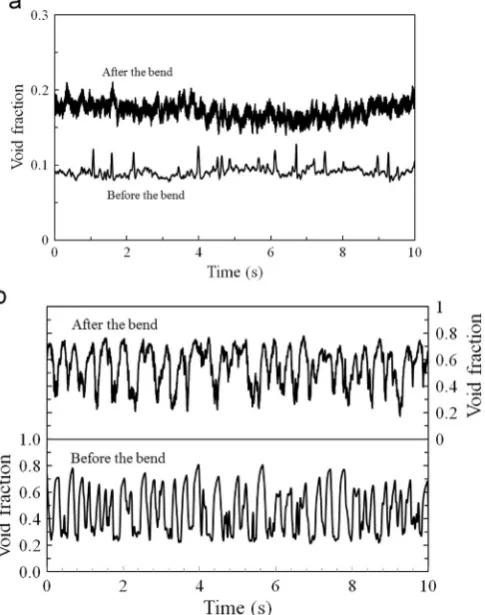
As discussed in the previous section, the time series of cross-sectional average void fraction shows many essential features of theflow. Examples are given inFig. 11of such data taken with the WMS mounted just before and just after the vertical to horizontal bend. These are from a liquid superficial velocity of 0.38 m/s and the gas superficial velocities of 0.05 and 0.71 m/s. The effect of the bend on theflow behaviour can be clearly seen from thefigure. For the lowerflow rate, theflow patterns upstream of the bend is bubblyflow and stratified wavy downstream of it. In contrast at the higher gasflow, there is slugflow in the vertical pipe whilst downstream of the bend there is plug flow with its large gas bubbles separated by a liquid layer[24](Figs. 12–14).
The main flow patterns observed for the vertical test section during this study are bubbly, spherical cap bubbles, slug, churn flows in the vertical pipe and stratified, wavy stratified, plug and slugflows in the horizontal lengths. The superficial velocities for the gas were from 0.045 to 3.21 m/s and whilst those for the liquid were from 0.15 to 0.53 m/s. At lowest gas superficial velocity studied, 0.05 m/s, theflow pattern in the vertical pipe was bubbly Fig. 10.Axial variation of characteristic frequency. Liquid superficial
[image:7.595.52.270.59.269.2]velocity¼0.49 m/s.
[image:7.595.308.551.62.370.2]flow. At the phases passed around the bend to the horizontal section, the liquid phase drained to the bottom of the pipe due to the effect of gravity and stratifiedflow results as shown inFig. 12 was dominant for the whole length of the horizontal section. When the gas superficial velocity increased to 0.18 m/s, theflow in the vertical section became of the cap bubble type while slow moving slugs were observed in the horizontal section. The liquid level was high enough to bridge the pipe to form plugflow. The body of those slugs contained a limited number of air bubbles. Slugs increased in length as they moved down the horizontal pipe. At higher gas superficial velocity, slugflow became dominant in the vertical pipe. As the slugs approach the bend, the liquid phase was moved to the outside of the bend atfirst due to the effect of the centrifugal force. Further round the bend, the gravitational pull drained the liquid to the inside of the bend leaving dry patch on top, until a new slug unit covered the dry zone occupied by the gas phase. In this case theflow in the horizontal section near the bend was stratified with slightly disturbed interface; while hydro-dynamic slugs formed at55D downstream the bend. The body of
the slug at these conditions contained more dispersed bubbles. One important, but often overlooked, feature is that some slugs are more likely to break up before leaving the test section. At the maximum liquid and gas superficial velocities (liquid superficial velocity¼0.53 m/s, gas superficial velocity¼3.21 m/s) theflow in the riser was churn while stratified wavy was dominant up to 55D downstream the bend in the horizontal section, then slug flow become dominant for the rest of the pipe length.
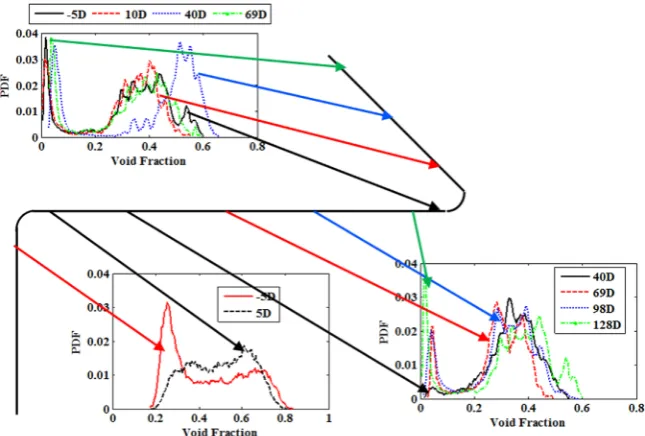
These direct visual observations were confirmed by ECT/WMS images of cross-section distribution of the phases and data of the PDF of the void fraction time series obtained from ETC and WMS sensors. These displays of the evolution of theflow are shown in Figs. 12 and 13 respectively for a lower flow condition, and in Figs. 14and15for the highestflow rates studied, liquid superficial velocity of 0.53 m/s and gas superficial velocity of 3.21 m/s.
[image:8.595.141.467.58.278.2] [image:8.595.140.465.314.522.2]It is noteworthy that the PDF signatures of the void fraction time series in the vertical pipe fromFig. 15right bottom graph that the PDFs signature of churnflow in the riser and the slugflow in the horizontal section are similar in shape. This due to that the Fig. 12.Tomographic images from positions along the pipe system. Liquid superficial velocity¼0.15 m/s and gas superficial velocity¼0.05 m/s.
hydrodynamic slugs formed at these conditions contain a very high dispersed bubble population where the gas hold up reaches a maximum value of around 0.48.
Both the ECT and WMS systems can produce phase distribution images offluids inside the pipe. The images obtained from the WMS are shown relative to the position where they were taken in Fig. 12where blue represents the liquid phase and the red gas. This is for a lowerflow rates, gas superficial velocity of 0.05 m/s and liquid superficial velocity of 0.15 m/s. As seen theflow is bubbly at the top of the vertical section but is stratified in the horizontal pipe. This is confirmed by the equivalent plots of the PDFs of the cross-sectionally averaged void fraction illustrated in Fig. 13. Downstream of the horizontal to horizontal bend the PDFs show a two peak shape. These normally would be associated with slug flow, however, direct observation indicate that at the lower void fraction conditions, the liquid level did not touch the top of the pipe and were more a manifestation of a wavy stratified flow. Figs. 14and15are the corresponding plots for higherflow rates, gas superficial velocity of 0.55 m/s and liquid superficial velocity of 0.45 m/s. Here theflow pattern is slugflow at the top of the ver-tical pipe and in the horizontal pipe.
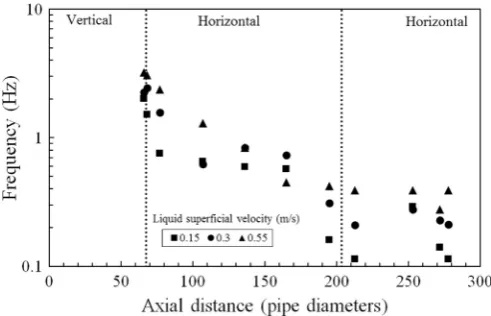
[image:9.595.132.457.58.241.2] [image:9.595.131.454.271.489.2]The characteristic frequencies of the time series of void fraction obtained at all the position studied have been extracted the Power Spectral density approach. These are shown inFigs. 16and17and illustrate the effect of gas and liquidflow rates. Though in some Fig. 14.Tomographic images from positions along the pipe system. Liquid superficial velocity¼0.45 m/s and gas superficial velocity¼0.55 m/s.
Fig. 15.Probability Density Function of void fraction time series positions along the pipe system. Liquid superficial velocity¼0.45 m/s and gas superficial velocity¼0.55 m/s.
cases there is a rise from just before to just after the vertical to horizontal bend, this is not always the case. The more dominant trend is the continuous decrease with downstream position. Be-yond the horizontal to horizontal bend the frequency can be in-dependent of position. These results are significantly different from those for the horizontal to vertical bend presented inFig. 10. They indicate that there is no persistence of frequency and re-inforces the point that only occurs if aflow pattern, particularly slugflow is maintained across the bend. The vertical to horizontal bend destroys slugflow, at least temporarily. As noted above it can take55D for it to reoccur.
4.3. 180°vertical inverted U-bend with 127 mm ID
Liquid film thickness distribution of an air–water mixture flowing through a vertical inverted U-bend with 127 mm ID was experimentally investigated. The water stored in the bottom of a separator was pumped to a gas–liquid mixer before it entered an 11 m vertical riser, flowed into the bend, went down a 9.6 m down-comer and returned to the separator. The riser has the same internal diameter as the bend and down-comer. The bend has a radius of curvature of 381 mm (R/D¼3) and consist of four mod-ular blocks and one instrumentation section containing all the measuring sensors (parallel-ring probe,flush-mounted pin probe shown in Fig. 4 and parallel-wire probe shown in Fig. 5). This modular construction enables the measuring section to be inserted every 45°along the bend. The superficial velocities of air ranged from 3.5 to 16.1 m/s and those for water from 0.02 to 0.2 m/s. At these superficial velocity ranges, churn and annular flows were dominated. More details about the rig and probe calibration can be found in[20,21].
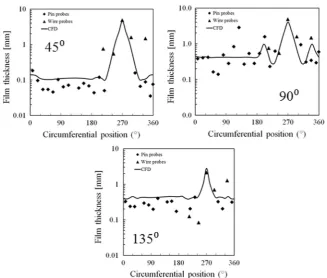
The variations of the liquidfilm thickness at a liquid superficial velocity of 0.2 m/s are shown inFig. 18. Here the values on the inside and outside of the bend only are shown together with value from upstream of the bend. In a previous publication[21], data were given in the form of polar coordinates but because the thin films involved, particularly on the outside of the bend, are so thin, these are not particularly informative.
The plots show that the profile of the liquid film thickness changes significantly when the bend angle is increased from 45°to 135°. At the 90°and 135°bend positions, the liquidfilm is thick at the inside of the bend and of the same magnitude. The thickfilms become a source of new droplets and at the inside of the 90°bend location; the liquidfilm is thinner than at the 45°and 135°bend designations. At the inside of the 45°bend position, the liquidfilm is thicker than that at both the 90°and 135°bend positions. This may be due to the deposited droplets falling down owing to
gravity drainage as a liquid film at the inside of the 45° bend position. Though, a thickening of the liquidfilm outside the three bends is also visible, most especially at the 90°and 135°positions. Because the ratio of average liquidfilm thickness to pipe dia-meter is very small, the variation of liquidfilm thickness cannot be seen clearly in the polar coordinates[21]the results are instead in Cartesian coordinates. Fig. 19 shows the variation of the time averaged liquidfilm thickness that occurs in the bend. Here, the abscissa is the circumferential angular position of the probes and the 90°and 270°are the top and bottom of the pipe. 0 and 180° represent the side of the bend.
[image:10.595.44.290.57.215.2]At a liquid superficial velocity of 0.1 m/s, the liquidfilm thick-ness inside the bend decreases with an increase in bend angle, 45– 135°as shown inFig. 19a. In contrast, for the outside of the bend, the liquid film thickness increases and then slightly remains constant with an increase in bend angle. The increase in liquidfilm thickness on the inside of the 45°bend can be attributed to gravity drainage which causes more liquid film to accumulate here. The increase on the other hand for the outside of the 90° and 135° bends is a result of an increase in droplet deposition outside the bend. This is in agreement with the observations reported by Flores et al.[59] who confirmed that a secondaryflow exists in horizontal annularflow using a twin axial vorticity metre. The CFD calculations were carried out by Tkaczyk[60]using air and water and the same geometry as the experiments reported above. He employed Star-CD for the modelling and simulation of the air– waterflow around a vertical 180°return bend. The Star-CD code employs the Finite Volume method to numerically discretize the computationalflow domain. The air–waterflow was modelled as a continuum gasfield, continuum liquidfilm and as liquid droplets of varying diameters. He accounted for the dynamics of the droplet flow in the gas core and the interaction between them. The liquid film was solved explicitly using a modified Volume of Fluid (VOF) method. The droplets were tracked using a Lagrangian technique. The liquidfilm to droplet and droplets to liquidfilm interactions were taken into account using sub-models to complement the VOF model. Tkaczyk[60]took into consideration the fact that in free surface flows, a high velocity gradient at the gas/liquid interface results in high turbulence generation. In order to overcome this inadequacy, he implemented a correction to the VOF model based on the work of Egorov[61]. Full details can be found in Tkaczyk [60]. The model gives a reasonably good prediction of the liquid film thickness in the bend.Fig. 19shows the comparison between the experimental results and those obtained numerically. Thefilm thickness is plotted on a logarithmic scale to show the variation of the lower film thicknesses more clearly. Tkaczyk [60] correctly predicted the liquidfilm thickness inside the 90 and 135°bends at Fig. 17.Characteristic frequency along the pipe system. Effect of liquidflow rate.
[image:10.595.312.561.58.218.2]the liquid and gas superficial velocity of 0.1 and 14.8 m/s, respec-tively, but under-estimated the maximumfilm thickness inside the 45°bend with an error of 65%. It is interesting to note that the double peaks found on the liquidfilm thickness at the 45°bend were correctly predicted by the model.
For a liquid superficial velocity of 0.2 m/s, the maximum liquid film thicknesses for the inside of the bend are found at the 45° position as shown inFig. 19. Now the impingement point for drops is beyond 45°. But by 90°this liquid has drained under gravity to the inside of the bend. In addition, some of the liquid meant to move up to the 90°bend returned back (backflow) to the 45°bend due to its lower momentum and curvature of the bend. According to Abdulkadir et al. [21], these two scenarios could explain why the observed liquidfilm at the bottom of the 45°bend was thicker than the other locations, at 90°and 135°. Some of the liquid at the bottom and top of the 90°bend due to the action of gravity and shape of the curvature of the bend, drain down to the bottom of the 135°bend and accumulate there. Also the droplets that im-pinged on the wall also deposit at the 135°bend. This could be the reason why there is a thickfilm at the 135°bend but less than those found at the 45°and 90°bends. This claim is also supported by the images taken by a high speed video camera. For the outside of the bend scenario, the liquidfilm is thickest at the 90°, followed by the 135°and thinnest at the 45°bend. Thefilm is wavy. This indicates that more liquid is drained from the top of the 45°bend. As a consequence of this drainage, the liquidfilm at the outside of the 45° bend thins out and become more uniformly distributed around it. The uniformity of the liquidfilm outside the 45°bend could be due to a balance of circumferential drag, shear and gravity forces. Another possible explanation could be that the pin probes limited to thin liquid film measurements failed to detect the thickfilms outside the 45°bend.
The data collected can be used to understand the variation of liquidfilm thickness distribution with gas and liquid superficial velocities. This information can actually aid in providing in-formation about where to locate aflow controller.
5. Conclusions
The knowledge of the phase distribution in the bends and the influence of the bends on flow downstream of them is crucial when a desiredflow patterns need to be maintained in pipes. From the data provided, appropriate diameters could be suggested to achieve a specificflow pattern. The information presented pro-vides useful guidance on where sensors drivingflow controllers should be located. If there is a requirement to have or avoid slug flow, then a detector should be positioned just downstream of a vertical to horizontal bend. However, because slugflow can reform further downstream, a second detector 100D further down-stream might be sensible. It is noted that the full cross section distribution of the phases is not required. The approach proposed by Jeanmeure et al. [33] would be much simpler yet perfectly adequate. It could be adaptable for industrial applications. It em-ploys capacitance measurements and is so is applicable only to non-conducting liquids. However, an equivalent version using re-sistance for conducting liquids such as water should be possible.
The material presented above has shown that state of the art instrumentation is required to extract the complexities of gas-li-quid flows in bends. These instruments, though suitable for la-boratory applications would need significant developments before they could be utilised in industrial applications. Therefore, the contribution of this work to the control of gas-liquid flows in bends will be limited to the passive type, where the knowledge influences the design of geometry employed and the flow rates used.
In the case of fired heaters, coking occurs is just before the bend. This is caused by the rate of entrainment of drops from the film and the rate of evaporation from thefilm is greater than the rate of replenishment of the film by depositing drops. A more important problem is the split of feed between tubes in parallel. If one of these tubes has a lowflow, that is the one in which coking will occur.
[image:11.595.128.456.54.332.2]Hydro; PDVSA (INTERVEP); Petrobras; PETRONAS; Scandpower PT; Shell; SINTEF; Statoil and TOTAL. The Authors wish to express their sincere gratitude for their support.
M. Abdulkadir would like to express sincere appreciation to the Nigerian government through the Petroleum Technology Devel-opment Fund (PTDF/TR/PhD/AM/137/VOL. 1) for providing the funding for his doctoral studies. L.A. Abdulkareem would like to express sincere appreciation to the University of Zakho and the Ministry of Higher Education, Kurdistan Regional Government for providing the funding for his doctoral studies.
References
[1]S.B. Corder, The Near-Surface Expansion of Gas Slugs: Insights from Laboratory Experiments into Eruptive Activity at Low-Magma-Viscosity Volcanoes (Ph.D. Thesis), Lancaster University, U.K., 2008.
[2] G. Sakamoto, T. Doi, Y. Murakami, K. Usui, Profiles of liquidfilm thickness and dropflow rate in U-bend annular mistflow, in: Proceedings of the 5th Inter-national Conference on Multiphase Flow, Yokahama, May 30–June 4, paper Mo. 317, 2004.
[3]B.J. Azzopardi, Gas-Liquid Flows, Begell House, New York, 2006.
[4]L.P. Golan, A.H. Stenning, Two-phase verticalflow maps, Proc. Inst. Mech. Eng. 184 (1969) 108–114.
[5]T. Takemura, K. Roko, M. Shiraha, S. Midoriyama, S. Dryout, Dryout char-acteristics andflow behaviour of gas-water two-phaseflow through U-shaped and inverted U-shaped bends, Nucl. Eng. Des. 95 (1986) 365–373.
[6]L.Y. Chong, B.J. Azzopardi, D.J. Bate, Calculation of conditions at which dry out occurs in the serpentine channels offired reboilers, Chem. Eng. Res. Des. 83 (2005) 412–422.
[7]G.F. Hewitt, A.H. Govan, Phenomenological modelling of non-equilibriumflow with phase change, Int. J. Heat Mass Transf. 32 (1990) 229–242.
[8]B.J. Azzopardi, D.A. Colman, D. Nicholson, D. Plant, application of a T-junction as a partial phase separator, Chem. Eng. Res. Des. 80 (2002) 87–96. [9]F. Sanchez-Silva, V. Hernandez-Perez, I. Carvajal-Mariscal, J.G.
Barbosa-Sal-daña, J.A. Cruz-Maya, Separation of a two-phase slugflow in branched 90°
elbows, J. Fluids Eng. 132 (2010) (051301-1-051201-051208).
[10]G. Baker, W. Clark, B.J. Azzopardi, J.A. Wilson, Controlling the phase separation of gas-liquidflows at horizontal T-junctions, AIChE J. 53 (2007) 1908–1915. [11]G. Baker, W. Clark, B.J. Azzopardi, J.A. Wilson, Transient effects in gas-liquid phase separation at a pair of T-junctions, Chem. Eng. Sci. 63 (2008) 968–976. [12] G.H. Anderson, P.D. Hills, Two-phase annularflow in tube bends, in:
Pro-ceedings of the Symposium on Multiphase Flow Systems, University of Strathclyde, Glasgow, Paper J1, Published by Institution of Chemical Engineers Symposium, Series No. 38, 1974.
[13] J.D. Balfour, D.L.Pearce, Annular Flows in Horizontal 180°Bends: Measure-ments of Water Rate Distributions in the Film and Vapour Core, C.E.R.L. Note No. RD/L/N96/78, 1978.
[14]K. Hoang, M.R. Davis, Flow structure and pressure loss for two-phaseflow in round bends, J. Fluids Eng. 106 (1984) 30–37.
[15]C. Tingkuan, Y. Zhihua, W. Qian, Two-phaseflow and heat transfer in vertical U-shaped tubes (I)flow pattern transitions in the bend, J. Chem. Ind. Eng. 1 (1986) 1–12.
[16]J.M. Mandhane, G.A. Gregory, K. Aziz, Aflow pattern map for gas-liquidflow in horizontal pipes, Int. J. Multiph. Flow 1 (1974) 537–553.
[17]J. Weisman, S.Y. King, Flow pattern transitions in vertical and upwardly in-clined lines, Int. J. Multiph. Flow 7 (1981) 271–291.
[18] P.W. James, Azzopardi, B.J., D.I. Graham, C.A. Sudlow, C.A., The effect of a bend on droplet distribution in two-phaseflow, in: Proceedings of the International Conference on Multiphase Flow in Industrial Plants, Bologna, 13–15 September 2000.
[19]M. Abdulkadir, D. Zhao, S. Sharaf, L. Abdulkareem, I.S. Lowndes, B.J. Azzopardi,
downward section of large diameter vertical serpentine pipes, Int. J. Multiph. Flow 78 (2016) 25–43.
[27] A. Almabrok, L. Lao, H. Yeung, Effect of 180°bends on gas/liquidflows in vertical upward and downward pipes, WIT Trans. Eng. Sci. 79 (2013) 435–445. [28] S.M. Huang, Impedance sensors-dielectric systems, in: R.A. Williams, M.
S. Beck (Eds.), Process Tomography, Butterworth-Heinemann Ltd, Cornwall, 1995.
[29] K. Zhu, S. Madhusudana Rao, C. Wang, S. Sundaresan, Electrical capacitance tomography measurements on vertical and inclined pneumatic conveying of granular solids, Chem. Eng. Sci. 58 (2003) 4225–4245.
[30] A. Hunt, J. Pendleton, M. Byars, Non-intrusive measurement of volume and mass using electrical capacitance tomography, in: Proceedings of the 7th Bi-ennial ASME Conference on Engineering System Design and Analysis, Man-chester, UK, ESDA 2004-58398, 2004.
[31] B.J. Azzopardi, V. Hernandez Perez, R. Kaji, M.J. da Silva, M. Beyer, U. Hampel, Wire mesh sensor studies in a vertical pipe, in: Proceedings of the Fifth In-ternational Conference on Transport Phenomena in Multiphase Systems, Bialystok, Poland, 2008.
[32] L.A. Abdulkareem, Tomographic Investigation of Gas–Oil Flow in Inclined Ri-sers (Ph.D. Thesis), University of Nottingham, U.K., 2011.
[33] L.F.C. Jeanmeure, T. Dyakowski, W.B.J. Zimmerman, W. Clark, Direct flow-pattern identification using electrical capacitance tomography, Powder Tech-nol. 112 (2000) 174–192.
[34] M.J. da Silva, S. Thiele, L.A. Abdulkareem, B.J. Azzopardi, U. Hampel, High-re-solution oil-gas two-phaseflow measurement with a new capacitance wire-mesh tomography, Flow Meas. Instrum. 21 (2010) 191–197.
[35] S. Sharaf, M. Da Silva, U. Hampel, C. Zippe, M. Beyer, B. Azzopardi, Comparison between wire mesh sensor technology and gamma densitometry, Meas. Sci. Technol. 22 (2011) 104019 (13 pp).
[36] B.J. Azzopardi, L.A. Abdulkareem, D. Zhao, S. Thiele, M.J. da Silva, M. Beyer, A. Hunt, Comparison between electrical capacitance tomography and wire mesh sensor output for air/silicone oilflow in a vertical pipe, Ind. Eng. Chem. Res. 49 (2010) 8805–8811.
[37]J.C. Asali, T.J. Hanratty, P. Andreussi, Interfacial drag andfilm height for vertical annularflow, AIChE J. 31 (1985) 895–902.
[38] P. Andreussi, A. Di Donfrancesco, M. Messia, An impedance method for the measurement of liquid hold-up in two phaseflow, Int. J. Multiph. Flow 14 (1988) 777–785.
[39] N.A. Tsochatzidis, T.D. Karapantios, M.V. Kostoglou, A.J. Karabelas, A con-ductance method for measuring liquid fraction in pipes and packed beds, Int. J. Multiph. Flow 5 (1992) 653–667.
[40] M. Fossa, Design and performance of a conductance probe for measuring li-quid fraction in two-phase gas-lili-quidflow, Flow Meas. Instrum. 9 (1998) 103–109.
[41]F. Saidj, R. Kibboua, A. Azzi, N. Ababou, B.J. Azzopardi, Experimental in-vestigation of air–water two-phaseflow through vertical 90°bend, Exp. Therm. Fluid Sci. 57 (2014) 226–234.
[42] J.E. Koskie, I. Mudawar, W.G. Tiederman, Parallel wire probes for measurement of thick liquidfilms, Int. J. Multiph. Flow 15 (1989) 521–530.
[43] G. Conte, B.J. Azzopardi, Film thickness variation about a T-junction, Int. J. Multiph. Flow 29 (2003) 305–325.
[44]R.J. Belt, On The Liquid Film in Inclined Annular Flow (Ph.D. Thesis), Delft University of Technology, The Netherlands, 2006.
[45] (a) G. Geraci, B.J. Azzopardi, H.R.E. van Maanen, Inclination effects on cir-cumferentialfilmflow distribution in annular gas/liquidflows, AIChE J. 53 (2007) 1144–1150;
(b) G. Geraci, B.J. Azzopardi, H.R.E. van Maanen, Effect of inclination on cir-cumferentialfilm thickness variation in annular gas/liquidflow, Chem. Eng. Sci. 62 (2007) 3032–3042.
[46] M.H.S. Zangana, Film Behaviour of Vertical Gas–Liquid Flow in a Large Dia-meter Pipe (Ph.D. Thesis), University of Nottingham, U.K., 2011.
[47]M. Miya, Properties of Roll Waves (Ph.D. Thesis), University of Illinois, Urbana, USA, 1970.
[48] M. Miya, D.E. Woodmansee, T.J. Hanratty, A model for roll waves in gas–liquid flow, Chem. Eng. Sci. 26 (1971) 1915–1931.
(Ph.D. Thesis), University of Illinois, Urbana, USA, 1975.
[50]R.C. Brown, P. Andreussi, S. Zanelli, The use of wire probes for the measure-ment of liquidfilm thickness in annular gas–liquidflows, Can. J. Chem. Eng. 56 (1978) 754–757.
[51]M.D. Pearlman, Dynamic Calibration of Wave Probes, Department of Naval Architecture and Marine Engineering, MIT, USA, 1963.
[52]S. Rea, B.J. Azzopardi, The split of horizontal stratifiedflow at a large diameter T-junction, Trans. Inst. Chem. Eng. 79A (2001) 470–476.
[53]G. Conte, An Experimental Study for the Characterisation of Gas/Liquid Flow Splitting at T-Junctions (Ph.D. thesis), University of Nottingham, U.K., 2000. [54]O.C. Jones, N. Zuber, The interrelation between void fractionfluctuations and
flow patterns in two-phaseflow, Int. J. Multiph. Flow 2 (1975) 273–306. [55]P. Sookprasong, J.P. Brill, Z. Schmidt, Two-phaseflow in piping components, J.
Energy Res. Technol. 108 (1986) 197–201.
[56]B.J. Azzopardi, A. Ijioma, S. Yang, L.A. Abdulkareem, A. Azzi, M. Abdulkadir, Persistence of frequency in gas-liquidflows across a change in pipe diameter or orientation, Int. J. Multiph. Flow 67 (2014) 22–31.
[57]A. Azzi, L. Friedel, Two-phase upwardflow 90°bend pressure loss model, Forsch. Im. Ing. 69 (2005) 120–130.
[58]S. Benblla, M. Al-Shannag, Z.A. Al-Anber, Gas–liquid pressure drop in vertical internally wavy 90°bend, Exp. Therm. Fluid Sci. 33 (2009) 340–347. [59]A.G. Flores, K.E. Crowe, P. Griffith, Gas-phase secondaryflow in horizontal,
stratified and annular two-phaseflow, Int. J. Multiph. Flow 21 (1995) 207–221. [60]P. Tkaczyk, CFD Simulation of Annular Flows Through Bends (Ph.D. Thesis),
University of Nottingham, U.K., 2011.
[61] Y. Egorov, Contact Condensation in Stratified Steam-water Flow, EVOL-ECORA-D 07, 2004.
Dr. Donglin Zhaois Senior Lecturer in Chemical Engineering in London South Bank University. He obtained Ph.D. in chemical Engineering in the University of Surrey. He has more than 20 years’experience working in the areas of gas-liquid mixing, enhanced heat transfer and multiphaseflow. He is a co-author of a book and published dozens of papers in refereed journals and conference proceedings.
Mr. Rajab Omarcompleted the B.Sc degree in chemical engineering from Al-Zawia University, Libya. He received the M.Sc in Chemical Engineering from the University of Nottingham, UK in 2011. Currently he is conducting research on transitional two phaseflows around 90°bends in The University of Nottingham for a Ph.D. degree in chemical engineering.
Dr. Abdulkadir Mukhtarhas a Ph.D. in Chemical Engineering from the University of Nottingham, United Kingdom. Currently, he is a senior lecturer in the Chemical Engineering Department, Federal University of Technology, Minna, Nigeria. He is also a visiting assistant professor, Petroleum Engineering Department, African University of Science and Technology, Abuja, Nigeria. Dr. Abdulkadir is interested in multiphaseflow research whichfinds applications in the oil/gas production, pro-cess and power sectors of industry. He also has research interests in the develop-ment of computationalfluid dynamics models to characterize the complex phe-nomena exhibited by gas–liquidflows in straight pipes and bends.
Dr. Lokman A. Abdulkareemis Dean of the Faculty of Engineering at the Uni-versity of Zakho. He received Ph.D. in Chemical engineering from the UniUni-versity of Nottingham/ United Kingdom. He has more than 18 years experience of academic
teaching and research. His research projects are involving the application of ad-vanced tomographic instrumentation such as Electrical Capacitance Tomography and wire mesh sensor. He has led many research grants and contracts funded by institutions and Industry. In addition, he has been a member of Master projects panels at some institutions. He teaches many modules in different universities and institutes. He has published over 40 articles in refereed journals, conference pro-ceedings, and other edited collections.
Dr. Abdelwahid Azziis Professor in Mechanical Engineering at the University of Sciences and Technology Houari Boumedien, Algiers (USTHB). He carried a large part of his Ph.D. thesis at the Technical University of Hamburg Harburg (TUHH), Germany. For several years, he led the Two-phaseflow group in the Multiphase Flow and Porous Media Laboratory (USTHB). From 2006, he started his research collaboration with Prof. B.J. Azzopardi from the University of Nottingham. During his several research stays at this University, sponsored by the EPSRC as well the Algerian Ministry of High Education and Research, he worked on several projects: all in the multiphaseflow area.
Dr. Faiza Saidjis Lecturer in Process Engineering at the University of Sciences and Technology Houari Boumedien, Algiers (USTHB). She started her research career by preparing a Master degree in chemical engineering. This research work were dealing with oil extraction from plants. The results of these investigations have been published in journal papers and conferences. In 2010, she joined the Multi-phase Flow and Porous Media Laboratory, to carry out her Ph.D. research thesis. In 2015, she received her Ph.D. degree from the same university. Her research thesis concerned the analysis of two-phaseflow behaviour in vertical 90°bend. Actually, she is working on topics all of them in two-phaseflow area.
Dr. Valente Hernandez-Perezis a research fellow in the Mechanical Engineering Department, National University of Singapore, Singapore, within the Centre for Offshore Research Engineering (CORE). He worked previously as a research fellow at Nottingham University, United Kingdom. Dr. Hernandez-Perez obtained his Ph.D. in Chemical Engineering from the University of Nottingham, United Kingdom. His research has been focused on multiphaseflow (mainly gas-liquid) by means ex-perimental and computational methods.
Dr. Buddhi Hewakandambyhas a Ph.D. in Chemical Engineering from the Uni-versity of Sheffield. Currently, he is an assistant professor in the Department of Chemical and Environmental Engineering, University of Nottingham, United King-dom. His research interests include multiphaseflows phenomena across various length scales,flow instabilities,flow with heat transfer and CFD modelling.
Barry Azzopardiis Lady Trent Professor of Chemical Engineering at the University of Nottingham. He is the author of two books and more than 300 refereed papers on aspects of multiphaseflow. He has designed and operated very large experi-mental facilities and applied state of the art instrumentation to multiphaseflow, particularly electrical tomography. He has worked on drops andfilms in annular