1
Risk and protective factors for falls on one level in
young children: multicentre case-control study
Benford P1, Young B1, Coupland C1, Watson M2, Hindmarch P3, Hayes M4, Goodenough T5, Majsak-Newman, G6, Kendrick D1,on behalf of the Keeping Children Safe study group.
1 School of Medicine, Division of Primary Care, University of Nottingham, Tower Building, University Park, Nottingham, NG7 2RD, UK
2 School of Health Sciences, University of Nottingham, D86, Queen's Medical Centre, Nottingham, NG7 2HA, UK
3 Institute of Health & Society, Baddiley-Clark Building, Newcastle University, Richardson Road, Newcastle upon Tyne, NE2 4AX, UK
4 Child Accident Prevention Trust, Canterbury Court (1.09), 1 - 3 Brixton Road, London, SW9 6DE, UK
5 Centre for Child & Adolescent Health, University of the West of England, Bristol, Oakfield House, Oakfield Grove, Bristol BS8 2BN, UK
6 Jenny Lind Paediatric Department, Norfolk and Norwich University Hospital, Colney Lane, Norwich, NR4 7UY, UK
Correspondence to: Penny Benford, School of Medicine, Division of Rehabilitation and Ageing, University of Nottingham, B Floor, The Medical School, Queen’s Medical Centre, Nottingham, NG7 2UH, UK
E mail:penny.benford@nottingham.ac.uk
Tel:0115 82
3
0473Abstract word count = 243
2
ABSTRACTBackground: Childhood falls are an important global public health problem, but there is a lack of evidence about their prevention. Falls on one level result in considerable morbidity and they are costly to health services.
Objective: To estimate odds ratios for falls on one level in children aged 0-4 years for a range of safety behaviours, safety equipment use and home hazards.
Design, setting and participants: Multicentre case-control study at hospitals, minor injury units and general practices in and around 4 UK study centres. Participants included 582 children less than 5 years of age with a medically attended fall injury occurring at home and 2460 controls matched on age, sex, calendar time and study centre.
Main outcome measure: Fall on one level.
Results: Cases’ most common injuries were bangs on the head (52%), cuts or grazes not needing stitches (29%) or cuts or grazes needing stitches (17%). Comparing cases to community controls in the adjusted analyses, significant findings were observed for only 2 exposures. Injured children were significantly less likely to live in a household without furniture corner covers (adjusted odds ratio (AOR) 0.72, 95%CI 0.55, 0.95), or without rugs and carpets firmly fixed to the floor (AOR 0.76, 95% CI 0.59, 0.98).
Conclusions: We did not find any safety practices, use of safety equipment or home hazards associated with a reduced risk of fall on one level. Our findings do not provide evidence to support changes to current injury prevention practice.
INTRODUCTION
Unintentional falls are the leading cause of medically attended childhood injuries in most countries1 2 with the under-fives having higher rates of non-fatal falls than older
children.3 Globally, falls are the 12th leading cause of disability-adjusted life years lost in this age group 1 and incur high health service costs, accounting for over $1billion in the USA in 20054.
3
the overall burden of fall-related injuries. In England in 2012-13 they accounted for 23% of fall-related hospital admissions 5 and in 2002 (the latest year for which data were collected) they accounted for 30% of fall-related emergency department (ED)attendancesin the under-fives.6 Although fall injuries represent a considerable health burden, there is little evidence of modifiable risk factors or effective strategies to prevent childhood falls in the home7, particularly falls on one level.8 This multicentre
case-control study therefore investigates modifiable risk factors for falls on one level in children under-five years in the home.
Our primary objective was to estimate odds ratios for medically attended falls on one level occurring in the home or garden in children under 5 years of age, for a range of
exposures (safety behaviours, safety equipment use and hazards), adjusted for a range of potential confounding factors. The secondary objective was to investigate whether
associations between exposures and falls on one level varied by socio-demographic factors previously found to be associated with differential effectiveness of home safety
interventions (child age, gender, ethnicity, single parenthood, housing tenure, and unemployment)9.
METHODS
Study design and setting
The methods have been described in full in the published protocol 10.This was one of five multicentre matched case-control studies that employed identical methods to explore modifiable risk factors for poisonings, scalds, falls from furniture, falls on one level, and stair falls10. These were conducted simultaneously within NHS hospitals in four areas of the UK: Nottingham and Derby; Bristol; Norwich and Great Yarmouth; Newcastle upon Tyne and Gateshead. Cases were recruited between 14 June 2010 and 15 November 2011. Control recruitment commenced at the same time as case recruitment and ended within 4 months of case recruitment.
Ethical approval was obtained from Nottingham Research Ethics Committee 1 (study reference number 09/H0407/14). Completion and return of a questionnaire was taken as informed consent.
Participants
Cases comprised children less than 5 years of age who attended an ED or minor injury unit (MIU) or were admitted to hospital with a fall on one level occurring in their home or garden.Children with intentional or suspected intentional injury, those living in
4
eligible children were invited to participate during their medical attendance or bytelephone or post within 72 hours of attendance. Non-responders were sent one reminder two weeks after the initial approach. Controls were children who had not sustained a medically attended fall on one level on the date of the case’s injury,
matched on age (within 4 months), sex and calendar time (within 4 months of injury) to the case, and recruited from the case’s general practice (or a neighbouring practice). Children living in residential care and those previously participating as a case in the study were excluded. The 10 potentially eligible controls with dates of birth closest to that of their matched case were identified from the practice register and were sent postal study invitations. To increase power and make efficient use of recruited
participants, control participants from cases with more than four controls, controls no longer matched to cases (eg, case had subsequently been excluded), and control participants participating in one of the other 4 ongoing case-control studies were matched on age, sex and study centre to cases which did not have four controls.
Measurement exposures and confounding variables
Parents completed questionnaires asking about home hazards, safety equipment use, safety behaviours and potential confounders. Questionnaires were developed by the research team in conjunction with a lay research advisor, and were age-specific (0-12 months, 13-36 months, and 37-59 months), containing measures of child behaviour and temperament, and health related quality of life, to reflect appropriate developmental levels. They were piloted on parents of children attending EDs within participating hospitals and control questionnaires were piloted on parents attending local children’s centres. To increase response rates respondents were sent a £5 shopping voucher on receipt of completed questionnaires 11 12. Questions referred to the 24 hours preceding injury, or for controls the 24 hours prior to questionnaire completion for use of (response options: yes/no):
Baby walkers (ages 0-36 months)
Playpens or travel cots (ages 0-36 months)
Stationary activity centres (ages 0-36 months)
Safety gates anywhere in house
Furniture corner covers
Rugs or carpets being firmly fixed to floor
Questions referred to the seven days prior to injury or questionnaire completion (response options: every/ most/some days/never/not applicable, grouped into at least some days vs. never with analyses excluding not applicable responses) for:
5
Tripping hazards on floors Allowing unsupervised play in the garden
Locking back doors to prevent access to the garden
The use of safety gates to prevent access to garden
Questions asked about teaching children safety rules13 about (response options: yes/no):
Slippery floors
Running in the house
Responses to eight of the questions which could be verified by observation were
validated during home visits to a sample of 162 case-control study participants who had expressed interest in taking part in further research (see Table 2) 14. Participants were asked to take part in a home safety study and not informed that the purpose of the home visit was to validate their previously completed questionnaire.
Questions on potential confounders asked about:
family size and structure, ethnic group, overcrowding, housing tenure, receipt of state-provided means-tested benefits, maternal age, time cared for outside the home, place of out-of-home care, area-level deprivation (Index of Multiple Deprivation (IMD) score15) and straight line distance from home address to hospital 16;
validated measures of child behaviour and temperament (the activity and high intensity pleasure subscales of the Infant, Early Child and Child Behaviour Questionnaires; IBQ, ECBQ and CBQ)17-21, parenting daily hassles (parenting tasks subscale) 22 23, parental mental health scale (HADS) 24, child health related quality of life inventory (PedsQL) 25 26 and general health visual analogue scale (VAS) 27.
Study size
6
Statistical methodsConditional logistic regression was used to estimate odds ratios (ORs) and 95%
confidence intervals for each exposure variable, adjusted for deprivation and distance from hospital, plus confounding variables. The choice of confounders to include in multivariable models for each exposure was based on directed acyclic graphs (DAGs).31-33The
confounders adjusted for in each model are specified in Table 3.
Response options for questions pertaining to the frequency of safety behaviours were grouped into at least some days vs. never with analyses excluding not applicable responses.
The linearity of relationships between continuous confounders and case/control status was tested by adding higher-order terms to regression models, with categorisation where there was nonlinearity. Interaction terms were added to regression models to explore differential effects by child age, gender, ethnic group, single parenthood, non-owner occupied housing and unemployment9, with significance assessed with likelihood ratio tests (P<0.01). Where significant interactions were found stratified ORs are presented.
For the PedsQL, mean scale scores were computed by summing items and dividing by number of items answered. Means were not computed where ≥50% items were missing. For the HADS, single missing item values for each subscale were imputed using the mean of the remaining 6 items. Subscale scores were not computed when more than one item was missing.34 The same approach was used for missing values of PDH, since we were unable to find guidance on this. The main analyses were complete case analyses including single imputed values for HADS and PDH. For the IBQ, ECBQ and CBQ missing values were scored as the total score divided by the total number of questions answered 35. Sensitivity analyses imputed missing data for all exposures and confounders. Twenty multiply
imputed datasets were imputed and combined using Rubin’s rules 36.
For exposure variables validated by home visits, sensitivity, specificity, positive and
7
Figure1. FormulaeRESULTS
9
The mean number of controls recruited per case was 4.23. The median time from date of injury to date of questionnaire completion for cases was 10 days (interquartile range 6-20). Most cases (80%) sustained single injuries, most commonly bangs on the head (52%), cuts or grazes not needing stitches (29%) or cuts or grazes needing stitches (17%). 47% of cases were seen but did not require treatment, 46% received treatment in ED, 4% were discharged with outpatient or general practice follow up, and 3% were admitted to hospital. [image:9.595.65.532.387.758.2]As shown in Table 1 cases were similar in age to controls (median age 2.08 vs. 2.16 years), but were more likely to have a mother who had her first child under the age of 20 (16.5% vs 10.8%), live in a household with no adults in paid work (19.1% vs. 12.4%), live in a household receiving state benefits (44.3% vs. 37.0%) and live in non-owner occupied housing (42.5% vs. 32.7%).
Table 1. Characteristics of cases and controls (percentage, unless stated otherwise) [missing values].
Characteristics Cases
n=582 Controls n=2460
Study centre Nottingham Bristol Norwich Newcastle 192 (33.0) 180 (30.9) 137 (23.5) 73 (12.5) 765 (31.1) 817 (33.2) 614 (25.0) 264 (10.7) Median age in years (IQR)*
Age group: 0-12 months 13-36 months 37-62 months
2.08 (1.42, 3.13)
73 (12.5) 355 (61.0) 154 (26.5)
2.16 (1.53, 3.22)
206 (8.4) 1,591 (64.7) 663 (26.9)
Male 355 (61.0) 1,507 (61.3)
Ethnic Origin: White 512 (89.8) [12] 2,232 (91.9) [32] Number of children aged 0-4 years in family
0 1 2 ≥3 [11] 2 (0.4) 365 (63.9) 180 (31.5) 24 (4.2) [34] 20 (0.8) 1,438 (59.3) 867 (35.7) 101 (4.2)
First child 244 (44.5) [34] 959 (42.5) [206]
Maternal age ≤ 19 at birth of first child** 86 (16.5)[9] 244 (10.8)[15] Single adult household 80 (14.0) [12] 263 (10.9) [49] Median weekly hours out of home child care
(IQR) 10 (0; 20.0) [45] 15 (2.5; 24.0) [132]
Adults in paid work ≥ 2 1 0 [12] 263 (46.1) 198 (34.7) 109 (19.1) [33] 1,381 (56.9) 745 (30.7) 301 (12.4) Receives state benefits 252 (44.3) [13] 893 (37.0) [48]
Overcrowding >1 person per room 51 (9.3) [32] 173 (7.4) [127]
Non owner occupier 242 (42.5) [13] 792 (32.7) [38]
10
Characteristics Cases
n=582 Controls n=2460
Median IMD score (IQR) 17.1 (8.8;31.8) 15.1 (9.3;26.8) [26] Median distance (km) from hospital (IQR) 3.3 (2.0; 5.0) 3.7 (2.4; 6.4) [25] Mean CBQ score (SD) 4.66 (0.98) [40] 4.60 (0.87) [213] Long term health condition 55 (9.7) [13] 187 (7.7) [14] Child health visual analogue scale (CBQ) (range
0-10) (median (IQR)) 10 (9.3; 10) [5] 9.6 (8.5; 10) [23] Median Health related quality of life (PedSQL)
(IQR)*** n=308 [12] 93.1 (86.1; 97.6) n=1,413 [29] 89.3 (82.1; 94.0) Median parenting daily hassles (PDH) tasks
subscale (IQR)**** 13.0 (9.0, 16.0) [63] 13.7 (10.0, 17.1) [132] Mean hospital anxiety and depression scale
(HADS) (SD)**** 10.7 (6.3) [14] 11.0 (6.2) [35]
Percentages may add up to more than 100 due to rounding. * age when questionnaire completed. **only applicable where mothers completed questionnaire. . *** missing values refer to those with ≥ 50% items on any scale missing. **** missing values refer to those with more than one item missing. IQR=Inter-quartile range. IMD: higher score indicates greater deprivation. CBQ: higher score indicates more active and more intense behaviour. PDH: higher score indicates more hassle. HADS: higher score indicates greater symptoms of anxiety/depression. Child health visual analogue scale: higher score indicates better health. PedsQL: higher score indicates better quality of life
11
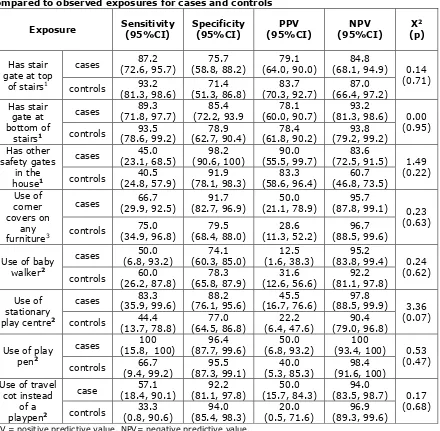
Table 2. Sensitivity, specificity and predictive values for self-reported exposurescompared to observed exposures for cases and controls
PPV = positive predictive value, NPV= negative predictive value.
1 Only people with stairs were asked these questions in the Study A questionnaire so this analysis was only
carried out on people who had stairs (cases: n=77; controls: n=74)
2 These practices were only asked for children in the two younger age groups (cases: n=59; controls: n=70)
3 All participants were asked this question (cases: n=81; controls: n=81)
Table 3 shows the frequency of exposures and ORs for the complete case and multiple imputation analyses, adjusted for confounding variables as listed. Significant findings were observed for only 2 exposures. Injured children were significantly less likely to live in a household without furniture corner covers (adjusted odds ratio (AOR) 0.72, 95%CI 0.55, 0.95), or without rugs and carpets firmly fixed to the floor (AOR 0.76, 95% CI 0.59, 0.98). There was a difference of more than 10% between odds ratios from complete case (CC) and multiple imputation (MI) analysis for only two exposures (did not use safety gate to prevent access to garden AOR(MI) 0.78, 95%CI 0.50,1.21;
AOR(CC) 1.01, 95%CI 0.58,1.74; not taught rules about running in house AOR(MI) 0.82, 95%CI 0.64,1.06; AOR(CC) 0.73, 95%CI 0.54,1.00).
Exposure Sensitivity (95%CI) Specificity (95%CI) (95%CI) PPV (95%CI) NPV (p) Χ2
Has stair gate at top
of stairs1
cases (72.6, 95.7) 87.2 (58.8, 88.2) 75.7 (64.0, 90.0)79.1 (68.1, 94.9) 84.8
0.14 (0.71) controls (81.3, 98.6) 93.2 (51.3, 86.8) 71.4 (70.3, 92.7) 83.7 (66.4, 97.2) 87.0
Has stair gate at bottom of
stairs1
cases (71.8, 97.7) 89.3 (72.2, 93.9 85.4 (60.0, 90.7) 78.1 (81.3, 98.6) 93.2 0.00 (0.95) controls (78.6, 99.2) 93.5 (62.7, 90.4) 78.9 (61.8, 90.2) 78.4 (79.2, 99.2) 93.8
Has other safety gates
in the house1
cases (23.1, 68.5) 45.0 (90.6, 100) 98.2 (55.5, 99.7) 90.0 (72.5, 91.5) 83.6 1.49 (0.22) controls 40.5
(24.8, 57.9) 91.9 (78.1, 98.3) 83.3 (58.6, 96.4) 60.7 (46.8, 73.5) Use of corner covers on any furniture3
cases (29.9, 92.5) 66.7 (82.7, 96.9) 91.7 (21.1, 78.9) 50.0 (87.8, 99.1) 95.7
0.23 (0.63) controls (34.9, 96.8) 75.0 (68.4, 88.0) 79.5 (11.3, 52.2) 28.6 (88.5, 99.6) 96.7
Use of baby walker2
cases (6.8, 93.2) 50.0 (60.3, 85.0) 74.1 (1.6, 38.3) 12.5 (83.8, 99.4) 95.2 0.24 (0.62) controls (26.2, 87.8) 60.0 (65.8, 87.9) 78.3 (12.6, 56.6) 31.6 (81.1, 97.8) 92.2
Use of stationary play centre2
cases (35.9, 99.6) 83.3 (76.1, 95.6) 88.2 (16.7, 76.6) 45.5 (88.5, 99.9) 97.8 3.36 (0.07) controls 44.4
(13.7, 78.8) 77.0 (64.5, 86.8) 22.2 (6.4, 47.6) 90.4 (79.0, 96.8)
Use of play pen2
cases (15.8, 100) 100 (87.7, 99.6) 96.4 (6.8, 93.2) 50.0 (93.4, 100) 100 0.53 (0.47) controls (9.4, 99.2) 66.7 (87.3, 99.1) 95.5 (5.3, 85.3) 40.0 (91.6, 100) 98.4
Use of travel cot instead
of a playpen2
case (18.4, 90.1) 57.1 (81.1, 97.8) 92.2 (15.7, 84.3) 50.0 (83.5, 98.7) 94.0
12
Table 3. Frequency of exposures in cases and controls and adjusted odds ratios from complete case and multiple imputation analysesExposures Cases n=582 (%) Controls n=2,460 (%) Adjusted OR
(95% CI) Confounders adjusted for∫ Used safety gates*
YES
NO 412 (75.5) 134 (24.5)
[36]
1779 (77.3) 524 (22.7) [157]
1.00
1.12 (0.83; 1.49) HADS, hours of out-of-home child care, PDH, first child
Used furniture corner covers* YES
NO 135 (23.4) 443 (76.6)
[4]
458 (18.8) 1982 (81.2) [20]
1.00
0.72 (0.54; 0.94) HADS, hours of out-of-home child care, PDH, first child, uses safety gate
Had rugs/carpets firmly fixed to the floor* YES
NO 420 (73.6) 151 (26.4)
[11]
1634 (66.9) 808 (33.1) [18]
1.00
0.77 (0.59; 0.99) HADS, hours of out-of-home child care, PDH, first child, uses safety gate
Electric cables or wires were trailing across floor ** NO
YES 464 (84.4) 86 (15.6)
[14]
1906 (80.1) 475 (19.9) [16]
1.00
0.75 (0.55; 1.02) HADS, hours of out-of-home child care, PDH, first child, uses safety gate
Items on the floor which could be tripped over** NO YES 184 (33.2) 371 (66.8) [14] {18} 725 (29.9) 1698 (70.1) [16]{63} 1.00
1.07 (0.82; 1.38)
HADS, hours of out-of-home child care, PDH, first child, uses safety gate
Back door was locked to prevent access to garden** YES
NO 304 (61.2) 193 (38.8)
[17] {68}
1327 (60.9) 851 (39.1) [23]{259}
1.00
0.97 (0.75; 1.27) HADS, hours of out-of-home child care, PDH, first child, uses safety gate
Used safety gate to prevent access to garden** YES NO 42 (10.3) 364 (89.7) [16]{160} 111 (6.4) 1631 (93.7) [36]{682} 1.00
1.01 (0.58; 1.74)
HADS, hours of out-of-home child care, PDH, first child, uses safety gate
Child played in garden without adult present** NO
YES 367 (70.4) 154 (29.6)
[13]{48}
1456 (65.4) 770 (34.6) [27]{207}
1.00
0.89 (0.68; 1.17) HADS, hours of out-of-home child care, PDH, first child, uses safety gate
Had taught child rules about slippery floors YES
NO 336 (60.7) 218 (39.3)
[28]
1484 (62.0) 910 (38.0) [66]
1.00
1.13 (0.83; 1.52) HADS, PDH, first child uses safety gate
Had taught child rules about running in the house YES NO 352 (64.0) 198 (36.0) [32] 1454 (60.8) 939 (39.2) [67] 1.00
13
Safety practices measured only in children aged0-36 months
Cases n=428
(%)
Controls n=1797
(%)
Adjusted OR
(95% CI) Confounders adjusted for∫
Used baby walker* NO
YES
306 (72.3) 117 (27.7) [5]
1243 (70.1) 530 (29.9) [24]
1.00
0.83(0.59; 1.16)
HADS, hours of out-of-home child care, PDH, first child, uses safety gate, playpen/travel cot, activity centre Used playpen or travel cot*
YES
NO 75 (17.9) 345 (82.1)
[8]
252 (14.2) 1521 (85.8) [24]
1.00
0.90 (0.61; 1.33)
HADS, hours of out-of-home child care, PDH, first child, uses safety gate, baby walker, activity centre
Used stationary activity centre* YES
NO
71 (16.9) 350 (83.1) [7]
381 (21.5) 1391 (78.5) [25]
1.00
1.37 (0.95; 1.97)
HADS, hours of out-of-home child care, PDH, first child, uses safety gate, baby walker, playpen/travel cot
14
There was a significant interaction (p=0.002) between the number of adults in the household and rugs or carpets not being firmly fixed to the floor (See Table 4). In one-parent households, having rugs or carpets not firmly fixed to the floor significantly increased the odds of a fall on one level (AOR 2.54, 95%CI 1.16, 5.54) but in [image:14.595.64.507.234.358.2]households with more than one adult, the odds of a fall were significantly reduced (AOR 0.69, 95%CI 0.52, 0.90). One of the AORs for the interaction analyses differed between analyses using the multiply imputed and complete case data by more than 10%.
Table 4. Comparison between complete case analysis and analysis using multiple imputation where significant interactions were found in the complete case analysis
Exposure
Adjusted OR
(95% CI) by number of adults living
with child interaction Test for One adult More than one
adult
Did not have
rugs/carpets firmly fixed to the floor *
2.54 (1.16, 5.54) 0.69 (0.52, 0.90) P=0.002
Adjusted for confounders as in Table 3.
* in the last 24 hours.
DISCUSSION
Falls on one level result in considerable morbidity and health service use in the under-fives, but our
study did not find
safety practices, use of safety equipment or home hazards which reduced the odds of a medically attended fall on one level. Conversely, we found not using furniture covers and not having rugs or carpets firmly fixed to the floor were associated with decreased odds of a fall on one level. Validation of exposures showed high (>70%) sensitivity and specificity for only 2 of the 8 items measured on home visits (safety gates at top and bottom of stairs).This study has a number of strengths. It is the first case-control study exploring a wide range of modifiable risk factors for falls on one level in young children. We recruited more than the required sample size, adjusted for a wide range of confounding variables, and findings in the multiple imputation analyses were very similar to those in the
complete case analysis. Home observations found most exposures were reported with similar accuracy in cases and controls.
Our results should be interpreted in the context of the limitations of this study. Although participation rates were the same for cases and controls, they were low. This raises the possibility of selection bias if participation was associated with exposures or with
15
we were unable to measure exposures in non-participants, so the extent to whichselection bias may have occurred is unknown. Exposures were self-reported, so recall and social desirability bias may have also have occurred. The results of our validation study indicate that some exposures were likely to have been misclassified, which may have resulted in odds ratios tending towards unity. The prevalence of some exposures amongst controls differed from that used in our sample size calculation (five were lower, four were higher), so our study may have been underpowered to detect associations between some exposures and falls on one level. This particularly applies to using safety gates anywhere in the house and across kitchen doors to prevent garden access, having trailing cable on floors and use of baby walkers and playpens. Conversely, the large number of statistical tests undertaken may have resulted in type 1 error which may explain the small number of significant associations we found. Our study did not differentiate cases by whether the fall occurred in the house or in the garden although we did collect data on exposures relevant to both the house and garden. In addition we did not collect data on the type of floor coverings within homes or in gardens because our study would have been underpowered to detect differences between cases and controls for such exposures. Larger studies would be required to study falls in houses and gardens separately and to explore the risks associated with different types of floor covering.
16
Many falls on one level occur to young children whilst learning to walk or during play and although our study limitations may explain our negative findings, it is also possible that the exposures we measured do not protect against falls on one level in this age group.Comparisons with previous research
One small Australian case-control study recruited infants aged 6-12 months with head or face trauma attending EDs and compared them to age matched community controls 42. In contrast to our findings, they found infants using baby walkers most days and those starting using walkers before 8 months of age had a 2-3 fold higher odds of a head injury than those who used walkers less frequently or started use at an older age. Differences in the findings of the two studies may relate to inclusion of multiple mechanisms of falls or design changes to baby walkers after the introduction of new European standards in 2005.43.
Implications for research and practice
Further research is required to identify modifiable risk factors for falls on one level in young children, including those our study was underpowered to detect and type of flooring. As we did not find a reduced risk of falls on one level with any safety practices or items of safety equipment, exploring the effect of parental supervision on falls risk would be useful. Self-controlled case series incorporating time varying measures of supervision, safety practices, safety equipment use and hazards may be helpful.
Development of valid measures of parental reported supervision, which were not subject to recall bias between parents of injured and uninjured children, would greatly assist in this process. Our findings do not provide evidence to change the advice currently given to parents about reducing the risk of falls on one level in young children.
What is already known on this subject
Childhood falls are an important global public health problem, but there is a lack of evidence about their prevention.
Falls on one level result in considerable morbidity and are costly to health services.
What this study adds
None of the safety practices or home hazards measured in this study was found to reduce the odds of having a medically attended fall on one level in children aged under 5 years.
17
ACKNOWLEDGEMENTSWe wish to thank the parents who participated in the study. We would also like to thank the Principal Investigators, liaison health visitors, research nurses and other staff from the emergency departments and minor injury units who assisted with recruiting
participants from Nottingham University Hospitals NHS Trust, Derby Hospitals NHS Foundation Trust, Norfolk and Norwich University Hospitals NHS Foundation Trust, James Paget University Hospitals NHS Foundation Trust, University Hospitals Bristol NHS
Foundation Trust, North Bristol Healthcare Trust, Newcastle Upon Tyne Hospitals NHS Foundation Trust, Gateshead NHS Foundation Trust and Northumbria Healthcare NHS Foundation Trust. We gratefully acknowledge the support provided for recruitment by the Primary Care Research Networks for East Midlands and South Yorkshire,
Leicestershire, Northamptonshire and Rutland, East of England, Northern and Yorkshire and from South West and Trent, Norfolk & Suffolk, Northumberland Tyne and Wear and Western Comprehensive Local Research Networks. Written permission has been obtained and we thank Joanne Ablewhite, PhD, Clare Timblin, BA, Philip Miller, PhD, Jane Stewart, MA, and Persephone Wynn, PhD, from the University of Nottingham; Lisa McDaid, MSc, Clare Ferns and Nathalie Horncastle from the Norfolk and Norwich University Hospitals NHS Foundation Trust; Toity Deave, PhD, Pilar Munoz and Benita Laird-Hopkins, BSc, from the University of the West of England, Adrian Hawkins, BSc, Emma Davison, BA, and Laura Simms, BA, from the Great North Children’s Hospital, Newcastle upon Tyne and Bryony Kay, BSc, from the Bristol Royal Hospital for Children who helped with recruitment, data collection, prepared data for analysis or commented on drafts of papers. We would like to acknowledge the following Principal Investigators who
contributed to obtaining funding, study design, project management in their centres and to interpretation of analyses and commented on drafts of papers: Elizabeth Towner, PhD (University of the West of England), Elaine McColl, PhD (Newcastle University), Richard Reading, PhD (Norfolk and Norwich University Hospitals NHS Trust), Alex J Sutton, PhD, and Nicola Cooper, PhD (University of Leicester) and Frank Coffey, (Nottingham
University Hospitals NHS Trust). We are also very grateful to Rose Clacy, lay research adviser, who attended project management meetings, helped draft and pilot study documentation, advised on recruitment strategies and commented on drafts of the paper.
FUNDING ACKNOWLEDGEMENTS
18
COMPETING INTERESTS: NoneCONTRIBUTERS: DK had the original idea for the study, designed the study, supervised data collection, contributed to writing the data analysis plan, undertook analyses and drafted sections of the paper. PB contributed to writing the analysis plan, collected data, undertook analyses, contributed to the interpretation of the data and drafted sections of the paper. BY contributed to cleaning of the data, to interpretation of the data and drafted sections of the paper. CC contributed to the design of the study, writing the analysis plan, advised on analyses and on interpretation of data and contributed to drafting the paper. MW contributed to the study design, to interpretation of the data and drafted sections of the paper. PH collected data, contributed to interpretation of the data and to drafting the paper. MH contributed to the study design, to interpretation of the data and to drafting the paper. TG collected data, contributed to interpretation of the data and to drafting the paper. GM-N collected data, contributed to interpretation of the data and to drafting the paper. All authors agreed the final version of the paper.
REFERENCES
![Table 1. Characteristics of cases and controls (percentage, unless stated otherwise) [missing values]](https://thumb-us.123doks.com/thumbv2/123dok_us/8665857.375977/9.595.65.532.387.758/table-characteristics-controls-percentage-unless-stated-missing-values.webp)