1
Consistent assignment of the vibrations of symmetric and asymmetric para-disubstituted
benzene molecules
Anna Andrejeva, Adrian M. Gardner, William D. Tuttle and Timothy G. Wrighta,*
a
School of Chemistry, University of Nottingham, University Park, Nottingham, NG7 2RD, U.K.
*To whom correspondence should be addressed. Email: [email protected]
Abstract
We give a description of the phenyl-ring-localized vibrational modes of the ground states of the para -disubstituted benzene molecules including both symmetric and asymmetric cases. In line with others,
we quickly conclude that the use of Wilson mode labels is misleading and ambiguous; we conclude
the same regarding the related ones of Varsányi. Instead we label the modes consistently based upon
the Mulliken (Herzberg) method for the modes of para-difluorobenzene (pDFB). Since we wish the labelling scheme to cover both symmetrically- and asymmetrically-substituted molecules, we apply
the Mulliken labelling under C2v symmetry. By studying the variation of the vibrational wavenumbers
with mass of the substituent, we are able to identify the corresponding modes across a wide range of
molecules and hence provide consistent assignments. Particularly interesting are pairs of vibrations
that evolve from in- and out-of-phase motions in pDFB to more localized modes in asymmetric
molecules. We consider the para isomers of the following: the symmetric dihalobenzenes, xylene, hydroquinone, the asymmetric dihalobenzenes, halotoluenes, halophenols and cresol.
2
I. INTRODUCTION
Because an understanding of the trends in the vibrational spectroscopy and dynamics of molecules is
linked to being able to refer to the same vibrational motions (normal modes) across species, it is
desirable to label these in as consistent a manner as possible. In this way, when referring to a labelled
vibration in one molecule, one can be sure of talking about the same vibration in a different molecule.
Since there are a whole range of substituted benzenes, it has been very common to refer to the phenyl-
ring-localized vibrations of any such molecule in terms of the vibrations of the parent benzene
molecule via the Wilson labelling scheme [1]. In previous work on the monosubstituted benzenes it
has been noted by our group [2] and others [3,4] that in fact the use of the Wilson labelling scheme is
fraught with uncertainty owing to the large differences between the forms of the normal modes of
benzene and those of the monosubstituted species; this difference occurs even for the substitution of H
for D in monodeuterated benzene [2]. This has been recognized by many workers, perhaps most
notably Varsányi [5], who attempted to bring consistency to the labelling by proposing Wilson-type
labels for a whole range of substituted benzenes; unfortunately, however, this was hampered by
incomplete data sets, and there was also inconsistency concerning the employed labelling for
molecules that contained “light” and “heavy” atoms; hence there are still numerous anomalies. We
have previously noted this in Ref. [2] and in recent work on the electronic spectroscopy of the
monohalobenzenes [6,7,8], where Varsányi’s suggested labels for the normal modes of fluorobenzene
were different to those of the heavier species, even when the motion was very similar. In Table 1 we
have given Varsányi’s assignments of the p-difluorobenzene (pDFB) and p-dichlorobenzene (pDClB)
vibrations, and although there is predominantly consistency across the a2, b1 and b2 modes, the
ordering of the a1 modes is significantly different. We also note that denoting the lowest wavenumber
b2 vibration as 15 is consistent with Varsányi’s assignments for chlorobenzene, but not fluorobenzene
[2,6,7]. In addition, and as will be discussed below, in many cases the assignments do not match the
motion as determined using a Duschinsky approach, and indeed in a number of cases there is no clear
Wilson mode with which to identify the vibration.
One possible way forward would be to use Mulliken labelling [9] (sometimes called Herzberg
labelling [10]), whereby the normal modes are simply separated into symmetry blocks (in a
predetermined order) and then to order them within these by wavenumber, with the highest first. This
does, indeed, lead to a systematic and facile attribution of a mode label; however, it means that if the
symmetries of two molecules are different and/or if the substituent itself contributes vibrations, then
the label for a particular normal mode will alter from molecule to molecule making trends in
vibrational wavenumber and activity difficult to see. However, there is a simple way forward: in Ref.
[2] we noted that although there were stark differences in normal modes on moving from benzene-h6
3
was very little further change if the subsituent’s mass was 15 amu or greater. On the grounds that
fluorobenzene was the simplest type of monosubstituted benzene with a substituent mass 15, we
adopted the Mulliken labelling of the fluorobenzene normal modes, labelled Mi, for all monohalobenzenes. Further, for any substituent that had more than one atom and so would be
contributing vibrations, such as CH3 in the toluene molecule, we separated the substituent-localized
vibrations from the list, so that the thirty phenyl-ring-localized normal modes constitute the Mi
vibrations. These are usually easily identified, but also, as we showed in Ref. [2], by taking the
calculated force field for fluorobenzene and artificially changing the mass of the fluorine atom to the
combined mass of any substituent (e.g. to 15 for toluene), then very good approximations to the
ring-localized mode wavenumbers can be obtained, and so the modes identified. Finally, calculated
vibrational modes can then be cross-checked against visualizations and comparisons made to those of
fluorobenzene (presented in Ref. [2]).
The question then arises as to whether the same labelling scheme can be applied to other families of
substituted benzenes or, if not, whether similar schemes will work. In the present work we target the
para-disubstituted benzenes, with ortho and meta versions left until a later date. We will examine the S0 normal modes for a range of substituents, both symmetric (p-C6H4X2) and asymmetric (p
-C6H4XY). We shall initially consider how the Wilson modes of benzene evolve into those of the
pDFB species. Following that, we shall consider how the Mi modes of fluorobenzene (FBz) are
related to those of pDFB, and then how the pDFB modes evolve as the halogen mass changes for symmetric (p-C6H4X2) and asymmetric (p-C6H4XY) cases. It will be concluded that it is indeed
possible to label the vibrations consistently across a wide range of substituents based on the pDFB vibrations.
II. COMPUTATIONAL DETAILS
All of the harmonic vibrational frequencies were obtained using B3LYP/aug-cc-pVTZ calculations
via the GAUSSIAN 09 software package [11]. For bromine and iodine atoms, the fully relativistic
effective core potentials, ECP10MDF and ECP28MDF respectively, were used with corresponding
aug-cc-pVTZ-PP valence basis sets. All of the calculated harmonic vibrational wavenumbers were
scaled by the usual factor of 0.97 as an approximate method of obtaining anharmonic wavenumber
values. We note that in our recent work on toluene [12,13] we found that these scaled harmonic values
were at least as reliable as the explicitly calculated anharmonic values (with the latter being very
expensive to calculate). In addition, in our previous work on the monohalobenzenes [6,7,8] our
calculated scaled harmonic frequencies, except for a few low wavenumber vibrations, matched the
4
In the following we shall make use of vibrational wavenumbers calculated for the actual molecule,
which we shall refer to as “explicit”, and also vibrations that are calculated using one molecule’s force
field, but then artificially changing the mass of one or two atoms (referred to as artificial isotopes in
the below) to match those of substituents (atomic or otherwise), which we shall refer to as “iso”. In
this way we can map out changes in the vibrational wavenumbers that occur solely from the mass
effect. In addition, we shall calculate generalized Duschinsky matrices using FC-LabII [14].
III. ASSIGNMENT OF THE S0 VIBRATIONAL MODES of pDFB
We have already shown in previous work that the benzene Wilson modes are very different to those
for monofluorobenzene (FBz) [2]: this is not so surprising as the normal modes will naturally need to
change to compensate for the motion of a fluorine atom instead of a hydrogen. In a generalized
Duschinsky picture, one can view the vibrations of FBz as mixed versions of the benzene Wilson
modes, and this indicates that it is not always straightforward to make a 1:1 correspondence between a
vibration of FBz and a Wilson mode of benzene from calculated vibrational mode diagrams [2,3,4].
Indeed attempting such a process for substituted benzenes has led to much frustration to workers in
this area over the years. We thus anticipate that there will be significant differences between the
vibrations of benzene and the corresponding para-disubstituted molecule, pDFB, and also between FBz and pDFB. In particular, in pDFB the motions of the fluorine atoms can be “in-phase” or
“out-of-phase”, with these requiring different displacements of the other atoms, in order to keep the centre of
mass stationary in each normal mode; conversely, if the vibration is such that the fluorine atoms are
not moving, then we expect the motion and vibrational wavenumber to be similar in all three
molecules.
For the cases where the substituents are both atomic, then the symmetric para-substituted benzenes
(pC4H4X2) have D2h symmetry; however, since we wish the labelling scheme to cover
asymmetrically-substituted molecules (pC6H4XY) as well, we employ C2v symmetry throughout. As we noted, we
shall also be able to establish the vibrational labelling of the phenyl-ring-localized vibrations for
non-atomic substituents by “artificial isotope” (“iso”) calculations, mentioned above. For all cases in the
present paper, we place the molecule in the yz plane, and the z axis runs through the two substituent atoms (or through each of the atoms of the substituents that is directly bonded to the phenyl ring).
This means we separate the vibrations into 11a1 + 3a2 + 6b1 + 10b2 groupings by symmetry, and this
will the case for both symmetrically- and asymmetrically-substituted molecules. Further, for
molecules with a non-atomic substituent, such as a CH3 group, the experimental and “explicit”
calculation values will include modes that are substituent-localized: these do not form part of the
labelled vibrations and must be treated separately; these are straightforwardly identified from their
5
In the following we shall first discuss how the pDFB modes are related to the Wilson modes and, as expected from our monosubstituted work, will conclude that the Wilson labels are not appropriate.
We shall then look at whether the FBz vibrational labels, the Mi labels of Ref. [2], can be used to label the para-disubstituted vibrational modes; again, we shall conclude this is not possible. We shall then explore whether one can use the vibrational mode labels of pDFB for other symmetric and then
asymmetrically para-disubstituted halobenzenes. We shall conclude that this is possible and shall then examine this labelling scheme finding that it also works well for p-xylene (pXyl), hydroquinone
(HQ), halotoluenes, p-cresol and halophenols.
A. Wilson labelling
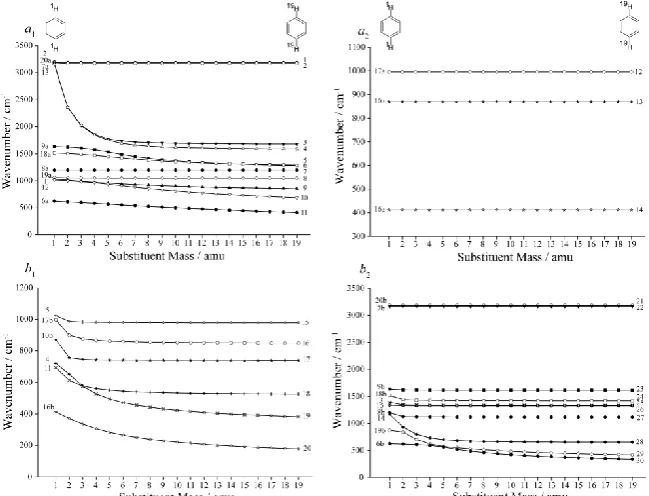
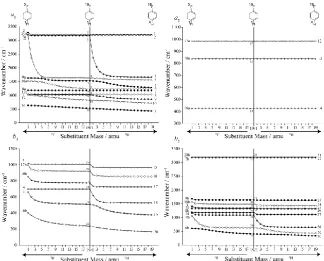
In Figure 1 we show how the vibrational wavenumbers of benzene change as the masses of two para -related hydrogen atoms are varied from 1 to 19 amu simultaneously, keeping the force field constant.
(Note that we have done the same plot with the force field of pDFB and varying the mass of the two fluorine atoms from 19 to 1 amu and get essentially the same picture.) On the left-hand side of the
diagram we have labelled each mode with the Wilson labels, while on the right-hand side we have
labelled the modes with a label, Di, with the D representing “disubstituted” and i being determined by
the Mulliken ordering of the vibrations of pDFB in the C2v point group. We have separated the
vibrations into C2v symmetry groups in the plots, and have used the same symbol and line type for
those pairs of vibrations that are connected to the same degenerate benzene mode, but which have a
different symmetry in the C2v point group. It is immediately seen that some vibrational modes are very
mass dependent, falling dramatically with mass, while others are almost completely mass
independent; in between there are others that have a significant but more subtle mass dependence. A
number of the curves look like they undergo “avoided crossings”, a general feature that we noted for
the monosubstituted benzenes in Ref. [2]. We interpret these in terms of the changing forms of the
vibrations, which can loosely be thought of as mixing together as the vibrations become close together
(i.e. in the region of a crossing, the normal modes look like superpositions of the motions of the two
separated vibrations). We find that, after the avoided crossing, the vibrations gradually move back to
their original form, but are now switched in energy: this is very reminiscent of the behaviour of
avoided crossings for potential energy curves of diatomic molecules. In Table 1 we compare the
normal modes of benzene by examining the overlap of their vibrational wavefunctions to those of
pDFB via the calculation of a generalized Duschinsky mixing matrix. The magnitude of the
Duschinsky matrix elements are indicated in Table 1 with the key that: if the mixing coefficient is >
0.5, we denote this as a dominant contribution and employ bold text; a mixing coefficient between 0.2
and 0.05 is a minor contribution, and is listed within parentheses; contributions with a coefficient
between 0.5 and 0.2 are listed as major contributions and listed with no parentheses; and contributions
< 0.05 are ignored. If there are multiple major/minor contributions, they are listed in descending order
6
been misnumbered in various texts over the years, with the following switches often being required:
8a 9a, 8b 9b, 18a 19a, 18b 19b and 3 14; where they have occurred, these
misnumberings have been corrected in the present work. In Table 1 we also give the D2h symmetries
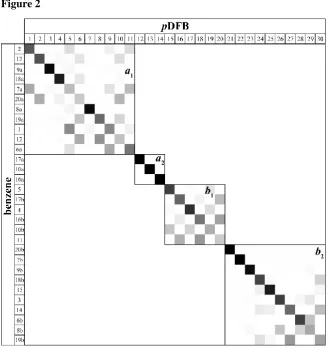
for each vibration. In Figure 2 we indicate the Duschinsky mixing coefficients by shading, to allow a
quick visual assessment of the extent of mixing between the different vibrational modes.
We have also undertaken a comparison of the Mi modes of FBz with the Dimodes (see above) of
pDFB. To do this we have first taken the force field for FBz and then calculated the wavenumbers as
the mass of the para hydrogen has been increased from 1 to 19; again we maintain C2v symmetry
throughout and again we separate the vibrations into the four symmetry groups. We present the results
graphically in Figure 3, where we have also included the variation in the wavenumbers of the
vibrations from FBz to Bz – these parts of the plots are very similar to those shown in Ref. [2]. In
Table 1 we have also indicated how the Di and Mi modes are related to each other, in terms of generalized Duschinsky mixing.
In the following we shall discuss the trends of the vibrations in symmetry groups, from Bz FBz and
from FBz pDFB; later we shall discuss previous assignments of the pDFB vibrations, as compared
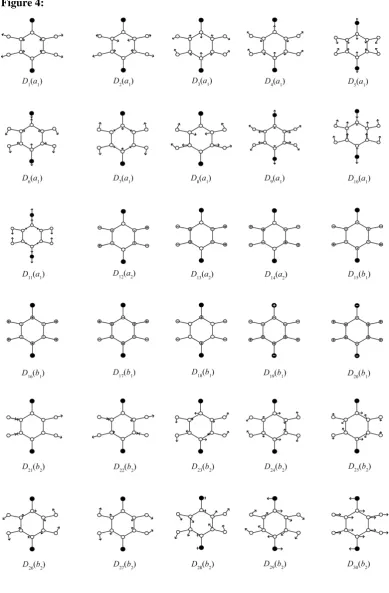
to the calculated values. We present the vibrational mode diagrams of the Di modes of pDFB in
Figure 4, which are in order of C2v symmetry group and then by wavenumber, as discussed above.
1. a1 vibrations
There are four high-wavenumber vibrational modes in benzene that transform as a1 symmetry under
the C2v point group: these are the 2, 20a, 7a and 13 modes, given in order of their calculated
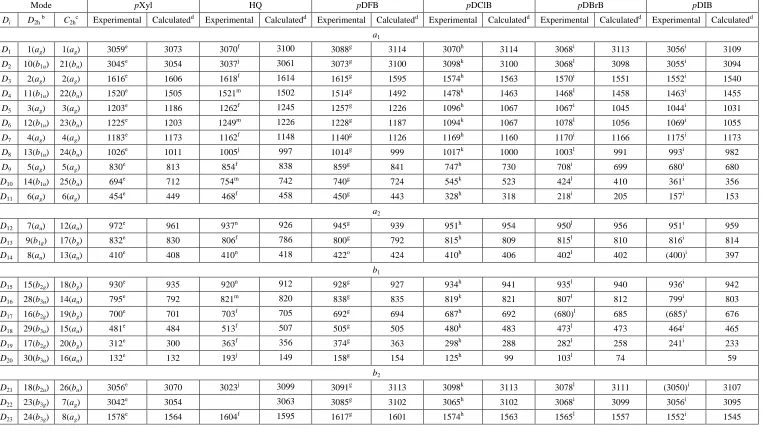
wavenumbers. The explicit calculated wavenumbers for pDFB are given in Table 2, where it can be
seen that there are only two high wavenumber vibrations, D1 and D2, consistent with the fact that
Figure 1 shows that two vibrations fall dramatically in wavenumber as we move from Bz pDFB
via a symmetric mass change. Interestingly, when considering asymmetric mass changes, Figure 3
shows that one of these vibrations falls in wavenumber from Bz FBz, while one stays relatively
constant, and then when the para hydrogen is subsequently changed in mass the other vibration falls
in wavenumber from FBz pDFB. Helped by the results for monodeuterated benzene and FBz in
Ref. [2], here we can establish that the two highest-wavenumber modes in pDFB have dominant
contributions from Wilson modes 2 and 13, with the 7a mode losing its identity between Bz and
FBz, while the 20a mode loses its identity between FBz and pDFB. Both 7a and 20a then appear only
as non-dominant contributions to other pDFB vibrations (Table 1). (In a similar way, although the
7
vibration has lost its identity and contributes to a number of the Mi modes [2,6].) With regard to the
Mi modes, on moving from FBz to pDFB we find the M2 mode loses its identity and only appears
via non-dominant contributions to a number of Di modes, as can be seen in Table 1. (The Mi mode diagrams are given in Ref. [2].)
It is very interesting to note that the four high-wavenumber modes of benzene, 2, 7a, 13 and 20a all
have H motion at the ipso and para positions and so it might have been expected that all would fall in wavenumber as the mass of the corresponding “hydrogen” atoms were increased; however, the
motions mix quite significantly (Figure 2 and Table 1) in forming the Di modes resulting in the D1 and
D2 modes having very little motion of these H atoms. A possible interpretation of this behaviour is
that D1 is made up of combinations of 2 and 7a, which respectively have in- and out-of-phase
motions of these hydrogens and that these then cancel in forming D1, while the enhanced ipso and
para motion of the other vibration formed upon substitution causes a stark falling in wavenumber,
which is revealed by the 7a mode mixing with other a1 vibrations, all the way down to D11. A similar
picture holds for the formation of D2 from 13 and 20a, this time resulting in contributions of 20a to
vibrations down as far as D10, and D2 having a dominant contribution from 13 (Table 1).
This picture also fits in with the mixings at the “intermediate” FBz stage (see Duschinsky mixings in
Refs. [2,6]), where these four vibrations mix to form M1–M3, with respective dominant contributions
from 2, 20a and 13 – the fourth resultant vibration falls strongly in wavenumber with the single
substitution and results in contributions of 7a to a range of Mi modes all of the way down to M11. The
mode diagrams (see Ref. [2]) indicate that all three modes, M1–M3, have para position H motion, but
again combinations of these form when moving from FBz pDFB to give rise to D1 and D2, with
dominant contributions from M1 and M3, respectively; and the third vibration falls in wavenumber and
leads to mixing of M2 into Di modes down to D11 (Table 1).
We now highlight the fact that the next two pDFB vibrations, D3 and D4 have dominant contributions
from Wilson modes 9a and 18a and that these two vibrations are dominant contributions to modes M4
and M5 [2,6] consistent with the make-up of these two Di modes (Table 1). Looking at Figures 1 and
3, we can trace these modes across the diagram noting that they appear to be crossed by other Mi and
Di modes as the masses increase, yet regain their identities after the crossings. The next two Di modes,
D5 and D6 are extremely mixed both in terms of Wilson or Mi modes; as such, these are vibrations that
can only unambiguously be identified with their Di labels. The D7 mode has essentially the same
motion as the Wilson mode 8a, or the M7 mode of FBz, while the D8 mode can be strongly associated
with the Wilson 19a mode, or M8. Modes D9 and D10 are heavily mixed in terms of both Wilson and
Mi modes and so can only be unambiguously identified with their Di label; D11 has a dominant
8
however, that the M11 mode becomes associated with Wilson mode 7a for the heavier
monohalobenzenes [7,8].) Finally, it is interesting to note that D5 and D6 both have dominant
contributions from M6; additionally, D9 and D10 both have dominant contributions from M10. We have
mentioned that M2 loses its identity when moving from FBz to pDFB, and this is also true of M9,
which provides major and minor contributions to a range of Di modes.
The mixings for Bz pDFB can be seen in a more visual way in the Duschinsky matrix in Figure 2,
while a similar figure and other discussion for Bz FBz has been presented in our earlier work [2,6].
a2 vibrations
The three vibrations of a2 symmetry, D12, D13 and D14 have very similar atomic motion to the
corresponding Wilson modes in benzene (17a 10a and 16a), none of which involve the substituted
atoms; a similar picture holds when moving from FBz pDFB This effect is exemplified in the close
to horizontal line in the mass correlation diagrams for this symmetry block in Figures 1 and 3, which
show that the vibrational wavenumbers are almost entirely mass independent. As such these modes
can be described with any of the three labelling schemes discussed herein. The Duschinsky matrix in
Figure 2 also shows this clearly.
b1vibrations
Wilson modes 5 and 17b appear to have in and out-of-phase, out-of-plane motion of the ipso and
para hydrogens and these combine together to form the D15 and D16 modes in pDFB there is also
mixing in of the 10b motion, which has a similar out-of-plane C-H motion as 5, but these two
vibrations have a different phase with respect to the motion of the other C-H groups. It is notable that
the low-wavenumber 11 vibration contributes to these vibrations (Table 1). A similar story holds for
the M15–M17 modes when the Wilson modes are considered for benzene FBz (Refs. [2 , 6]) and it is
thus unsurprising that when moving from FBz pDFB, we see that the D15 and D16 modes are
mainly made up of those Mi modes. In summary, although D15 and D16 have dominant contributions
from 5 and 17b, respectively, they have majority contributions from other modes and so will have
differing motions from the Wilson (or Mi) modes.
The next four Di modes, D17 – D20, are interesting in that although they become mixed versions of the
corresponding Wilson modes 10b, 4, 11 and 16b, with the three highest wavenumber ones having
dominant contributions, although the ordering has changed as a result of avoided crossings that can be
seen in Figure 3. Furthermore, the lowest wavenumber mode, D20, has its largest (major) contribution
from 16b, but this latter mode is also the dominant contribution to mode D18. Thus, there is much
mixing and wavenumber order change in these b1 vibrations. In terms of the Mi labels a similar story
holds, although we note that modes M16 and M17 do not appear as dominant contributors to any
9
dominant contribution to M18 which does not change much from Bz FBz; however, from FBz
pDFB the M17 and M18 vibrations appear to involve in- and out-of-phase motions of the para
hydrogens. These vibrations then mix when moving from FBz pDFB, with one resultant vibration,
D17, being largely independent of mass, while the other drops sharply and leads to the M17 vibration
contributing to a range of Di modes, down to D20.
In summary, neither the Wilson nor Mi labels are appropriate for these vibrations, with D20 only being
unambiguously identifiable with its Di label. Finally, it is interesting to note that both D19 and D20
have dominant contributions from the FBz mode M20, and that both M16 and M17 lose their identities
upon moving from FBz to pDFB.
b2 vibrations
The first four vibrations of b2 symmetry, D21 – D24, have motions that are very close to the
corresponding Bz vibrations 20b, 7b, 9b and 18b (Table 1), and also close to the corresponding Mi
modes (Refs. 2 and 6).
Modes D25 and D26 are also well described by Wilson modes 15 and 3, although the wavenumber
ordering has swapped over. In terms of the Mi labels there are dominant and major contributions from
M26 to these vibrations, respectively, while M25 only appears as non-dominant contributions to these
(and other) vibrations. Each of M25 and M26 are made up of major contributions from 15 and 3, and
during the FBz pDFB phase, these Mimodes mix and then largely resolve back to the original
Wilson motion; albeit in the reverse order.
The next four modes, D27 – D30 are less straightforward, with D27 and D28 having dominant
contributions from Wilson modes 14 and 6b, respectively, but these are not in the same wavenumber
order as in Bz; indeed, the situation is a little more complicated as evinced in Figure 3. By making use
of the FBz mixing results from Refs. [2 and 6] it can be seen that 14 mixes with the 8b mode from Bz
FBz to yield one mode that is relatively insensitive to mass changes in the ipso positon, and this
becomes the M27 mode that is largely 14; the other mode, which is more mass sensitive, falls in
wavenumber leading to further mixings of 8b as far down as M30. This leaves M28 being dominated by
19b and M29 being dominated by 6b (see Refs. [2, 6]). When moving from FBz pDFB, M28
undergoes mixing with M27, forming the D27 vibration, which is largely independent of mass changes
in the para position, and is made up dominantly from the original 14 Wilson mode, with an admixture
of 19b. The other vibration appears to be largely composed of M27, and whose behaviour hereafter is
controlled by the 8b character, which continues to fall in wavenumber leading to interactions with the
10
a number of vibrations (see Figure 3). The M29 mode largely retains its 6b character, becoming D28
after a flirtation with the M28.
The two lowest modes D29 and D30 are mixed both in terms of Wilson or Mi vibrations, although it is
notable that M30 is a dominant contribution to both of these, with each containing minor contributions
from the M27 mode; however, there is no dominant contribution of the M27 mode to any Di mode. The
D29 vibration is the eventual resting place for the plunging 8b, although it has left behind
contributions to other vibrations on the way. The D30 mode largely arises from the fact that M28 falls
in wavenumber: with its dominant contribution from 19b, this leads to a major contribution from this
vibration to D30, although there are other major contributions from 14 (via the interaction with M27)
and, surprisingly, 18b.
In summary, a number of the b2 vibrations can be connected with a Wilson mode, although the
ordering is not always as expected. Further, for some of these, the motion will be significantly
affected by mixing, and in two cases the mixing is severe and these can only be unambiguously
identified by their Di label.
B.Trends in vibrational wavenumbers of pC6H4X2 and assignment of vibrations
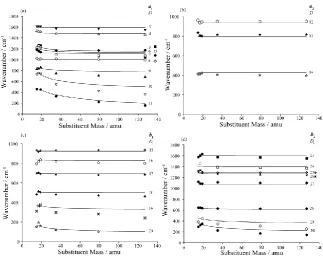
In Figure 5 we show the variation of the wavenumber for each of the Di vibrations from 15 amu onwards with simultaneous variation of the mass of the two X substituents and indicated with the
lines. (The symbols represent the experimental values and will be discussed further below.) These
have been calculated by taking the force field of pDFB and artificially changing the mass of the F
atoms from 15 through to 127, with the lightest mass matching that of a CH3 group and the heaviest
matching that of the iodine atom. As may be seen, although there is some variation with mass, it is
nothing like as stark as that found between Bz and pDFB (Figure 1), and in particular there are no avoided crossings or evidence for large mixings or deviations of the vibrational motion. However the
ordering of the explicitly calculated wavenumbers of D5, D6 and D7 do change with increasing mass of
the halogen, which is not reflected in the isotopic wavenumbers of these vibrations. Along this series,
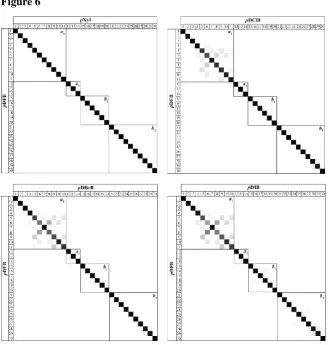
we shall be interested in masses that correspond to those for p-xylene (pXyl), pDFB, pDClB, p -dibromobenzene (pDBrB) and p-diiodobenzene (pDIB). In Figure 6 we show Duschinsky matrices for the vibrations obtained at these corresponding masses, with the comparison being with pDFB in all
cases. As may be seen, there is a strong diagonal nature to the matrices suggesting that the pDFB vibrational motions will be close to those of the respective molecules, and so we can give the
vibrations a Di label accordingly.
In producing Figure 5 and Table 2, we had to assign the vibrational wavenumbers to the Di modes,
11
been in terms of Mulliken, Wilson and Varsányi labels, with the emphasis on the former. To aid the
reader, we have included the D2h Mulliken and symmetry labels for each of the Di vibrations in Table
2, while in Table 1 the Varsányi labels have been included for pDFB and pDClB.
1. para-difluorobenzene
We now look at the previous assignments of the vibrations of the S0 state of pDFB, which may be
viewed as the prototypical para-disubstituted benzene molecule and has been the subject of a number of spectroscopic investigations beginning in the early 1950s. Generally, the fundamental vibrational
wavenumbers derived in the earlier studies are in good agreement with the most recent vapour-phase
IR/Raman study by Zimmerman and Dunn in 1985 [15]. This paper also makes frequent reference to
unpublished electronic spectroscopy results, which do not appear to have been published since then;
although there is an earlier published fluorescence study of solid samples at 4 K by one of the authors
[16]. The assignments in Ref. [15] largely confirm those made in earlier investigations, but several
vibrational wavenumbers are reassigned and this work has been used as the key reference for the S0
vibrational wavenumbers in later studies. Despite this, we believe several vibrational wavenumbers
have been incorrectly assigned in Ref. [15]. The first of which is the vibrational wavenumber assigned
to D24 (which is a b2u symmetry mode, ν19 in Mulliken numbering). This vibration was assigned to a
wavenumber of 1437 cm-1 in previous work [23], however Zimmerman and Dunn suggested that this could be incorrect if that feature corresponded to one they saw at 1431 cm-1 with the wrong band profile; on this basis they assigned a wavenumber of 1633 cm-1 to this vibration [15]. However, based on calculated vibrational wavenumbers, and through comparison with the wavenumber of this
vibration in other para-disubstituted molecules (vide infra), we believe that this assignment is incorrect, while the original assignment fits well with our calculated wavenumber and trends across
the series. Jarzęcki et al. [17] were also not convinced by the reassignment of the D24 wavenumber in
Ref. [15] based on disagreement with their calculated vibrational wavenumber.
The wavenumber associated with the highest b2u vibration, D21, which in previous work and Table 2
of Ref. [15] was given as 3073 cm-1, was given as 3091 cm-1 in Table 1 and the text of that work. We note that the value of 3091 cm-1 for this vibration is consistent with the corresponding value for
pDClB, but not with pDBrB, which is more in line with the lower value – our calculated values are
not able to differentiate between these. (As is often the case, the assignment of the high wavenumber
C–H stretch vibrations is fraught with uncertainty.) Also, the authors of Ref. [15] were of the view
that a previous value of 1286 cm-1 for the D25 mode (Mulliken mode 20) was too low, and reassigned
12
The wavenumber of the D12 vibration, which is of au symmetry in the D2h point group and is expected
to be both IR and Raman inactive, comes from a hot band in the two-photon electronic spectrum of
Robey and Schlag [18] as tabulated and discussed in Ref. [15], and is confirmed in the later combined
laser induced fluorescence and dispersed fluorescence study of Knight and Kable [19]. Only one new
S0 wavenumber value comes from that fluorescence study, where a value of 446 cm -1
is obtained for
the D29 mode (Mulliken mode 27) – this had been estimated as 434 cm -1
in Ref. [15]. Additionally, a
slightly refined value of 422 cm-1 is given for the D14 mode in Ref. [19].
2.para-dichlorobenzene
Where available, the experimentally-derived vibrational wavenumbers for pDClB are taken from the
gas phase IR study of Saëki [20], with the remainder from the IR and Raman study of Scherer and
Evans [21] (also tabulated by Green [22]). These largely confirm the earlier assignments of
Stojiljković and Whiffen [23], and we discuss some of the differences. (The reader is alerted to the
fact that Scherer and Evans [21] and Green [22] each used different numberings of the vibrations,
each different to the usual Mulliken ordering, as used by Saëki [20].) Stojiljković and Whiffen [23]
observed a band at 1260 cm-1 in their IR spectrum, which they assigned to a b2u fundamental
vibration, corresponding to D25. This was later reassigned by Scherer and Evans [21] to a combination
band, who then assigned a band observed at 1221 cm-1 to this fundamental vibration. Because band profiles are not always an unambiguous indication of the vibrational symmetry [20] and because of
the good agreement between our calculated vibrational wavenumber for the D25 vibration of 1264
cm-1, and the 1260 cm-1 value of Stojiljković and Whiffen [23], combined with the expected trend of this vibration with mass (see Table 2), we favour the earlier assignment. A possible assignment for the
lower wavenumber 1217 cm-1 band is the D13D14 (815 + 410 = 1225 cm -1
)combination, consistent
with the assignment given to a band observed at 1219 cm-1 in the IR spectrum of Stojiljković and Whiffen [23]. It is noted that Saëki [20] assigned wavenumbers of 1393 cm-1 and 1417 cm-1 to vibrations which we deduce to be D25 and D24, respectively; the lower wavenumber band appears to
be the same IR band observed by Scherer and Evans [21] and Stojiljković and Whiffen [23], which
was assigned to a b2u fundamenetal, which we deduce is D24, in good agreement with our calculated
wavenumber of 1378 cm-1 and the expected mass trend (see Figure 5). As a consequence, the 1417 cm-1 assignment by Saëki to D24 must be incorrect.
We note at this point that the pseudo-Wilson assignments made by Varsányi [5] for pDClB, which
was classified as a para-di(“heavy”) molecule, results in several discrepancies in assignments when one attempts to compare to the vibrational wavenumber of pDFB, which was considered as a para -di(“light”) molecule (see Table 1). Similar discrepancies arose for the monohalobenzenes between
FBz and the heavier chloro-, bromo- and iodo- analogues [7,8]. As a consequence we do not favour
13
3. para-dibromobenzene
The experimentally determined vibrational wavenumbers for pDBrB are summarized in Table 2.
These are taken from the liquid phase IR spectra of Green [22], which are in excellent agreement with
the earlier solution phase IR values of Stojiljković and Whiffen [23], from which remaining
wavenumbers are taken from the solution phase Raman spectra where possible; the exception to this is
the 1290 cm-1 value assigned to D26 taken from Herz et al. [24]. Also, Green [22]suggested a feature
with a wavenumber of 1212 cm-1 be assigned to a fundamental, which corresponds to D25, rather than
the 1251 cm-1 assignment of Stojiljković and Whiffen [23] however, we favour the 1251 cm-1 assignment owing to the excellent agreement with our calculated wavenumber of 1260 cm-1 and the trend in the wavenumber of this vibration with mass (see Table 2). A possible assignment of the 1212
cm-1 feature is to the D13D14 (815 + 402 = 1217 cm -1
) combination, consistent with the assignment of
the feature at ~1220 cm-1 of pDClB[23]. We also note that the value for D17 we employ was estimated
by Green [22] to be 680 cm-1, which is in excellent agreement with the calculated value.
4. para-diiodobenzene
The pDIB molecule is the least investigated of the symmetrical para-disubstituted species. The
majority of the observed fundamental vibrations are taken from the solution phase IR/Raman study of
Stojiljković and Whiffen [23],who also estimated several values based on the trends in wavenumbers
observed for the lighter para-dihalobenzenes, with the value for the D30 vibration taken from the
solution phase IR spectrum of Griffiths and Thompson [25]. The lowest wavenumber vibration of b3u
symmetry, D20 herein,, is assigned to a weak feature observed at 105 cm -1
in the IR spectrum of
Griffiths and Thompson (which shifts to 113 cm-1 upon cooling the sample to -170 °C) [25]. Although the calculated wavenumbers for this vibration are significantly lower than the experimental
wavenumbers for both pDClB and pDBrB, the discrepancy between this value, and the calculated value of 59 cm-1, is notable. The calculated wavenumbers also suggest that this vibration should shift to lower wavenumber moving from para-dibromobenzene to para-diiodobenzene, indicating that this
wavenumber should lie lower than the 103 cm-1 value of the former. Green [22] also notes that this value is higher than expected based on the trends in the wavenumbers assigned to this vibration for
the symmetrical and non-symmetrical para-dihalobenzene molecules. As a result, we believe that the assignment of the 105 cm-1 feature to D20 is incorrect. (A possible assignment of this feature is to the
D29-D30 (255 – 144 = 111) cm -1
difference band.) Finally, as with pDBrB, Green [22] favours a 1212 cm-1 assignment to the b2u vibration (D25 in the present notation) that Stojiljković and Whiffen [23]
assign to a feature observed at 1242 cm-1 in their IR spectrum. Again, we favour the assignment made by Stojiljković and Whiffen [23] based on the good agreement with our calculated wavenumber of
1252 cm-1 and the mass trend of this vibration. Lastly, we note that their estimated values for D14, D17
14
5. p-Xylene
The vibrational wavenumbers for p-xylene are presented in Table 2, which have been taken from the
vapour phase IR/Raman study of Draeger [26]. These values are generally in good agreement with
previously reported values; however, a significant decrease is observed in the vapour phase
wavenumber of 132 cm-1 we assign to D20 compared to the 152 cm -1
value determined from the liquid
IR value [22].The calculated values suggest that D25 has a lower vibrational wavenumber than that of
D26; however, the experimentally derived wavenumbers assigned to these vibrations do not reproduce
this trend, which were made based on the expected activities of these two vibrations under the
assumption that p-xylene has D2h symmetry [22,26]. We also note that Selco and Carrick 27
have
recorded emission spectra of p-xylene following corona discharge with six vibrational wavenumbers reported. They compared their values to the earlier study of Green [22] and reasonable agreement is
seen between those two sets of values and those calculated here, but there are two notable exceptions.
Mode D9, for which Selco and Carrick [27] suggest a higher value of 842.3
cm
-1, in contrast to the
lower value of 830
cm
-1 from Draeger [26]; our calculated value cannot really distinguish betweenthese, but we note that the higher value is close to the expected wavenumber for the D11D29
combination. Also, Selco and Carrick [27] suggest a higher value of 1656.7 cm-1 for the D3 vibration,
but our calculated value supports the lower value of 1616 cm-1 of both Green [22] and Draeger [26].
One possible assignment for the 1656.7 cm-1 band would be to the D9 2
overtone band.
6. Hydroquinone (HQ)
There are not very many studies on the HQ molecule, but IR and Raman spectra in all three phases
have been published. Varsányi [5] has attempted to label the vibrations; we find, however, that when
compared to the calculated values a number of the wavenumbers cannot correspond to fundamentals
and so we went back to both the original references cited therein, as well as more recent work.
Varsányi [5]mainly made use of values in Hidalgo and Otero [28] and Jakobsen and Brewer [29], but
there are other and more recent studies by Wilson [30], Fukushima and Sakurada [31], Kubinyi and
Keresztury [32] and Kubinyi et al. [33] from which we have selected a close-to-complete set of
experimental values that are both consistent with the explicit calculated values, but also fit in with the
expected mass trends. These are given in Table 2 alongside the values for pXyl and the symmetric p -dihalobenzenes. It has been deduced by Kubinyi et al. [33] that the most stable form of HQ is the
trans form, which has C2h symmetry; we thus include these symmetry labels in Table 2. We have
favoured the gas-phase IR results of Wilson [30] where available, then the solution values (in benzene
preferred over the CH3CN ones) of Kubinyi et al. [33], followed by their solid-phase values; we
15
We note that a value of 390 cm-1 has been associated with D29 previously [5,32];however, this would
be in poor agreement with our calculated value. A band was observed at 363 cm-1 (in benzene) and
377 cm-1 (solid), which is strong and Raman active; however, this was assigned as a bg symmetry mode (in the C2h point group for trans-HQ [33]) and so not assignable to D29, which has ag symmetry
in C2h. As a consequence, there is currently no wavenumber available for this vibration except our
calculated value. The D22 wavenumber value may be very similar to the D1 value, as it is for most of
the substituted benzenes, but this is uncertain and so we have left this unassigned at the present time.
7. Mass correlation diagrams
With the assignments discussed above, and presented in Table 2, we can compare trends in vibrational
wavenumbers, as is done in Figure 5. In this figure, we have plotted the artificial isotope (“iso”)
values as lines, and experimental values as symbols. As may be seen, in almost all cases the
agreement between the “iso” values and the actual experimental ones is extremely good; we recall that
the agreement between the explicitly calculated values and experiment was also good (see Table 2). It
is interesting to note that for the cases where there is some discrepancy between the “iso” values and
the experimental ones, these correspond to the cases where the modes have a common dominant Mi
contribution in FBz (see Table 1): M10 for D9 and D10; M20 for D19 and D20; and M30 for D29 and D30,
each of which have dominant C–X motion. These motions are expected to be sensitive to any
electronic structure changes induced by the substituent and thus, it appears that the force field changes
enough from that of pDFB to give rise to vibrational wavenumbers that deviate visibly from the iso calculation, which assumes these are the same.
C. Asymmetrically substituted molecules, pC6H4XY
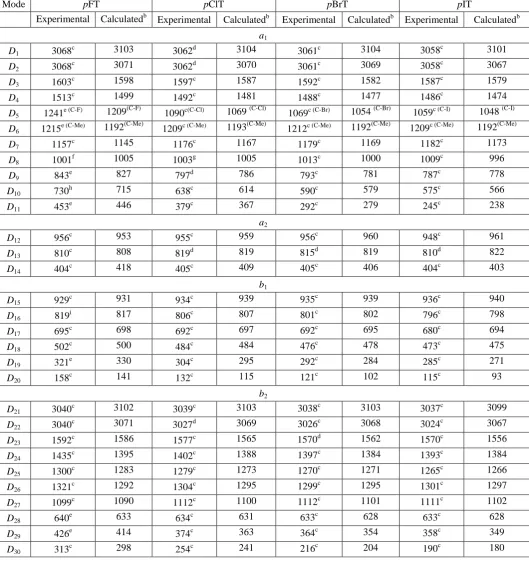
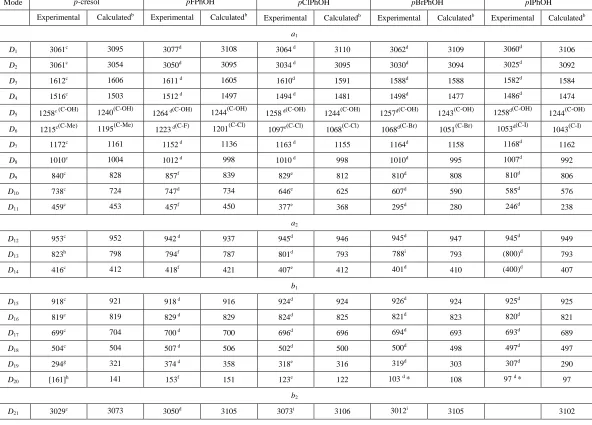
We consider three families of para-asymmetrically-disubstituted benzenes: the asymmetric dihalobenzenes, the halotoluenes and the halophenols. The tabulated experimental and explicitly
calculated vibrational wavenumbers are given in Tables 3, 4 and 5, respectively.
We initially examine the asymmetric cases, pC6H4FX, where we keep one fluorine atom at mass 19,
and vary the mass of the other, obtaining the lines plotted in Figure 7; we see that the variations are
nowhere near as stark as those seen in Figures 1 or 3. (The symbols represent the experimental values
and these will be discussed further below.) Additionally, the corresponding Duschinsky matrices are
shown in Figure 8 and again show a strong diagonal nature. These points confirm that the Di labels
can be used for the asymmetric cases as well as the symmetric ones. In the above we have
16
“explicit” calculated and the experimental vibrational wavenumbers for the asymmetric (pC6H4XY)
para-substituted dihalobenzenes and we shall now discuss the assignment of these. We have named
these according to convention, with the halogens in alphabetical order, and then abbreviated in an
obvious way, so that pBrFB represents para-bromofluorobenzene, for example.
1. (X,Y) = halogen
For pClFB, where possible, the vapour phase IR values of Narasimham et al. [34],are reported in Table 3. Where these are not available, the liquid phase IR values of Green [22] are employed. The
wavenumbers obtained in IR/Raman studies of Patel et al. [35,36] are mostly in excellent agreement
with these two earlier studies, except in the case of the wavenumbers previously assigned to modes
D10 and D27, which were concluded by Patel et al. [36] to originate from an impurity. We take the
value of 639 cm-1,determined from the vapour phase IR spectrum of Narasimham et al., [34]for D10,
which is in good agreement with the value of 630
cm
-1 obtained by Patel et al. [36] and insignificantly better agreement with our calculated wavenumber of 616 cm-1 for this mode than the 680 cm-1 value favoured in the earlier studies [22,34].Based on the consistent wavenumber of 1086 cm-1 we have assigned to mode D27 for both pBrFB and pFIB (vide infra), a very similar value would be
expected for this vibration in pClFB, and we therefore concur with the conclusion of Patel et al. [36]
that the 1126 cm-1 assignment of Green [22]is likely erroneous, but they were not able to identify a new feature corresponding to this vibration. We have been unable to find an alternative wavenumber
for this vibration in the literature and so adopt an estimated value of 1086 cm-1 for this fundamental based upon our calculated values, and the experimental values for the other fluorohalobenzenes (see
Table 3). Finally the wavenumber assigned to D9 is taken from the liquid phase Raman spectrum of
Patel et al. [36].
The wavenumbers for pBrFB, as in the case of pClFB, are taken from the gas phase spectrum of
Narasimham et al. [34] where possible, with the values for D11 and D20 obtained from observed hot
bands in the electronic spectrum of vapour phase pBrFB [37]. The remaining values are taken from
the liquid phase IR study of Green [22]with the exception of the value assigned to D9 which come
from the liquid IR spectrum of Patel et al. [36].
There are no gas phase studies of the heavier asymmetric para-dihalobenzenes. The values shown in Table 3 for pFIB are all taken from Green [22]with the exception of that assigned to D9, which is
taken from the liquid phase Raman spectrum of Narasimham et al. [34]All values for pBrClB are taken from Green [22]except for D29,D28 and D23 where we include the values tabulated in Ref. 38
which are taken from Paulsen [39] and Herz et al.[24] For pClIB, most of the values are taken from Green [22], with the remaining wavenumbers taken from Stojiljković and Whiffen [38], including
17
D28, which is taken from Stojiljković and Whiffen [38], all wavenumbers are those reported by Green
[22].
Occasionally there are vibrations that have not been observed, notably those of a2 symmetry, and D17
for pBrIB – these have been estimated in Ref. [22], and are given here in parentheses in Table 3.
We note that when moving from the symmetric to the asymmetric dihalobenzenes, the D5 and D6
vibrations develop from being in-phase and out-of-phase combinations of the C-X stretch to being
localized C-X and C-Y stretches, which are illustrated in Figure 9. For the symmetric cases, the
in-phase combination is of the higher wavenumber, while for the asymmetric cases we simply order
these in terms of their wavenumber. We note that the D7 vibration, which does not involve any
substantial motion of the substituent atoms, stays at approximately the same value; as a consequence
the ordering of the Di vibrations is not always by wavenumber (see Table 3). Further, we find that
across the series, one can identify the C-F stretches at ~1230–1260 cm-1, the C-Cl stretches at ~1080– 1100 cm-1, the C-Br stretches at ~1060-1080 cm-1 and the C-I stretches at ~1050–1070 cm-1. In different molecules these stretches may have different Di labels, but by construction the one involving the lighter halogen will be D5 and have the highest wavenumber, and that involving the heavier
halogen will be D6, as a result both of the reduced mass effect and also because of the expected bond
strengths. In Figure 9 we show the D5 and D6 vibrations for pFIB , where it can be seen that the modes
are far more like localized C-X stretches. It is also revealing to note the mixings in terms of the Mi
modes in Table 1, where both of the D5 and D6 modes have dominant contributions from the M6
vibration (the C–X stretch in the monohalobenzenes), consistent with their dominant motions.
A similar picture also plays out for the D29 and D30 vibrations. It may be seen from Figure 4 that for
the symmetric pC6H4X2 molecules, these consist of in-phase and out-of-phase in-plane bending
motion. In D30 the motions are in-phase with the two substituent atoms moving one way, while all
other atoms move the other way to compensate. In the case of asymmetric substitution, the motion is
somewhat different and D30 becomes more like a localized in-plane bending mode of the heavier
substituent although its form is still recognizable from the mode diagram in Figure 4. With regards to
D29, for symmetrically-substituted benzenes (Figure 4), the two substituents are moving out of phase,
in opposite directions, so that the other atoms perform a contrarotary motion to compensate. In the
asymmetrically-substituted case this motion becomes much more like a localized in-plane bending
mode of the lighter atom, but again the form is still recognizable from the mode diagram in Figure 4.
Finally, we note that we might have expected the in-phase and out-of-phase in-plane stretches, D9 and
D10 to become more localized versions of each other in the cases of the asymmetric molecules;
however, the modes themselves were not so clear on this point, and some semblance of in- and
out-of-phase character seems to remain, presumably arising from the substantial motion of other atoms
18
wavenumber order and also by reference to the relevant mode diagrams in Figure 4. With regard to
the out-of-plane “wagging” modes, D19 and D20, we see that the former is largely a ring puckering
mode, but this motion is a consequence of the out-of-phase, out-of-plane wagging of the two
substituents; this ring puckering motion remains in the asymmetrically-substituted molecules, but with
a reduced involvement of the heavier atom. The D20 mode can be seen to be an in-phase, out-of-plane
motion of the two substituents and as such, the ring atoms move out-of-plane to compensate for this;
when the substitution becomes asymmetric, the displacement of the heavier atom is reduced, but the
other motions are very similar. As such, both D19 and D20 are straightforwardly identified from the
mode diagrams given in Figure 4.
It may be seen from Table 3 that the agreement between the explicitly calculated and experimental
values is exceptionally good, and also that the few estimated values from Ref. [22] also concur with
the calculated values. Further, in Figure 7, we show the mass trends of the para-halofluorobenzenes together with the experimental data. In these cases we have employed the pDFB force field and
artificially changed the mass of one of the fluorines to match that of the other desired halogen atom.
In general there is remarkably good agreement between the two sets of values, with some deviation
for the lowest wavenumber vibrations, perhaps partially caused by more severe anharmonic effects in
the experimental values than are accounted for by the 0.97 global scaling of the B3LYP/aug-cc-pVTZ
calculated values. Additionally, many of these values will not have been adjusted for interactions with
overtones and combinations, such as via Fermi resonance. Hence, overall, the isotopic values are
sufficient to obtain a reasonable value for any vibration and, further, visualization of the vibrational
normal modes confirms the Di assignments. This is made evident in the Duschinsky matrices given in Figure 8, where largely diagonal behaviour is seen. We have also found that we have not had any
difficulty in assigning a Di label to the vibrations of the other (non-fluoro) asymmetric dihalobenzenes, using this approach, and these data are included in Table 3.
The above comments highlight that we are able to associate a Di label to both symmetrically and asymmetrically-substituted p-dihalobenzenes, where the same label is given to vibrations with the
same motion in each molecule. It is then straightforward to compare vibrations across, as well as
within, families of molecules – we anticipate this will be important when making deductions based
upon vibrational motions, such as in intramolecular vibrational redistribution (IVR) or other
vibrationally-induced photophysical phenomena.
From the mass correlation diagram in Figure 7, we can see that there is again generally excellent
agreement between the “iso” calculated wavenumbers, indicated by the lines, and the experimental
values, indicated by the symbols. The agreement appears to be slightly better than with the
symmetrically-substituted species, but as with the symmetric cases discussed above, it appears that the
19
for the pairs of vibrations D9/D10 and D29/D30, the lower wavenumber partner deviates further from the
“iso” line with increasing mass than the higher wavenumber component, which is localized to the C–F
bond and follows the “iso” line closely; this suggests that the local mode nature of these vibrations is
largely a result of the mass difference between the halogens, rather than evolving electronic effects
arising from the size and electronegativity of the halogen atoms. For the D19/D20 pair of vibrations, a
slight deviation from the “iso” line occurs with increasing mass for D20, with all experimental
wavenumbers lying below the “iso” line for D19, again with a slightly mass dependent deviation
between the “iso” and experimental wavenumber observed.
2. p-halotoluenes
In Table 4 we include selected experimental data for the p-halotoluenes, which we discuss briefly. For
para-fluorotoluene (pFT, with the other molecules abbreviated similarly) we have given the IR results
of the liquid phase spectra from Green [22] in the cases where gas-phase values do not exist; however,
assignments from gas phase studies are favoured when they are available. We take the values for D10
and D16 from the high resolution rovibrational studies of Ghosh [41,42]. We also take the values from
bands observed in emission following vibronic excitation of pFT from coronal discharge from Ha et
al. [43]. Although the vibrational fundamental in the latter (Table 3 of that work) appears to be
correct, the harmonic wavenumbers and anharmonic constants in their Table 2 must be erroneous (the
vibrational spacing is larger than that of the derived harmonic wavenumber). These fundamental
values are also consistent with the hot bands observed in the earlier room temperature electronic
spectrum of Seliskar et al. [44]. We shall highlight any cases where the selection of the wavenumber
value was not straightforward. A value of 1001 cm-1 for D8 is taken from the dispersed fluorescence
study of Okuyama et al. [45] which is in excellent agreement with our calculated wavenumber of
1005 cm-1, but lower than the value of 1017 cm-1 proposed by Green [22].
The wavenumber of 385 cm-1 assigned by Ha et al. [43]to a fundamental we deduce to be D14 was
obtained from combination bands, and is significantly lower than that assigned to the heavier
halotoluenes (vide infra); combined with the agreement across the series between the calculated and
experimental value, we favour the higher wavenumber value of 404 cm-1 assigned to the this vibration from the liquid phase IR study of Green [22]. A value of 288 cm-1 from Ha et al. [43] may be assigned to the D30 vibration, which is in agreement with the value of 287 cm
-1
determined by Okuyama et al.
[45]. However, as Table 4 shows, this value is not in keeping with the trend across the other
halotoluenes, nor with the trend for the calculated value to be consistently 10–15 cm-1 too low. For these reasons, we favour the 313 cm-1 value from Green [22] for this vibration.
Okuyama et al. [45] cite a wavenumber of 180 cm-1, which we assign to the D20 mode, a value that
seems substantially too high; however, from currently unpublished work in our group we believe this
20
aforementioned 288 cm-1 feature. We therefore employ Green’s value of 158 cm-1 [22] for this vibration, which is more in line with the trend for this mode, and with the calculated value. We also
believe that the 1630 cm-1 value [45] for D3 is too high compared to the values for this vibration in the
heavier halotoluenes and it does not fit with the trend for the calculated values that are seen to be
consistently ~ 10 cm-1 below the experimental values. We therefore favour the value of 1603 cm-1 from the liquid phase IR study of Green [22] for this vibration.
The only gas phase studies of pClT in which the vibrations of the S0 electronic state have been
investigated are the dispersed fluorescence experiments of Ichimura et al. [46] and Kojima et al. [47]
in which, for all but one case, the observed wavenumbers were in agreement (within an experimental
uncertainty of ~ ±5 cm-1) with those of the previous liquid phase IR/Raman study of Green [22] with the latter given in Table 4.The exception to this is the 1003 cm-1 band observed in the DF spectra of Kojima et al. [47] which we assign to D8, in excellent agreement with the calculated wavenumber of
this vibration.
There have been no gas phase studies of pBrT, with the vibrational wavenumbers determined in the liquid phase IR/Raman spectra of Green [22], being employed in Table 4. Although there is generally
excellent agreement with the later study of Balfour and Ristic-Petrovic [48], who recorded
liquid-phase Raman and gas-liquid-phase electronic spectra, we note that the value for D10 (Wilson mode ν6a) was
cited as 599 cm-1 by Balfour and Ristic-Petrovic, but is in fact noted as being the IR value of Green (which is given as 590 cm-1 in that work [22]); since also all of the other values match those of Green [22] exactly, this seems to be a transcription error. (Interestingly, however, a 1-0 hot band is assigned
at -601 cm-1 in the electronic spectrum of Balfour and Ristic-Petrovic and assigned to this vibration, along with a Raman band observed at 598 cm-1, so there is some ambiguity here.) A 18 cm-1 discrepancy between the IR and Raman wavenumbers occurs for D23 [22], with the lower
wavenumber IR assignment being favoured based on the trends in the calculated wavenumbers
throughout the para-halotoluene series.
Finally, wavenumbers obtained from the liquid phase IR/Raman study of Green [22] for pITare given
in Table 4, with the IR values favoured in the cases when both are available.
Owing to the mass difference, but particularly in the force constants of the C–X and C–CH3 bonds,
rather than the in-phase and out-of-phase C–X stretches, modes D5 and D6 of the symmetric
dihalobenzene molecules have become localized stretches here (see Figure 9), as was the case for the
asymmetric dihalobenzenes. For consistency the C–X stretch is assigned to D5 and the C–CH3 stretch
is assigned to D6. (Note that for the asymmetric dihalobenzenes, a particular C–X stretch could be
assigned to either D5 or D6.) For pFT, these localized stretches are at a higher wavenumber than D7,
with the C–CH3 stretch having a lower wavenumber than the C–F stretch, contrary to expectations
21
However, a significant decrease in vibrational wavenumber of D5 occurs for pClT, with this vibration
occurring at a lower wavenumber than both D6 and D7, with further, but smaller, lowering of the
wavenumber observed when moving to pBrT and pIT. It is notable that the vibrational wavenumber of D7 remains approximately constant throughout the para-halotoluene series, in line with its motion
not involving the substituent groups lying to lower wavenumber than the C–CH3 stretch which is seen
at ~1205-1215 cm-1.for the halotoluenes.
We also see that the D19 and D20 vibrations have a similar form to that discussed above for the
asymmetric dihalobenzenes, being mainly associated with the C–CH3 and C–X wags, respectively,
although there is still some mixing between these. Finally, the D29 and D30 vibrations become more
localized in-plane bending modes for C–CH3 and C-X respectively, but again with some mixing.
From the mass correlation diagram in Figure 10, we see generally extremely good agreement between
the experimental and “iso” vibrations, but as with the symmetric dihalobenzene cases discussed
above, it appears that the force field changes enough from that of pDFB to lead to vibrations that deviate visibly from the “iso” calculation for the pairs of vibrations D9/D10, D19/D20 and D29/D30,
which assumes these are the same. This is contrary to what was observed for the asymmetrically
substituted dihalobenzenes in which the higher wavenumber mode of each pair was a more localized
C–F motion, which showed little variation in wavenumber with increasing mass of the second halogen
substituent; this can be taken as indicating that although these vibrations are more localized in the
halotoluenes than the readily recognizable in-phase and out-of-phase pairs for the symmetrically
substituted benzenes, the localization of these modes is not complete, even for para-iodotoluene. The wavenumber of D6, the C–CH3 stretch on the other hand remains almost unchanged throughout the
halotoluenes, indicating that this mode is essentially uncoupled from its energetic neighbours.
3. phenols
We shall now discuss the assignments of the vibrations of the p-halophenols, and then extend the
procedure to p-cresol. As with the molecules above, we favour gas-phase values where available and then liquid and solid ones. In cases where a vibrational wavenumber has been obtained from both IR
and Raman, we favour the IR value for consistency in the selection and not based on any reliability
criterion. The selected values are presented in Table 5 and we initially consider the p-halophenols.
For the pXPhOH series (where X is a halogen), we find trends very similar to those noted above for the asymmetric fluorohalobenzenes and the p-halotoluenes. This is not unexpected since the masses of
F, CH3 and OH are very similar. We note that D5 can be associated with the local C–OH stretching
mode, which is almost constant at ~1255–1265 cm-1, while D6 can be associated with the C–X stretch,
which has a value similar to the corresponding vibration in the other molecules, consistent with the