1
Development of a fish leaping framework for low-head barriers
1Parham A. Mirzaei* 2
Architecture and Built Environment Department, The University of Nottingham, Nottingham NG7 2RD, UK
3
Abstract 4
Leaping is an indispensable part of the upstream spawning migration of a fish species. 5
The natural barriers replaced with artificial dams and obstacles can obstruct the leaping process 6
and destruct the life cycle of fish species, causing their extinction in extreme scenarios. To help 7
design and improve the artificial barriers, many studies have been conducted to model the 8
leaping success of fish species. However, generic results were scarcely obtained to be extended 9
for a wide range of barriers. The main reasons can be identified as the lack of thorough 10
understanding of the interaction between fish locomotion and water flow regime upstream of the 11
investigated barriers. Hence, the aim of this study is to propose a leaping framework compatible 12
with a diverse range of fish species and barriers. This framework includes a detailed hydraulic 13
sub-model as well as locomotion model capable of tracing fish in both water and air 14
environments. The functionality of the proposed framework is further discussed using a selected 15
case study. 16
Keywords: Computational fluid dynamics, Fish jumping, Low-head dam, Spillway, Upstream spawning 17
migration 18
1. Introduction 19
Environmental preservation is a challenging issue of the current century to mitigate the past, 20
current, and future interference of human footprints. A recent example of the ongoing damage to 21
the environment is fish species extinction due to the construction of geographical and physical 22
barriers in rivers and waterways (Schlosser and Angermeier, 1995). Human fragmentation has 23
resulted in a wide range of ecological problems such as local species extinction (Wilcox, 1980;
24
* Correspondence: Parham A. Mirzaei, Tel.: 0115 95 14129, Fax: +44(0) 115 951 3159, Email:
2
Wilcox and Murphy, 1985). For example, fragmentation has been recognized as a cause of local 25
extinction of small fishes in Australia (Gehrke et al., 2002). 26
Upstream spawning migration is a part of the life cycle of many fish species, e.g. pacific 27
salmon, smelt, shad, striped bass, and sturgeon (McDowall, 1990). These fish are born in fresh 28
waters, migrate downstream toward sea where they become mature in a period of a few years. 29
Then, they return back to the same stream through a long upstream migration, and spawn in the 30
fresh waters. A part of this upstream migration is jumping through the natural barriers. However, 31
the artificial barriers such as road-crossings, rocks, weirs, and low head dams are common 32
impassable obstacles, cutting the ecological connectivity of fish spawning migration. 33
Removal of the mentioned artificial structures is not always a practical and economical 34
option. Therefore, as potential solutions, fish ladders, fish ways and passageways have been 35
widely designed and constructed to help maintain the ecological life cycle of fish. Many design 36
guidelines and instructions have been developed and implemented (Marmulla, 2001). Despite the 37
positive functionality of the fish passageways, their effectiveness is sometimes questioned as the 38
economical and engineering considerations are more dominant compared to the jumping ability 39
and performance of fish species (McLaughlin et al. 2013; Noonan et al. 2012). 40
Various studies have been conducted to help better the understanding of the jumping ability 41
and performance of different fish species, where the influential parameters are recognized as 42
water flow rate, pool depth, fall height, fish body length, etc. As an early mathematical model, 43
Reiser and Peacock (1985) calculated the maximum attainable height by a fish using the initial 44
burst speed. Powers and Orsborn (1985) defined a more precise model by including further 45
parameters such as maximum burst, fish length, fish frontal area, and estimated drag force. The 46
main limitation of such model can be identified as their simplified hydraulics model. 47
In a more advanced study, Lauritzen et al. (2005) examined the jumping kinematic of wild 48
sockeye salmon in natural waterfalls. They have observed the kinematic of fish jumping and 49
developed a simple mathematical ballistic model based on the trajectory of fish in the air. They 50
3 jumping performance. The influence of environmental factors such as brown bear presence on 52
the jumping success was further considered in this study. In another experimental study 53
conducted in a water tank by Ficke et al. (2011), speed, performance and kinematics of Brassy 54
Minnow fish were investigated for better design of fish ways. Beside the role of fish length, 55
waterfall height, and pool depth, they have emphasised the role of water temperature in 56
endurance jumping of Brassy Minnow. Moreover, the experiment indicated the significance of 57
water velocity on the swimming endurance of studied species. Different regression equations of 58
the probability of jumping success were developed based on the mentioned influential 59
parameters. Furthermore, Salmon jumping was studied through an observational experiment 60
conducted in an adjustable water tank (Lauritzen et al., 2010). The flow speed, pool depth, fall 61
height and fall angels were changed to investigate the jumping success rate. In another laboratory 62
experiment by Kondratieff and Myrick (2006), jumping performance of Brook trout was 63
evaluated. Again, a regression model was developed based on the recognized influential 64
parameters, including pool depth, waterfall height, fish length, trial duration, and fish condition. 65
The impact of fish condition on leaping was assessed based on the fish level of damage in fins, 66
jaw, eyes, and operculum condition. 67
Despite the various studies on understanding the relation between fish jumping success and 68
environmental/physiological parameters, contradictory results were occasionally reported in 69
the development of jumping models (Myrick et al., 2004). This implies that most of these models 70
are restricted to the laboratory and simplified conditions, and barely can be generalized to a 71
wider range of barriers with different physical characteristics. This weakness is inherently due 72
to the simplified details of the utilized hydraulic models on the jumping ability of fish species. 73
While the developed models mainly recognize the importance of barriers and fish characteristics 74
on the jumping success, they barely represent their interconnections with water flow regime. In 75
other words, the poorly modelled water flow regime, affected and formed by barrier geometries 76
such as pool depth and water fall height, significantly impacts the kinematic of a fish species. 77
The fish kinematic is the ability of a fish species to benefit from water flow characteristics 78
4 development of hydraulic models can provide more details about the interaction between a fish 80
and its surrounding environment compared to the traditional regression and observational 81
models. The advantage of such models can be addressed as their capability in resolving the 82
turbulence level and circulation strength of the flow regime. Turbulence is identified as a 83
significant factor in attraction or repelling a fish as it can dominantly decrease or increase the 84
locomotion cost (Enders et al., 2003; Pavlov et al., 1982, 2000; Webb, 1998). The mentioned 85
parameters are mainly neglected in the traditional models, resulting in limited conclusions 86
extracted from these studies. In general, fish kinematic depends on the characteristics of its 87
species in generating locomotion forces (i.e. drag, lift, thrust and buoyancy). 88
Species characteristics of a specific fish itself contain the physiological and behavioural 89
parameters. While physiological parameters of a species (e.g. weight, length, shape) are 90
independent of the flow regime, behavioural parameters are directly impacted by constraints of 91
the flow regime, again justifying the implementation of a detailed flow model. Behavioural 92
parameters include the maximum swimming speed (Reiser et al., 2006), visual ability (Sweka et
93
al., 2001), temperature endurance (Holthe et al. 2005), environmental fear (Carpenter et al.,
94
2009), and learning ability (Odling-Smee and Braithwaite, 2003). It is widely studied that fish use 95
their sensory and locomotion systems to navigate efficiently within the water with changing their 96
swimming kinematics according to the flow regime (Liao, 2007). Liao et al. (2003) showed how 97
fish surf in water and use underwater vortices to minimize their swimming energy. Takagi et al.
98
(2013) showed how Pacific Bluefin Tuna can reduce its locomotion cost through a glide and 99
upward swimming rather than a continuous horizontal one. As another example, reported by 100
Lauritzen et al. (2005),straightening bodies, closing mouth, stretching the fins, and continuous 101
beating of the tail can be respectively justified as minimizing drag and maximizing thrust forces. 102
Hence, the aim of this study is to develop a framework, performing as a roadmap to develop 103
simulation models of the jumping mechanism of various fish species over a variety of barriers. It 104
should be noted again that the goal of this research is to explore the functionality of the proposed 105
framework rather than generating reliable results for a specific fish species, which requires a 106
5 proposed framework can be later used to evaluate the jumping favourability of any low-head 108
barrier and to calculate the total energy budget of a fish species through several jumps required 109
for its spawning migration. The proposed framework consists of flow details as well as 110
physiological and behavioural characteristics of a fish species. Furthermore, it contains a sub-111
model to trace the fish trajectory in the air when it departs the water surface. The functionality of 112
the proposed framework and its sub-models are shown with a selected case study. 113
2. Jumping mechanism 114
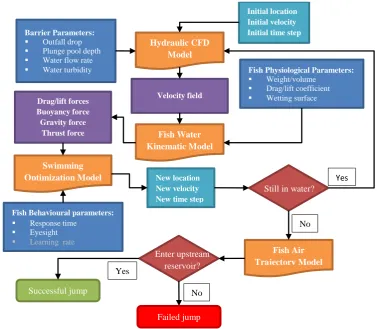
The proposed framework, encompassing the mentioned flow and fish parameters of the 115
jumping, is exhibited in Fig. 1. The framework describes the dynamic interaction between a fish 116
and its environment. After being positioned at the initial point of a jump, a fish tries to benefit 117
from its physiological abilities (i.e. weight, volume, and hydrodynamic) against the water flow 118
regime of a pool to generate an optimum thrust force and swim angle, heading toward the water 119
surface. During the burst process, a fish continuously adjusts its thrust force and swim angle to 120
achieve a successful jump. The latter behavioural ability is unique for each fish species and 121
corresponds to its eyesight, response time, and learning rate. In general, fish optimal solution on 122
a specific situation can result in a failure in jump due to the miscalculation in the jumping process 123
related to its species and also to micro flow complexity associated with the low-head barrier. 124
Therefore, the proposed framework attempts to simulate the jumping process from the fish 125
species point of view. 126
The presented framework in Fig. 1 contains four individual sub-models, forming a holistic 127
jumping model. The model firstly starts with the flow regime, barrier characteristics, and initial 128
condition of the fish as inputs to the first sub-model, the hydraulic CFD model. This sub-model is 129
thus able to predict the flow characteristic for different spillway design and parameters. 130
Evidently, any change in such parameters will change the flow regime that can be again 131
regenerated with the CFD sub-model. The sub-model is assumed to be 2-dimensional and steady-132
state while it is decoupled from the fish water kinematic model. This implies that CFD model only 133
provides the flow characteristic to be inserted as inputs into the fish water kinematic model. 134
6 parameters of the fish species, are transferred to the second sub-model, the fish water kinematic 136
model to calculate the hydrodynamic forces; the fish trajectory is simulated as a particle 137
trajectory. The hydrodynamic forces in addition with the behavioural abilities again serve as 138
inputs to the third sub-model, the swimming optimization model, which calculates the minimal 139
energy-consumption path from fish point of view. Thus, at this point, the fish is able to generate 140
a thrust force and swim with a certain angle to reach the water surface. This dictates that the fish 141
reaches a new location between its decision and response time when the fish again analyses the 142
environment to either maintain or adjust the former swimming pattern. The fish continues the 143
latter process of decision making based on its expected minimal energy consumption until 144
reaching the water surface, where it enters the air with a particular velocity and angle, implying 145
that the fish departs the water and enters the air. This stage is further modelled with a 146
supplementary fish air trajectory model, the forth sub-model, to calculate the failure or success 147
of the fish in reaching the upstream reservoir. At this level, fish slightly can enhance its jump 148
quality with beating of its tail. 149
Figure 1 The proposed jumping framework of a fish species consists of four sub-models: (1) hydraulic 150
CFD, (2) fish water kinematic, (3) swimming optimization, and (4) fish air trajectory models 151
Hydraulic CFD Model
Fish Water Kinematic Model
Fish Air Trajectory Model
Fish Physiological Parameters:
Weight/volume
Drag/lift coefficient
Wetting surface
Barrier Parameters:
Outfall drop
Plunge pool depth
Water flow rate
Water turbidity
Velocity field Drag/lift forces
Buoyancy force Gravity force
Thrust force
Swimming Optimization Model
Initial location Initial velocity Initial time step
Yes
No
No Yes
Still in water?
Enter upstream reservoir?
Successful jump
Failed jump
New location New velocity New time step Fish Behavioural parameters:
Response time
Eyesight
[image:6.595.118.496.416.745.2]7 3. Structure of the sub-models
152
3.1. Hydraulic CFD model 153
The hydraulic model simulates the water flow regime to later be utilized in calculating the 154
propulsion forces of a fish species. As stated before, any alteration in the low-head barrier design 155
as well as the upstream water velocity impacts the flow regime that eventually affect the decision 156
making process of the fish species. To simulate the flow regime, CFD as a widely accepted and 157
powerful method is utilized to model the waterfall downstream of various types of barriers. The 158
time-dependent flow fluctuation can be neglected and the water flow can thus be simulated under 159
the steady state condition. Therefore, the water-air interface is determined by solving the 160
transport equation of volume fraction given as follows: 161
∂
𝜕𝑥𝑗(𝐶𝑖𝑢𝑗) = 0 (1)
162
where 𝐶𝑖 is the fraction of each fluid and 𝑢𝑗 is the velocity in jth direction. The flow of 163
viscous fluid is governed by Navier-Stokes (NS). The Reynolds-averaged approach is used to 164
decompose the Navier-Stokes (NS) equations into mean and fluctuating terms (Mirzaei and rad,
165
2013). Therefore, in Cartesian coordinates, the governing equations can be written as follows: 166
∂
𝜕𝑥𝑖(𝜌𝑢𝑖) = 0 (2)
167
∂
𝜕𝑥𝑗(𝜌𝑢𝑗𝑢𝑖) = −
∂𝑝 𝜕𝑥𝑖+
∂ 𝜕𝑥𝑗[+𝜇 (
∂𝑢𝑖
𝜕𝑥𝑗+
∂𝑢𝑗
𝜕𝑥𝑖) − 𝜌𝑢𝑖
′𝑢 𝑗′
̅̅̅̅̅̅] + 𝜌𝑓𝑖 (3)
168
where the source term, fi, represents the surface tension and gravity force applied on the 169
control volume in the ith direction. In terms of surface tension, the continuum surface force (CSF) 170
model can be used to depict the interaction between water and air: 171
𝐹𝐶𝑆𝐹= 𝜎𝑖𝑗1𝜌𝑘𝑖∇𝐶𝑖 2(𝜌𝑖+𝜌𝑗)
(4) 172
where 𝐶𝑖 is the volume fraction, ki is the curvature of free surface, and ρ is the
volume-173
average density based on the volume fraction. σ is the surface tension coefficient. For the 174
Reynolds stress components, 𝑢𝑖′𝑢 𝑗′
̅̅̅̅̅̅, the Boussinesq hypothesis was employed. Moreover,
175
turbulent kinetic energy and its dissipation rate were introduced to close the RANS equation 176
8 3.2. Fish water kinematic model
178
Although fish trajectory model utilizes the characteristics of the flow as its input, it is 179
inherently decoupled from the CFD model, meaning that the fish species is neglected in the CFD 180
model as it has relatively small impact on the flow regime; inversely, it is highly impacted by water 181
flow regime. Based on Weihs (1973), fish swimming is governed by thrust, drag, lift, buoyancy, 182
and gravity (Fig. 2) as follows: 183
𝑇⃗ = 𝐷⃗⃗ + 𝐿⃗ + 𝐵⃗ + 𝑊⃗⃗⃗ − 𝑚𝑑𝑈⃗⃗
𝑑𝑡 (5)
184
where 𝑇⃗ is the thrust force. 𝐷⃗⃗ and 𝐿⃗ are respectively the drag and lift forces. 𝐵⃗ stands for 185
the buoyancy force and 𝑊⃗⃗⃗ denotes the weight of the fish species. 𝑈⃗⃗ represents the fish absolute 186
velocity, which is the sum of fish swimming velocity and water velocity. Thus, the last term in the 187
right hand side presents the momentum of the fish. The drag force can be obtained with the 188
following equation: 189
𝐷⃗⃗ = −12𝜌𝑆𝐶𝐷|𝑈⃗⃗ 𝑓− 𝑈⃗⃗ 𝑤|2 𝑈⃗⃗ 𝑓
|𝑈⃗⃗ 𝑓| (6)
190
where 𝜌 is the water density and S is the wetting surface area. The 𝑈⃗⃗ 𝑓 and 𝑈⃗⃗ 𝑤 respectively
191
represent the fish swimming velocity and water velocity. 𝐶𝐷 is the drag coefficient and is assumed 192
to be independent from the swimming speed. Similarly, the lift force can be defined as below: 193
𝐿⃗ =12𝜌𝑆𝐶𝐿|𝑈⃗⃗ 𝑓− 𝑈⃗⃗ 𝑤|2 𝑈⃗⃗ |𝑈⃗⃗ 𝑓
𝑓| (7)
194
where 𝐶𝐿 is the lift coefficient and the rotation matrix indicates the direction of the force,
195
which is normal to the fish swimming velocity. Drag and lift coefficients are chosen to be a 196
function of attack angle and total body length, which are extracted from a look-up table created 197
from a study by Takagi et al. (2013). Additionally, the buoyancy and gravity forces can be taken 198
into consideration with the following equations: 199
𝐵⃗ = −𝜌𝑉𝑔 (8)
200
𝑊⃗⃗⃗ = 𝑚𝑔 (9)
9 where 𝑔 the is gravity acceleration, and 𝑉 and 𝑚 denote the volume and mass of the fish 202
species, respectively. Finally, the energy consumption caused by thrust force can be derived by 203
integration of the thrust force along the swimming path: 204
𝐸 = ∫ 𝑇⃗ ∙ 𝑈⃗⃗ 0𝑡 𝑓𝑑𝑡 (10)
205
It should be noted that this energy can only represent the kinetic cost of transport, and 206
[image:9.595.213.390.238.393.2]the actual metabolic energy consumption is neglected in this study. 207
Figure 2 Kinematic of fish locomotion in water 208
3.3. Swimming optimisation model 209
After detecting the barrier, the fish has to respond quickly to avoid the obstacle, so it starts 210
to change its swimming direction and speed. As it is stated in literature, fish follow the optimal 211
solution for its jump in accordance with the information obtained from the surrounding 212
environment. The path alteration of fish, however, cannot occur instantly, meaning that the 213
response lag is inevitable. Therefore, the targeted leaping point is adjusted at each time step in 214
response of the variation in water velocity and fish location. This implies that the fish’s actual 215
moving path will deviate from its preliminary decided path and is thus created in various time 216
steps. 217
Hence, the purpose of swimming optimisation is to simulate fish decision and calculate 218
the optimum thrust force, and minimising kinetic energy required for fish to leap over the barrier 219
in each time step associated with the decision made by fish. It is noteworthy to mention that the 220
decided path by fish occurs in response to its understanding from the flow characteristics and 221
𝑈⃗⃗ 𝑈⃗⃗ 𝑓
𝑈⃗⃗ 𝑤
𝑇⃗ 𝐷⃗⃗
𝐿⃗ 𝛼
𝐵⃗
10 position from the spillway while the learning process is neglected in this study. The swimming 222
optimisation is based on the assumption that fish sense the water flow at a certain distance and 223
will move toward that point as shown in Fig.3. The decision process is defined based on the 224
various angles and velocities that the fish species can select to reach the water surface. However, 225
to minimize the calculation cost of the simulation, only three nodes were generated in each time 226
step where the angle between thrust force and fish swimming velocity was restricted to be less 227
than 30 degrees (Pearson et al. 2005). After a distance swum during its response lag (time step), 228
fish again re-decide to maintain the current path or detour where three new nodes are generated 229
as the possible direction of fish. Therefore, in each time step, expected leaping point and 230
swimming angle and velocity will be adjusted by the fish species. 231
Figure 3 (right) local decided path to impact the water surface (left) simplified 3-nodes path 232
optimization for the fish species 233
The water flow is assumed to be uniform at each time step to ensure a local optimal value 234
for the thrust force. In this study, MATLAB optimisation toolbox was linked with the hydraulic 235
CFD model used to solve the equations 5-9. In the optimisation algorithm, both the linear and 236
non-linear constraints were applied to the calculation. 237
3.4. Fish air trajectory model 238
After departing the water surface, the motion of fish can be described as projectile motion 239
in the air. The equation of this curved motion can be presented as follows (Powers and Orsborn,
240
1985): 241
𝐻𝐿= tan(𝜃𝐿) 𝑋𝐿− 𝑔𝑋𝐿
2
2(𝑉𝐹𝑐𝑜𝑠𝜃𝐿)2 (11)
[image:10.595.77.517.325.433.2]11 where 𝐻𝐿 and 𝑋𝐿 are respectively the vertical and horizontal distances. 𝑉𝐹 denotes the 243
fish speed, and 𝜃𝐿 is the angle of leap (take-off) from the plunge pool. It should be noted that the
244
small thrust force generated by the rapid tail flapping of fish is neglected in this study. 245
4. Case Study 246
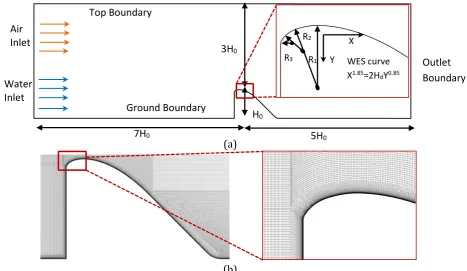
To further investigate the jumping mechanism over a spillway as an artificial barrier, a 247
standard spillway designed by the U.S. Army Corps of Engineers (1990) was selected as the case 248
study (Fig. 4a). The shape of the overflow spillways and the flow pattern is parameterised by 249
three influential parameters, including the design head (Hd), water flow rate (Q), and the slope 250
(k). In this study, the spillway characteristics were respectively selected to be R1 = 0.5Hd, R2 = 251
0.2Hd, and R3 = 0.04Hd. Moreover, the height of the dam, and the design head were respectively 252
selected to be H0 = 5m and Hd = 1m. 253
(a)
(b)
Figure 4 (a) CFD study domain and spillway characteristics (b) utilized grid with boundary layer cells 254
After choosing the case study, the 2D CFD model was validated using a series of 255
measurements by the U.S. Army Corps of Engineers (1990). The assumption of creating a 2D 256
model is fairly valid as the velocity variation is mainly in the flow direction. Several structured 257
grids were generated for the CFD model to ensure the independency of the results from the grid 258
Water Inlet
Air Inlet
Top Boundary
Ground Boundary
Outlet Boundary
7H0 5H0
3H0
H0
R1 R2
R3 WES curve
X1.85=2H dY0.85 Y
[image:11.595.76.544.357.628.2]12 size. It was observed that a mesh with 5.7⨯105 cells will not significantly improve the results. As 259
illustrated in Fig. 4b, this grid was refined near the walls to ensure the wall y-plus is low enough 260
for the enhanced wall treatment method, which guarantees representation of the boundary layer 261
effect in the model (Mirzaei and Haghighat, 2013). Two transitional zones before and after the 262
spillway are patched 5H0 and 7H0 to ensure that the water flow reaches the fully developed
263
[image:12.595.133.462.230.294.2]condition (Mirzaei and Carmeliet, 2013). 264
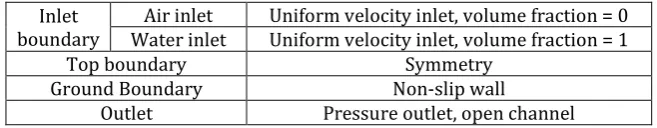
Table 1 Assigned boundary conditions of the hydraulic CFD model 265
Inlet
boundary Water inlet Air inlet Uniform velocity inlet, volume fraction = 0 Uniform velocity inlet, volume fraction = 1
Top boundary Symmetry
Ground Boundary Non-slip wall
Outlet Pressure outlet, open channel
Boundary conditions assigned to each surface of Fig. 4 are summarized in Table 1 (Mirzaei
266
and Haghighat, 2011). A separate velocity inlet boundary condition for the air and water was 267
assigned to the upstream boundary. The volume flow rate for the water inlet was changed 268
between 1m3/s and 12m3/s. The material properties of both water and air were assumed to be 269
constant at 20ᵒC. For the downstream boundary, the open channel model was utilized. The 270
pressure-velocity coupling was achieved by SIMPLE algorithms. The PRESTO scheme was also 271
used for the pressure interpolation. For steady-state calculations, the implicit scheme was used 272
for the volume fraction equation. The momentum, volume fraction, and turbulent kinetic 273
equations were discretised by the second-order upwind scheme while the turbulent intensity was 274
assumed to be 10% 275
4.1. CFD validation 276
As depicted in Fig. 5, the performance of the developed CFD model is evaluated by 277
comparing the dimensionless static water head with the measured data by the U.S. Army Corps
278
of Engineers, 1990. The result shows a close relation between the simulation and experimental 279
results. Therefore, the verified grid and setup in this section will be used later as a basis for 280
13 Figure 5 Static water head comparison between the measured data by the U.S. Army Corps of Engineers,
282
1990 and the developed CFD model 283
4.2. Utilized parameters 284
The fish jumping was determined by a number of physiological and behavioural 285
parameters that vary with different species. Therefore, the framework should be initially 286
calibrated by assigning the related parameters, e.g. starting location, buoyancy, drag and lift 287
coefficients. The studied fish species is Salmon in this study as it is the most investigated species 288
in back migration (Roscoe and Hinch, 2010). The weight and length of the selected Salmon were 289
respectively considered to be 2kg and 0.29m. The utilized drag and lift coefficients for the fish 290
water kinematic model were obtained from a study by Takagi et al. (2013). These coefficients 291
were defined to be a function of tail beating frequency, attack angle, and total body length. 292
Moreover, the behavioural parameters were identified based on the previous studies in the 293
[image:13.595.132.465.57.221.2]literature and are presented in Table 2. 294
Table 2 Fish behavioural parameters adopted in swimming optimization model 295
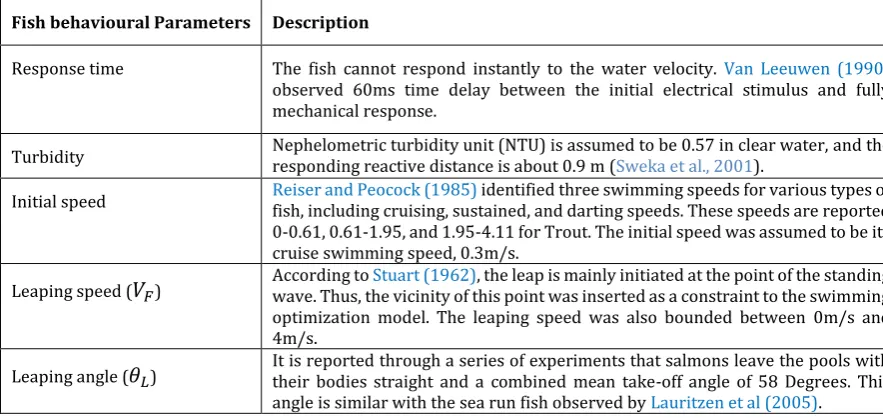
Fish behavioural Parameters Description
Response time The fish cannot respond instantly to the water velocity. Van Leeuwen (1990)
observed 60ms time delay between the initial electrical stimulus and fully mechanical response.
Turbidity Nephelometric turbidity unit (NTU) is assumed to be 0.57 in clear water, and the responding reactive distance is about 0.9 m (Sweka et al., 2001). Initial speed Reiser and Peocock (1985)fish, including cruising, sustained, and darting speeds. These speeds are reported identified three swimming speeds for various types of 0-0.61, 0.61-1.95, and 1.95-4.11 for Trout. The initial speed was assumed to be its cruise swimming speed, 0.3m/s.
Leaping speed (𝑉𝐹) According to wave. Thus, the vicinity of this point was inserted as a constraint to the swimming Stuart (1962), the leap is mainly initiated at the point of the standing optimization model. The leaping speed was also bounded between 0m/s and 4m/s.
Leaping angle (𝜃𝐿) It is reported through a series of experiments that salmons leave the pools with their bodies straight and a combined mean take-off angle of 58 Degrees. This angle is similar with the sea run fish observed by Lauritzen et al (2005).
-0.2 -0.1 0 0.1 0.2 0.3 0.4 0.5
-1 -0.5 0 0.5 1
y/H
d
x/H
d [image:13.595.72.514.566.775.2]14 5. Results and discussion on the functionality of the leaping framework
296
5.1. Circulation importance 297
To investigate the threshold of the hydraulic jump and formation of the back circulation 298
in front of the case study spillway, the flow rate was changed between 0.5m3/s and 6m3/s. This
299
jump can be controlled based on the selection of a related dimensionless number, the Froude 300
number (Fr). As illustrated in Fig. 6, a large back circulation was formed about a few meters after 301
the crest where the hydraulic jump occurs. One of the main intentions of designing spillways is to 302
avoid an intense back circulation right after the crest as this vortex, known as the drowning 303
machine, caused thousands of casualties in the past years (Zamankhan, 2012). On the other hand, 304
the current design of the spillway directs the flow with a high velocity slipping from the crest to 305
the downstream, creating a high speed velocity region (Fig. 6). This region is an energy costly 306
path for fish species to cross the barrier with either jumping or swimming. In both scenarios, fish 307
consume a considerably high amount of energy to generate the required hydrodynamic forces to 308
reach the upstream reservoir. Another feasible option to pass the barrier can be jumping over the 309
back circulation of the hydraulic jump shown in Fig 6. However, the far distance of this circulation 310
from the upstream reservoir is normally beyond the jumping ability of fish species, implying that 311
[image:14.595.127.469.502.668.2]they need to swim toward the high speed region. 312
Figure 6 Back circulation and high velocity region in the studied spillway 313
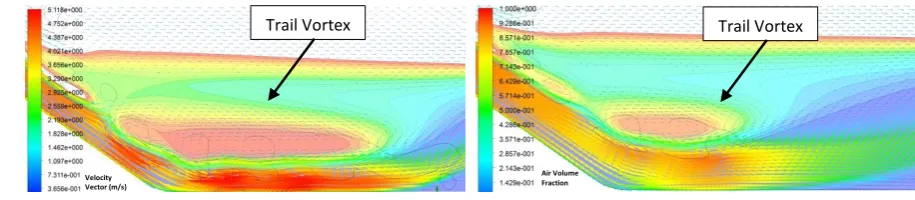
As depicted in Fig. 7, it was observed that a small vortex in the vicinity of the spillway trail 314
tends to appear in velocities lower than 5m3/s, leaving this region as an alternative to the high
315
velocity region for the fish species to cross the spillway. Evidently, the size and strength of this 316
High velocity region
15 vortex increases in the lower velocities. This means that the fish can benefit from this trail vortex 317
where the upstream flow rate is low enough. On the contrary, the water level elevates in the 318
higher flow rates, which may open a new option for fish species to benefit a better jump when 319
they depart the water surface. As it was mentioned earlier, the aim of the framework is to consider 320
[image:15.595.65.523.189.289.2]the complex and dynamic regime of a water flow regime in the jumping of fish species. 321
Figure 7 Impact of the air flow rate on the formation of the small vortex (left) Q=2m3/s (right)
322
Q=3m3/s
323
5.2. Barrier shape 324
The shape of a barrier significantly impacts the flow regime. In particular, the pool depth 325
and waterfall heights could influence fish jumping when considering both characteristics 326
simultaneously. As shown in Fig. 8a, a strong back circulation can be observed when the barrier 327
has a different shape from a standard spillway as introduced before. Here, the fall height and pool 328
depth are the key elements in characteristics (i.e. shape and strength) of this back circulation, 329
impacting the jumping quality of the fish species. 330
To investigate the influence of the barrier shape on the jumping quality, a case study 331
similar to an experiment by Lauritzen et al., (2010) is simulated with the CFD model. In this case, 332
therefore, the fall height and the pool depth to fall height (D/H) are respectively selected to be 333
0.36 m and D/H = 0.6. Using the CFD model of Lauritzen et al., (2010) experiment shows that the 334
preferred pool depth for jumping slightly increases with an increase in the fall height, but the 335
preferred ratio of the pool depth to fall height decreases with an increase in the fall height. Adding 336
a small ramp to the latter case scenario, it can be clearly seen in Fig. 8b that the existence of a 337
small ramp can change the shape and strength of the vortex as well as the elevation of the water 338
flow. Therefore, it can be again concluded that the pool and barrier parameters noticeably 339
Trail Vortex
Velocity Vector (m/s)
Trail Vortex
16 influence the complex flow of the stream, resulting in different hydrodynamic forces required to 340
[image:16.595.66.524.114.240.2]be generated by fish species. 341
Figure 8 Impact of ramp on water flow regime (left) without ramp (right) with ramp 342
As it was explained by Fig. 1, the details of the water flow, which are unique for each 343
barrier, will be obtained at this stage and will be transferred to the fish water kinematic model to 344
calculate the hydrodynamic forces at any location of the pool. 345
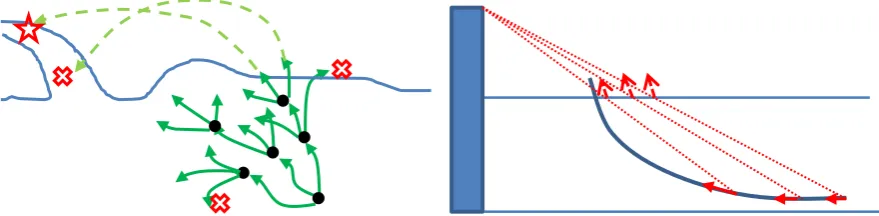
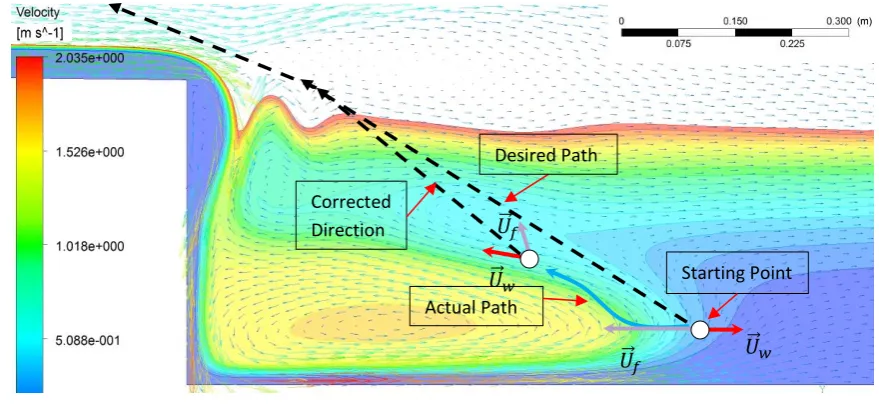
Figure 9 Desired and actual paths of the fish 346
5.3. Path optimization 347
The next step of the proposed framework is to simulate the jumping optimal solution from 348
the fish species point of view when the hydrodynamic forces are calculated from the previous 349
steps. To minimize the swimming energy and ensure a successful jump, a fish can initially control 350
its swimming velocity and angle. Before detecting the obstacle (low-head dam’s wall), the fish 351
continuously moves at cruise speed in the horizontal direction. When the obstacle is detected in 352
accordance with the turbidity number (Table 2), it decides to initiate the jumping process (Fig.
353
Ramp
𝑈⃗⃗ 𝑓
Actual Path
𝑈⃗⃗ 𝑓 𝑈⃗⃗ 𝑤
Desired Path
Corrected Direction
[image:16.595.76.516.361.565.2]17
3). It is noteworthy to mention that the selection of initial point of jumping significantly impact 354
the optimization result. In this study, the ending of the horizontal cruse is used as the starting 355
point for the optimization calculation (Fig. 9). Therefore, this point is located where the fish 356
deviates from its previous straight line. Fish determine their desired path by visual stimulus, 357
meaning that it constantly revises its path and velocity toward the water surface. 358
As it is shown in Fig. 9, the fish deviates from its desired path due to the sudden decrease 359
in drag force due to the time lag, while the propulsion force is still fixed. This indicates that the 360
total force applied on the fish cannot lead it to the desired path, but towards the direction of water 361
velocity, sketching an actual path for the fish. This continuous adjustment process is calculated in 362
the swimming optimization model. The locomotion is moreover assumed to be accomplished in 363
several time steps in respect to the response time of a fish species. This means that a fish can 364
modify the current path after each response time. Thus, in each node, the model simulates the 365
largest exerted thrust force by the fish to accelerate itself for a successful jump over the spillway 366
as depicted in Fig. 3. Then the algorithm investigates the possible scenarios of the current node. 367
This includes whether the fish (1) hits the wall (Fig. 10a), implying an unsuccessful attempt, (2) 368
swims backward when the water velocity is too large to be dominated, (3) departs the water 369
surface where the swimming optimization model will transfer the direction, speed, and location 370
of the fish to the Air Trajectory Model in order to evaluate the quality of the jump (Fig. 10b and 371
c), or (4) relocate to a new point toward the barrier, meaning the generation of three new nodes 372
(Fig. 3). Eventually, all the nodes will be generated toward the top surface boundary where the 373
calculation will stop. The selection of three new nodes is due to reducing the computational time 374
of the optimization algorithm where the angle between thrust force and fish swimming velocity 375
is assumed to be less than 30 degrees (Pearson et al. 2005). 376
The fish control strategy is affected by a variety of factors, including age, sex, temperature, 377
burst speed, starting location of the jump and turbulence. Hence, it is assumed that the fish is able 378
to relocate between nodes by reduction and elevation of the thrust force. Utilizing this concept, 379
18 have a control on its jumping path. The scenario in which fish cannot exert a force above the 381
critical thrust is then assumed as a failed jump attempt. 382
(a)
(b)
[image:18.595.139.460.113.582.2](C)
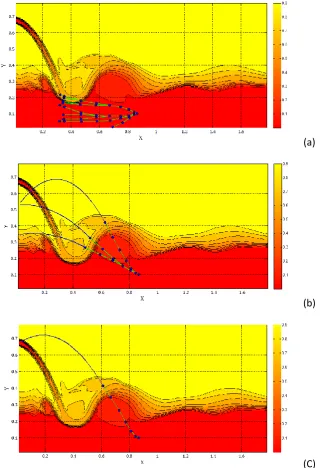
Figure 10 Example of the possible scenarios for a specific barrier and water flow (a) incomplete jumps 383
(b) jump failures (c) a successful jump 384
These scenarios are illustrated in Fig. 10 associated with the defined case study in the
385
previous section (H=0.36 m). Some of the paths in which the fish is tapped under the water fall 386
due to its miscalculation on the direction and thrust generation are shown in Fig. 10a. Similarly, 387
Fig. 10b demonstrates the paths in which the fish reaches the water surface, but without a suitable 388
19 jumping attempts is shown in Fig. 10c where the fish generated enough thrust forces and chose 390
suitable directions on each node toward the water surface. 391
As discussed earlier, the application of the purposed framework is to provide practical 392
solution in the modification of low-head barriers in order to elevate the leaping probability of fish 393
species. For example, in the above case study, the probability of the leaping should be initially 394
calculated according to the various leaping scenarios as explained in the previous sections – this 395
value is below acceptable range with various assumed inputs to the framework related to the fish 396
species and its behaviour. The obtained probability thus empower the decision makers to apply 397
a variety of strategies to change or retrofit the barrier, e.g. alteration of the outfall drop, plunge 398
pool depth, water flow rate, etc. 399
Conclusion 400
A fish leaping framework, including hydraulic CFD, fish water kinematic, swimming 401
optimization, and fish air trajectory models, is proposed in this study. The proposed framework 402
is initially validated with physical characteristics of a barrier and calibrated with behavioural and 403
physiological parameters of a fish species. The capability of the developed model in calculating 404
the leaping success rate of the fish is then shown with a case study. The results clearly show that 405
the framework is capable of the calculation of the favourability of a specific barrier. 406
As a future study, the developed framework can be improved by including the learning 407
process of the fish species. Moreover, the framework can be utilized to calculate the total energy 408
required for a complete upstream spawning migration of a fish species. Furthermore, more 409
research can be conducted for better understanding of the behavioural parameters that 410
contribute to the leaping process of a fish species. 411
Acknowledgment 412
The author would like to extent his gratitude to Mr. Hanxiao Cui, Mr. Mou Chen and Mr. 413
Michael Trojan for their help through this study. 414
References 415
Carpenter, R. E., Summers, C. H. (2009) Learning strategies during fear conditioning. Neurobiology 416
20 Enders, E. C., Boisclair, D., Roy, A. G. (2003). The effect of turbulence on the cost of swimming for 418
juvenile Atlantic salmon (Salmo salar). Canadian Journal of Fisheries and Aquatic Sciences. 60, 1149–1160. 419
Ficke, A. D., Myrick, C. A., Jud, N. (2011) The Swimming and Jumping Ability of Three Small Great 420
Plains Fishes: Implications for Fishway Design. Transactions of the American Fisheries Society, 140:6, 421
1521-1531. 422
Gehrke, P. C., Gilligan, D. M., Barwick, M. (2002) Changes in fish communities of the Shoalhaven 423
River 20 years after construction of Tallowa Dam, Australia. River Research and Applications 18:265–286. 424
Holthe, E., Lund, E., Finstad, B., Thorstad, E. B., McKinley, R. S. (2005) A fish selective obstacle to 425
prevent dispersion of an unwanted fish species, based on leaping capabilities. Fisheries Management and 426
Ecology. 12 143–7. 427
Kondratieff, M. C., Myrick, C. A. (2006) How High Can Brook Trout Jump? A Laboratory Evaluation 428
of Brook Trout Jumping Performance. Transactions of the American Fisheries Society. 135:361–370. 429
Lauritzen, D. V., Hertel, F., Gordon, M. S. (2005) A kinematic examination of wild sockeye salmon 430
jumping up natural waterfalls. Journal of Fish Biology. 67 1010–20. 431
Lauritzen, D. V., Hertel, F. S., Jordan, L. K., Gordon, M. S. (2010) Salmon jumping: behaviour, 432
kinematics and optimal conditions, with possible implications for fish passageway design. Bioinspiration & 433
Biomimetics. 5(3):035006. 434
Liao, J. C. (2007) A review of fish swimming mechanics and behaviour in altered flows. 435
Philosophical Transactions of the Royal Society B. 362, 1973-1993. 436
Liao, J. C., Beal, D. N., Lauder, G. V., Triantafyllow, M. S. (2003) Fish Exploiting Vortices Decrease 437
Muscle Activity. Science. 302, 1566. 438
McDowall, R.M. (1990) New Zealand Freshwater Fishes: A Natural History and Guide. Heinemann 439
Reed, Auckland. 440
Marmulla, G. (ed.). (2001) Dams, fish and fisheries. Opportunities, challenges and conflict 441
resolution. FAO Fisheries Technical Paper. No. 419. Rome, FAO. 166p. 442
McLaughlin, R. L., Smyth, E. R. B., Castro-Santos, T., Jones, M. L., Koops, M. A., Pratt, T. C., Ve´lez-443
Espino, L.A. (2013) Unintended consequences and trade-offs of fish passage. Fish and Fisheries, 14, 580– 444
604. 445
Mirzaei, P.A., Haghighat, F. (2011) Pollution removal effectiveness of the pedestrian ventilation 446
system. Journal of Wind Engineering & Industrial Aerodynamics, Journal of Wind Engineering and 447
Industrial Aerodynamics, 99: 46–58. 448
Mirzaei, P.A., Carmeliet, J., (2013) Dynamical Computational Fluid Dynamics Modeling of the 449
Stochastic Wind for Application of Urban Studies. Building and Environment, 70:161-170. 450
Mirzaei, P.A., Rad, M. (2013) Toward design and fabrication of wind-driven vehicles: procedure to 451
optimize the threshold of driving forces, Applied Mathematical Modelling, 37: 50–61. 452
Myrick, C., Kondratieff, M. (2004) An Evaluation of a Potential Barrier to the Upstream Movement 453
of Brook Trout in Rocky Mountain National Park, Colorado. 454
Noonan, M. J., Grant, J. W. A., Christopher D. J. (2012) A quantitative assessment of fish passage 455
efficiency. Fish and Fisheries, 13, 450–464. 456
Odling-Smee, L., Braithwaite, V.A. (2003) The role of learning in fish orientation. Fish and Fisheries, 457
4, 235-246. 458
Powers, P. D., Orsborn, J. F. (1985) Analysis of barriers to upstream fish migration. Albrock 459
Hydraulics Laboratory, Contract DE-A179-82BP36523, Project 82–14, Pullman, Washington. 460
Pavlov, D. S., Lupandin, A. I., Skorobogatov, M. A. (2000) The effects of flow turbulence on the 461
behavior and distribution of fish. Journal of Ichthyol. 40, S232–S261. 462
Pavlov, D. S., Skorobogatov, M. A., Shtaf, L. G. (1982) The critical current velocity of fish and the 463
degree of flow turbulence. Rep. USSR Academy of Science. 267, 1019–1021. 464
Pearson, W. H., Mueller, R. P., Sargeant, S. L., May, C. W. (2005) Evaluation of Juvenile Salmon 465
Leaping Ability and Behavior at an Experimental Culvert Test Bed. Prepared for: Washington State 466
21 Reiser, D. W., Peacock, R. (1985) A technique for assessing upstream fish passage problems at 468
small-scale hydropower developments. Pages 423–432 in F. Olson, R. White, and R. Hamre, editors. 469
Proceedings of the symposium on small hydropower and fisheries. American Fisheries Society, Bethesda, 470
Maryland. 471
Reiser, D. W., Huang, C.M., Beck, S., Gagner, M., Jeanes, E. (2006) Defining Flow Windows for 472
Upstream Passage of Adult Anadromous Salmonids at Cascades and Falls. Transactions of the American 473
Fisheries Society 135: 668-679. 474
Roscoe, D. W., Hinch, S. G., (2010) Effectiveness monitoring of fish passage facilities: historical 475
trends, geographic patterns and future directions. Fish and Fisheries, 11, 12–33. 476
Schlosser, I. J., Angermeier, P. L. (1995) Spatial variation in demographic processes of lotic fishes: 477
conceptual models, empirical evidence, and implications for conservation. American Fisheries Society. 478
392–401. 479
Sweka, J. A., Hartman, K. J. (2001) Influence of Turbidity on Brook Trout Reactive Distance and 480
Foraging Success. Transactions of the American Fisheries Society 130: 138-146. 481
Takagi, T., Tamura, Y., Weihs, D. (2013) Hydrodynamics and energy-saving swimming techniques 482
of Pacific Bluefin tuna. Journal of Theoretical Biology 336, 158-172. 483
U.S. Army Corps of Engineers, (1990) Hydraulic Design of Spillways. 484
Wilcox, B. A. (1980) Insular ecology and conservation. Pages 95-118 in M. E. Soulé and B. A. Wilcox, 485
eds. Conservation biology: an evolutionary-ecological perspective. Sinauer, Sunderland, MA. 486
Wilcox, B. A., Murphy, D. D. (1985) Conservation strategy: the effects of fragmentation on 487
extinction. American Naturalist 125:879-887. 488
Webb, P. W. (1998) Entrainment by river chub Nocomis micropogon and smallmouth bass 489
Micropterus dolomieu on cylinders. Journal of Experimental Biology. 201, 2403–2412. 490
Weihs, D. (1973) Energetic Advantages of Burst Swimming of Fish. Journal of Theoretical Biology 491
48:215-229. 492
Van Leeuwen, J. L., Lankheet, M. J. M., Akster, H. A., Osse, J. W. M. (1990) Function of red axial 493
muscles of carp (Cyprinus carpio): recruitment and normalized power output during swimming in different 494
modes. Journal of Zoology 220, 123-145. 495
Zamankhan, P. (2012) Rollers in low-head dams – Challenges and solutions. Communications in 496