Examining the relationship between the ability to shift visuospatial attention and visual awareness using lateralized power spectra
Johanna Rippe, s1125222 University of Twente, January 2016
2 Summary
A measure derived from EEG was used to study the largely unknown relationship between visuospatial attention and visual awareness. The aim of the current research was to examine whether individual differences in visual awareness thresholds could be predicted by different capacities in the covert shift visuospatial attention. Also we proposed that the allocation of visual attention would have an induced rather than an evoked nature. A combination between an
endogenous attention orienting paradigm and backward masking was used with LPS applied on raw EEG as measure. The results indicate that there are individual differences in visual awareness and that those differences are related to the ability to allocate visuospatial attention. Furthermore the results indicate an induced nature of endogenous, covert shifts of attention.
Samenvatting
Een maat afgeleid van het EEG werd gebruikt om de grotendeels onbekend relatie tussen visuele-spatiele aandacht en visueel bewustzijn te bestuderen. De doelstelling van het huidige onderzoek was het om te onderzoeken of individuele verschillen in een waarneming drempel van visuele aandacht voorspeld kunnen worden door verschillen in de vaardigheid van het heimelijke richten van visuele aandacht. Er wordt verder verondersteld dat het richten van aandacht meer van innerlijke geinduceerd dan van externe stimuli opgeroepen natuur zou zijn.
3 Introduction
Fundamental to the study of experience of the visual world, is the assumption that they are selective, that there is a richness of content that goes beyond what we can perceive. Part of this selective experience are attention and awareness, two closely related psychological concepts, that are often conflated. We begin by describing what is understood by the terms attention and awareness in this report. Then we will present some arguments concerning the relationship between attention and awareness, who taken together, might provide an explanation how attention and awareness could be defined as separate processes, but yet be closely related.
Attention gives us the ability to select and process relevant information from numerous sensory inputs (Posner & Petersen, 1989). Here, we will focus on the special case of endogenous, covert orienting of visuospatial attention. In other words, the focus lies on the situation, where attention is voluntarily shifted to a location in the visual field, without moving the eyes.
Awareness in this context is related to conscious perception. The focus lies on visual awareness, which is subjective sensation of seeing something (Searle, 1992, Block, 1995).
In everyday life, attention and awareness appear to be bound together. When we pay attention to an object, we become aware of its various attributes and when we shift our attention away, we stop being aware of the object (Tsuchiya, 2005).
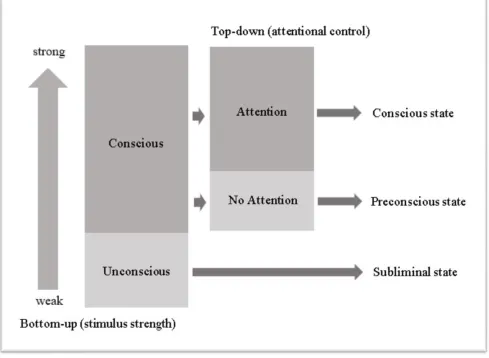
There are many different concepts about the relationship between attention and awareness, but in this report we have chosen for theoretical concepts of Lamme (2004) and Dehaene (2006) who argue, that attention is necessary, but not sufficient for visual awareness. Lamme (2004) proposes that whether or not a stimulus reaches awareness does not only depend on attention selection processes, but also on the properties of the visual stimulus. According to Lamme, the sensory input needs to be salient enough to cause spreaded neuronal activation and recurrent processing in order to reach a conscious state.Attention increases the efficiency of processing and the information is stored in a stable and reportable manner. Dehaene et al. (2006) suggests that whether or not we become conscious of a stimulus, depends on the strength of top-down attention and bottom up properties of the sensory input. He distinguishes between
4 brain areas and becomes capable of guiding intentional actions including verbal reports. The theoretical concepts of Lamme (2004) and Dehaene et al.(2006) concerning the relationship between attention and awareness seem to be complementary, rather than in competition with each other. Which is why we propose a conflated model of attention and awareness (Appendix E, Figure 8).
In the following, some measures with the help of which the allocation of visuospatial attention and visual awareness can be examined, are presented. A paradigm which has often been used to examine visuospatial attention is the Posner cueing paradigm (1980) (Eckstein, Shimozak & Abbey, 2002). An endogenous cue, predicts the likely locus of a lateral to-be-detected target. The likelihood that the location of the target stimulus was correctly indicated (cue validity) was changed in the task. The participant has to focus attention to that location, while the eyes remain fixated to a point and discriminate different target stimuli. The reaction times and the accuracy of the responses is used as index for individual differences in the ability to voluntarily and covertly shift the attention. According to Fu et al. (2001) such endogenous attention orienting tasks allow us to assess the extent to which voluntary allocation of attention, differentially modulates activity in cortical areas in preparation for the processing of an expected stimulus. An endogenous
attention paradigm can be thus be used as index for the allocation of visual attention. As our interest lies on the relationship between visual attention and visual awareness it appears to be advisable to combine the endogenous attention paradigm with another paradigm that tabs into visual awareness. One could combine the endogenous attention paradigm with a backward masking paradigm, which has been used in earlier studies to manipulate visual awareness (Breitmeyer, 2014).
5 oscillations. It has been reported that an increase in the alpha power band lateralization in this time interval is related to the allocation of visual attention. Second, SOA was used to describe the time interval between the onset of the target stimulus and the onset of the masking stimulus (SOA-2). SOA-2 , the time time interval between the onset target stimulus and mask stimulus has been varied across trials to manipulate the visibility of the target stimulus with backward
masking.
By combining a version of the endogenous attention orienting paradigm and backward masking with EEG measurements, important insights could be gained about the relationship between attention and awareness, at both behavioral and neurological level. According to van der Lubbe and Utzerath (2013), the use of lateralized power spectra (LPS) might be advantageous to study the underlying mechanisms of visuospatial attention allocation. Lateralized power spectra is a measure derived from wavelet analyses, that can be applied to the raw EEG data (LPS) or the individual event-related potentials (LPS-ERP) of the EEG signal (van der Lubbe et al.,
2013).When focusing on individual differences in the allocation of attention, LPS applied on the raw EEG might be advantageous compared to LPS-ERP due to several reasons. Herman,
Grigutsch and Busch (2005), made a distinction between evoked oscillations on EEG trials that are time-locked to specific events like stimulus onset and induced oscillations that are produced by internal processes. LPS-ERP suffers from the same problem as ERP do, they do not take dynamical changes in the brain's intrinsic activity into account. LPS applied on raw EEG could be more a more sensitive measure for individual differences in the allocation of attention, because one can measure induced changes in frequency, which are not time-locked. With LPS one can study both induced and evoked effects and with LPS-ERP only evoked effects. In his article van der Lubbe (2013) still found a lot of similarities between the two measures , but stated that the differences might manifest themselves more clearly when using higher frequencies (like α, β) and
longer cue-target intervals in future studies. Furthermore, the fact that not time-locked data is taken into account and not thrown away adds a lot more data (could make up to 30-40% of the EEG data) to analyse and thus more effects to find. As stated by Buszáki (2006) who said that it would be a shame not to look into not time locked data.
6 To our knowledge, only one research has been done focusing on individual differences in the ability to allocate attention or individual differences in visual awareness.
Using an adapted version of the posner cueing paradigm, Aldiek (2015) found differences in reaction times between validly and invalidly cued trials. Also the number of correct responses increased to the degree the length of the SOA increased. She reported indications that individual differences in the performance in the endogenous attention paradigm might be related to the efficiency of allocation of attention.The current study relies on the study of Aldiek (2015), by combining an endogenous attention orienting paradigm with backward masking. In contrast to Aldiek, we will focus mainly on the relationship between visuospatial attention and visual awareness and individual differences in their measures. By keeping the spatial certainty constant at 100% valid cue trials and varying the SOA on a broader scope than Aldiek did, the visibility of the target should be purely attributable to differences in visual awareness thresholds. The
lateralized power spectra of the raw EEG will be used as index for the allocation of visuospatial attention. One can measure various frequency bands with LPS, but we will restrict our analysis to alpha frequency band, because earlier studies point out the importance of alpha band oscillations in processes related to attention and awareness (Sauseng, 2005, Thut et al., 2006, Rihs, 2007, Klimesch, 2012, Aldiek, 2015). The visibility thresholds of target-stimuli, will be manipulated using backward masking, the resulting individual SOA values will be used as index for visual awareness thresholds.
In the following section we will focus on possible benefits that could be derived from the study. The results of the study could have important implications for studies focusing on
diagnosing impairments in the ability to shift visual attention and studies focusing on individual differences in visual awareness. If the results show that induced effects could be shown using LPS applied on raw EEG, but using other EEG measures, this would validate LPS as sensitive index for the ability to allocate attention. For example, LPS could be used as independent index to examine and compare the efficiency of different training methods to improve the ability to shift attention , for healthy people as well as for people with attention disorders.
7 attributable to the stimuli itself. Based on the results of Mathewson, we suppose that these
differences in visibility were caused by differences in visual awareness. To our knowledge there is not much research done on individual differences in visual awareness. To measure these individual differences we use an adapted version of the endogenous attention paradigm together with backward masking. With regard to the allocation of attention, LPS seems to be a valid index for the allocation of attention (van der Lubbe, 2013, Kroes, 2015, Aldiek, 2016). We expect the LPS to correlate with individual visual awareness thresholds in the endogenous attention paradigm with backward masking. We expect that participants with a good capacity for the allocation of attention would have lower thresholds for visual awareness, as the allocation of attention gives them a perceptual advantage.
Furthermore we were interested whether endogenous, covert shift of attention is of induced or evoked nature. We expect, based on the results of earlier studies that the process is of induced rather than evoked nature (van der Lubbe, 2013, Kroes, 2015). What would support the view that the process is of induced nature would be, if we could replicate the results from earlier studies which found an increase of activity in the ipsilateral occipital area and decrease at the contralateral area when shifting attention to a specific point (Thut et al, 2006; Worden et al. 2000, van der Lubbe, 2013). Furthermore, Hesselink (2016) conducted a similar study with LPS-ERP instead of the LPS on raw EEG. Comparing our study with the study of Hesselink (2016) might give relevant information regarding the evoked or induced nature of attention. If we would find significant effects that are visible using LPS on raw EEG, but invisible using LPS-ERP, this would indicate induced activity.
To sum up, we will examine the relationship between visual attention and visual
8
Methods
Participants:
Twenty students from the University of Twente and Saxion University of Applied Sciences (8 women, 12 men, Mage=23) took part in the experiment. The participants received course credits for participating or volunteered without being compensated. All participants reported normal or corrected-to-normal vision, normal color vision, and had no history of neurological disorders. Ishihara's color blindness test (1976) was used to assess proper color vision, Annett's Handedness Inventory (1970) was used to determine the handedness of the participants (15 right handed, 1 ambidextrous). The experiment and its procedures were noninvasive and were approved by the ethical committee of the faculty of BMS of the university of Twente. All participants provided a written informed consent prior to the experiment. In addition a pilot test with two students of the University of Twente was performed.
Stimuli and Task:
Stimuli
All stimuli were presented on a black background on a 17 inch CRT computer screen, using Presentation software (Neurobehavioral Systems, Inc., 2012) to display the stimuli.
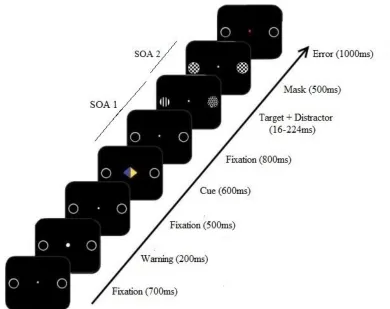
The default display consisted of a central white dot (0.164°x 0.164°) presented against a black background, with two light-grey circle outlines (12.06°, r=0.614°) on each side, which served as position markers. A symbolic rhombus shaped cue (location indicating stimulus), consisting of two coloured triangles (blue and yellow, with one colour defined as relevant), pointed with the relevant colour side towards the location where a target stimulus was going to appear. The target stimuli consisted of a circle with either horizontal or vertical lines, which were being masked after varying time intervals.
9 Figure 1: Schematic representation of the sequence of events in a trial during the endogenous attention task. This is a 100% valid cue set-up, with blue as relevant indicating color and a target cue of vertical lines. The fixation display at the end of the trial indicates that a wrong response was given. It also shows the interval between the location indicating stimulus onset and the target stimulus onset (SOA 1) and the interval between the target stimulus onset and the mask stimulus onset (SOA 2).
Task
10
Procedure:
The participants received information about the procedure and had to sign an informed consent for before starting the experiment. The task consisted of an endogenous cueing task, which was performed with a computer in a darkened room, while the brain activity of the participant was being measured with EEG. Subsequently, the participants performed a number of practice trials, to familiarize themselves with the task and to practice the covert shift of attention without moving their eyes. The whole experiment lasted for about 3 hours, the main task took 90 min to complete. It consisted of 8 blocks of around 11 minutes with one minute breaks between the block. The task consisted of 300 trials in total, which were shown in randomized and counterbalanced order for each participant. Figure 1 shows an example of a sequence of events during the endogenous attention task. Each trial commenced with a 700ms default display after which the onset of the trial was marked by a brief enlargement of the fixation dot (700ms).
This was followed by a cue (600ms) which indicated the side that had to be attended.
After a brief fixation display (800ms), the target cue was shown on the cued location in a time interval which varied per trial between 16-224 ms. Then, a bilateral mask display (500ms) was shown, followed by a fixation display (1000ms), which marked the end of the trial.
The fixation point was colored red in case of an erroneous response.
Design
Conditions:
The participants either were instructed to pay attention to the blue or the yellow side of a symbolic cue, in order to counterbalance against sequencing effects. The color condition stayed the same for each participant during the experiment.
Variables
In this study, we made use of two variables. A behavioral measure to assess individual differences in visual awareness and an EEG-based measure, to examine differences in the capacity to allocate visuospatial attention. As explained in the introduction, the combination of the endogenous attention paradigm with backward masking makes it possible to study individual differences in visual awareness. The performance in the task was thus taken as index for individual differences in visual awareness. Lateralized power spectra applied on the raw EEG were taken as index for the allocation of attention (see EEG processing and analysis).
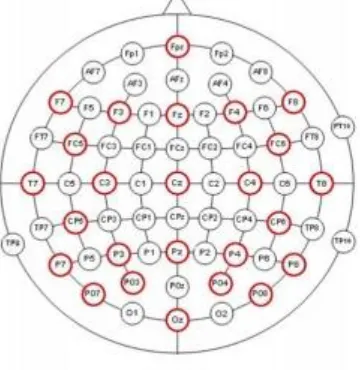
11 The electrical activity of the brain was recorded with ‘Brain Vision EEG Recorder‘ , using 25 passive Ag/AgCl ring electrodes. The electrodes were located on an elastic cap (Brain Products GmbH), on the following locations:Fpz, F7, F3, Fz, F4,F8, FC5, FC6, T7, C3, Cz, C4, T8, CP5, CP6, P7, P3, Pz, P4, P8, PO7, PO3, PO4, PO8, Oz . The vertical and horizontal electro-oculogram was recorded with bipolar electrodes, placed above and below the left eye (vEOG) and at the outer canthi of both eyes (hEOG), to control for vertical and horizontal eye movements. A ground electrode was placed on the stirn. The impedance levels of the electrodes were kept below 10 kΩ. To amplify the EEG and EOG recordings, a 72 channel amplifier ‘Quick Amp’ (Brain Products) was used.The EEG signal was recorded at a sampling rate of 500 Hz and was recorded with the Brain Vision Recorder software at a separate data acquisition computer.
Figure 2: Provides an overview of the electrode locations used in the experiment (colored in red). The majority of the electrodes are attached above frontal and occipital areas, because of their importance in attentional processes.
Data processing and Analysis:
Behavioral data processing
For later analysis, two performance measures of the endogenous attention paradigm were calculated. The first performance measure was the target stimulus onset to mask stimulus onset time interval (SOA-2).
It has been measured at which of the 14 different SOA-2 intervals the participant detected more than 75%
of the target stimuli correctly. Each participant gets a SOA-2 interval as visual awareness threshold assigned.
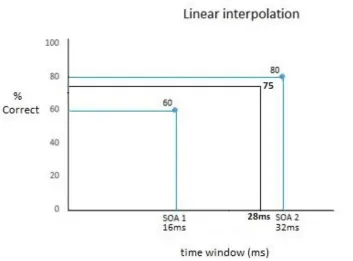
When the participant scored between two SOA-2 intervals, linear interpolation was used to calculate the
time point at which the participant scored 75% correctly (Figure 2). Imagine a participant scored 60% at the
first SOA-2 interval (16ms) and 80% correct at the second SOA-2 interval (32ms). The time interval where
the participant would score 75% correctly, must thus lie between 16 and 32 ms. To calculate the exact time
[image:12.612.84.264.244.429.2]12 by the difference in percentage correct between the second and the first SOA-2 interval (thus 20%). Also,
the time interval in between the two SOA-2 intervals (16ms) and time between 0 and the first SOA-2 interval
(16ms) have to be taken into account. From this calculations (depicted below), can be derived that the
participant would have reached 75% correct at a time interval of 28 ms
The second index for the performance in the task was the total number of correctly given responses.
This way, in the case that participants were assigned the same SOA-2 value, individual differences could still be examined by looking at how many correct responses were given in total compared to the average.
Figure 3. Illustrates how SOA-2 intervals, indicating individual visual awareness thresholds, could be calculated using linear interpolation.
EEG data processing
[image:13.612.75.428.292.553.2]13 2.0‘ (Brain Products GmbH, 2012). While recording the EEG, a high cutoff filter of 140 Hz and a notch
filter of 50 Hz was online applied to the EEG data. The data were collected with a sampling rate of 500 Hz
and the impedance was kept below 10 kilo ohm. To process the EEG data, a low cutoff filter of .016 Hz (24
db) and a high cutoff filter of 32 Hz (24db) were applied. A subset of the EEG signal ranging from -750ms
before cue onset to 3400 ms after the cue onset was taken for further processing. The baseline was set from
-100 to 0 ms. EEG segments where the horizontal EOG was more positive than 40 μV or more negative
than -40 μV were marked as eye movements and were removed.
Because the focus lies on the relationship between the changes in the EEG and the allocation of attention,
only the EEG segment from -750ms before cue onset till 2000ms after the cue were taken into account for
further analyses. Furthermore, EEG segments containing certain artefacts were removed from further analysis: gradient criterion from 100 microvolt per millisecond, minima and maxima criterion from -150 μV and + 150μV and a low activity criterion 0.1μV for a timeframe of 50 milliseconds. If the quality criteria
were not met, only the channels with artifacts (not necessarily the trials) were removed. An ocular correction algorithm developed by Gratton (1983) was applied and the EOG weighted with regression coefficients was subtracted from the EEG signal. From the total amount of 896 experimental trials, in average, 78% of the trials were taken into account for further analysis (after removal of an outlier).
Behavioral Analysis
The focus lay on individual differences of visual awareness in the task, so we ranked the participants
according to a combination of two performance measures (see behavioral data processing). To measure the performance in the task, we only looked at the accuracy of the given response while the reaction times remained irrelevant. The reaction times were not taken into account, because we instructed the participants, that they would have sufficient time to answer and they should prioritize accuracy.
EEG Analysis
14 study on the lateralized power spectra of the lower and upper alpha frequency band. Alpha-1 ranges from 7.2 to 10.7 Hz and alpha-2 ranges from 9.4 to 14 Hz. (Adeli & Ghosh-Dastidar, 2010; Raza, Cecotti & Prasad, 2015). The power of the LPS of the alpha frequency band provides information of the hemispherical differences of preparatory brain activity and covers induced as well as evoked activities.
Only a subset from the EEG data ranging from 400ms-1400 ms was taken into account for further analysis, based on the results of Aldiek (2015), who found significant alpha band lateralizations at this time interval. In order to be able to see graded changes in the frequency band lateralization, this EEG subset was subdivided into 24 time windows of 40 ms each. Much importance was given to the time interval between the onset of the location indicating stimulus and the onset of the target stimulus (SOA-1, see Figure 1).
To calculate the LPS of the alpha frequency band, the power of the alpha frequency bands was determined for contralateral(uncued side) and ipsilateral(cued side) sides, while averaging across cue directions. To correct for influences on LPS that arise from cue-independent hemispherical differences in neuronal activity (Verleger,2011), a double subtraction technique was used (Van der Lubbe & Utzerath, 2013). The double subtraction technique is derived from the single subtraction technique from Thut et al. (2006) and is used to calculate differences in frequency band power between ipsilateral and contralateral sites. In this calculation, the power within a specific frequency band (wp) at the time point (t) is determined for the hemispheres ipsi - and contralateral to the direction of the LVC/RVC.‘ (Van der Lubbe & Utzerath, 2013). The sum of the powers for LVC and RVC results in a lateralization index value between -1 and 1. ‘A positive sign indicates that the power within a specific frequency band ω was larger above the hemisphere ipsilateral to the cued side than contralateral, whereas a negative sign indicates the opposite pattern. A value of zero signifies the absence of hemispherical differences,‘(Van der Lubbe & Utzerath, 2013).
Furthermore a t-test was performed for each frequency band and each time window, to determine the significance of ipsi-contralateral differences. It is important to keep in mind that performing numerous tests always inherits the problems that some significant results are just occurring by chance
15 Because two time intervals in a row are taken into account, the square root has to be taken from the value, which leads to .014 as new critical value (see calculation below).
Following that, the correlation between the ranked performances in the task and the LPS of the lower and higher alpha frequency band were calculated.
16 Results
Behavioral measures
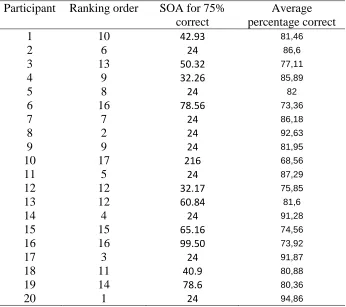
In general, the target discrimination was easier than expected, participants surpassed after relative short time intervals the 75% correct threshold. Unlike in earlier studies, the side of the visual field where the target cue appeared seemed to have no influence on the percentage of correct responses in the task (Kroes 2015, Verleger et al., 2011). The participants differed significantly in their perception threshold. The criterion values were calculated per individual, they indicate the time interval the participants give more than 75% correct responses in the task .The criterion value varied a lot across participants, (m=56.2, SD=45.2), with a minimum of 24ms and a maximum of 216ms. Also, the average percentage of correct responses during the whole experiment was calculated per participant.An overview of the individual performance in the task is shown in Appendix F, Table 4. The percentage of correct responses seem to increase with the length of the SOA-2 intervals, which might point towards learning effects. The average SOA interval to reach 75% correct was 50,7 ms and the average percentage correct 82,4 .
EEG measures
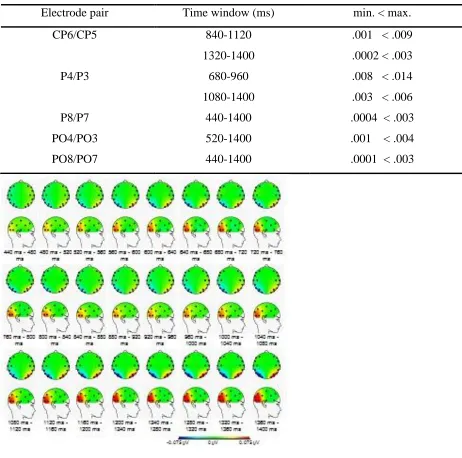
17 Table 1.
A summary of effects observed for alpha-1 -frequency band (7.2 Hz – 10.7 Hz). The significance
criterion had to be crossed for at least two successive time windows (p < 0.014).
Electrode pair Time window (ms) min. < max.
CP6/CP5 840-1120 .001 < .009
1320-1400 .0002 < .003
P4/P3 680-960 .008 < .014
1080-1400 .003 < .006
P8/P7 440-1400 .0004 < .003
PO4/PO3 520-1400 .001 < .004
[image:18.612.70.532.149.607.2]PO8/PO7 440-1400 .0001 < .003
Figure 5. Topographical maps for alpha1 frequency band spectra for the time windows
18 For alpha-2 frequency band (9.4 Hz – 14 Hz) significant differences in the alpha-2 lateralization were found especially in later time windows (Table 2.). The strongest lateralization was found between 1360-1400 ms after trials onset above parietal areas (CP6, p=.00004, P4, p=0.0001, P8, p=.00003). The time windows where a significant hemisphere (ipsi-contralateral) power difference was found are shown in Figure 6.
Table 2.
A summary of effects observed for alpha-2 -frequency band (9.4 Hz – 14 Hz). The significance
criterion had to be crossed for at least two successive time windows (p < 0.014).
Electrode pair Time window (ms) min.< max.
CP6/CP5 680-1400 .00004 < .007
P4/P3 720-800 .011 < .012
920-1400 .0001 < .005
P8/P7 440-1400 .00003 < .007
PO4/PO3 520-1400 .00006 < .009
[image:19.612.72.535.273.423.2]PO8/PO7 440-1400 .0002 < .005
Figure 6. Topographical maps for alpha2 for the time
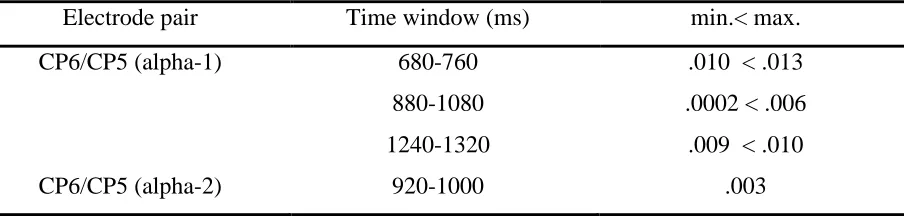
19 A correlational analysis was performed to study the relation between individual perceptual threshold and the strength of hemispheric lateralization. Significant correlations for 75% correct responses are found (table 3).
Table 3.
Significant correlations between alpha-1 and alpha-2 frequency band spectra and the SOA
(criterion value= 75%)
Electrode pair Time window (ms) min.< max.
CP6/CP5 (alpha-1) 680-760 .010 < .013
880-1080 .0002 < .006
1240-1320 .009 < .010
20
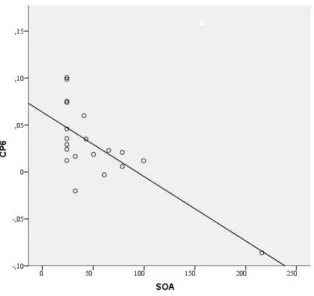
Figure 7. Shows relation between alpha lateralization and SOA criterion values in the time window
21 Discussion
We used this EEG study to examine the largely unknown relationship between visuospatial attention and visual awareness.
The first research question was, whether individual differences in visual awareness could be predicted by different capacities in the covert shift visuospatial attention. To answer this question we combined an endogenous attention orienting paradigm, backward masking and LPS applied on the raw EEG. Differences in the accuracy were found between participants, time intervals and time windows. This indicated that the backward masking paradigm was effective in manipulating visual awareness. The connection between visual attention and visual awareness was studied by correlating the performance index of the task, with the lateralized power spectra of the alpha band frequency. The results showed, that there was a significant correlation between the ability to shift visual attention and different visual awareness thresholds, for all above
occipito-parietal areas. This shows that individual performances in the endogenous attention paradigm could be predicted by lateralized activity, as it was presumed by Aldiek (2015). However, it should be noted that the allocation of visual attention seems to be only partially predictive for individual differences in visual awareness. There might be other processes which also influence visual awareness, for example properties of the sensory input (Lamme, 2004).
In the following will be reasoned, how the results of this study could be related to the theoretical concepts of Lamme and Dehaene about the relationship between attention and
awareness. From the results mentioned above can be concluded that attention might be necessary for visual awareness, but is not sufficient to make us aware of something we see. Visual
22 attention paradigm with backward masking. Therefore, it should be possible to predict visual awareness thresholds in the task with the help of LPS of the alpha frequency band. This would mean that participants with a good ability to allocate their visual attention should exhibit strong lateralized alpha band power spectra, while keeping a high stimulus detection accuracy ,even at short intervals ,between the target and the mask stimulus.
The second research question was to determine whether the allocation of attention has an evoked or an induced nature. To answer this question, we made use of two approaches. First we examined hemispherical differences in the lateralizations of the alpha frequency band. In line with Aldiek (2015) significant alpha band lateralizations were found above parietal and occipital areas. In line with earlier studies, the power was found to be greater ipsilateral to the cued side than contralateral, which points towards an induced nature of the allocation of attention (Kroes, 2015). Number of studies have emphasized the role of alpha band oscillation for inhibitory processes in the allocation of attention (Foxe & Snyder, 2011, Gould, Rushworth & Nobre, 2011, Kelly, Lalor, Reilly & Foxe, 2006). In the used endogenous attention paradigm, the sensory input of contralateral side (which was irrelevant for the task) could have been inhibited by alpha band oscillations, so that sensory input from ipsilateral sides could receive enhanced processing.
The second approach to study the nature of the allocation of attention was to compare the results of the current study, with the study of Hesselink (2015), who conducted a similar
experiment with LPS-ERP as measure. The comparison showed, that there were a number of significant effects that were found in our study, which could not be found in the study of Hesselink (2015). This led us to conclude, that the allocation of attention has an induced rather than evoked nature, because if it would have had an induced nature, the effects should have been visible also in the study using LPS-ERP. This is in line with other studies, who suggest that attention is controlled via internal top-down processes (Grent-'t-Jong et al., 2011, Kroes 2015). This pledges for an induced rather than evoked nature of the neural mechanisms underlying the allocation of attention, as proposed by Hermann (2005). What can be further concluded from these results is, that LPS applied on raw EEG is to be favoured over LPS-ERP when aiming to study the allocation of visual attention, because the processes seems to be of induced nature, which cannot be studied with LPS-ERP.
In conclusion, the ability of shifting visual attention has only a small predictive value for
23 to explain differences in the visual awareness threshold in the endogenous attention task. The allocation of visual attention appears to be of induced nature, which makes LPS applied on raw EEG a more favourable measure for the allocation of attention than LPS-ERP.
These findings could have important implications for the diagnostics of attention disorders like ADHD or for screening procedures for jobs with specific requirements (Mueller, Baner, Leong, Fleiss, Moehringer, Galletta & Balcer, 2015, Adeli et al., 2010).
LPS applied on raw EEG could be implemented as new index for the ability to allocate attention. One of the advantages would be, that LPS is sensitive for both evoked and induced processes and because it is independent from time locked events, it could be used in different paradigms and could be applied to other contexts. For example, LPS could be used as independent index to examine and compare the efficiency of different training methods to improve the ability to shift attention , for healthy people as well as for people with attention disorders.
Even though LPS on the raw EEG seems to be a promising measure to the allocation of visual attention, a lot of additional research is needed in order to shed light on the still controversial relationship between attention and awareness.
As mentioned earlier, the ability to shift attention seems to be not the only predictive variable for individual differences in visual awareness. Furthermore, different studies have pointed out that there are a lot of confounding variables when measuring the allocation of visuospatial attention (Aldiek 2015, Eckstein et al.,2004, Verleger, Smigasiewicz, Moeller, 2011).
24 There are several options possible in order to achieve that the participants stay motivated and try their very best in the task. One could think of implementing monetary incentives (Pessoa & Engelmann, 2010, Bonner & Sprinkle, 2002), as neuroimaging studies have shown that monetary incentives improve behavioral performance and increase activity in perceptual and cognitive regions (e.g., Pochon et al., 2002; Small et al., 2005; Engelmann et al., 2009).
` Several participants reported having blurred vision and having difficulties seeing the stimuli during the task. This effect is certainly mainly attributable to the successful manipulation of the target visibility with backward masking, but could be also partly attributable to individual differences in visual acuity as confounding variable, as some participants reported difficulties seeing the stimuli during the whole experimental task. It might be the case that the participants mildly differ on one of the components of visual acuity, such as individual differences in contrast sensitivity, a person's ability to detect a low contrast pattern stimuli. Measuring the contrast sensitivity could give a more accurate representation of the eye’s visual acuity. Furthermore it could be possible that some participants were unaware of mild impairments of their visual acuity. To control for confounding effects of individual differences in visual acuity, it has been proposed to conduct several tests for visual acuity prior to the experiment, such as the Freiburg visual acuity and contrast test (FRACT) (Bach, 1996; Cappe, 2014).
In summary, our interest was directed at the largely unknown relationship between visuospatial attention and visual awareness. To examine their relationship, we used the
25 References
Adeli, H., & Ghosh-Dastidar, S. (2010). Automated EEG-based diagnosis of neurological
disorders: Inventing the future of neurology. CRC Press.
Aldiek, L. (2015). The lateralization of anticipatory alpha oscillations while allocating
visuospatial attention (Unpublished bachelor thesis).University of Twente, Enschede,
Netherlands.
Annett, M. (1970). Annett handedness inventory. A classification of hand preference by association analysis. British Journal of Psychology, 61, 303-321.
Bach, M. (1996). The Freiburg visual acuity test-automatic measurement of visual acuity.
Optometry and Vision Science, 73, 49–53.
Ball, K., Berch, D. B., Helmers, K. F., Jobe, J. B., Leveck, M. D., Marsiske, M. & Unverzagt, F. W. (2002). Effects of cognitive training interventions with older adults: a randomized controlled trial. Jama, 288, 2271-2281.
Başar, E., Schürmann, M., Demiralp, T., Başar-Eroglu, C., & Ademoglu, A. (2001). Eventrelated oscillations are ‘real brain responses’—wavelet analysis and new strategies.
International Journal of Psychophysiology, 39, 91-127.
Bashinski, H.S., & Bacharach, V.R. (1980). Enhancement of perceptual sensitivity as the result of selectively attending to spatial locations. Perception & Psychophysics, 28, 241-248. Bleckley, M.K., Durso, F.T., Crutchfield, J.M., Engle, R.W., & Khanna, M.M. (2003). Individual
differences in working memory capacity predict visual attention allocation. Psychonomic
Bulletin & Review, 10, 884-889.
Block, N. (2005). Two neural correlates of consciousness. Trends in cognitive sciences, 9(2), 46-52.
Bonner, S.E., & Sprinkle, G.B. (2002). The effects of monetary incentives on effort and task performance: theories, evidence, and a framework for research. Accounting,
Organizations and Society, 27, 303-345.
Breitmeyer, B.G. (2014). The visual (un)conscious and its (dis)contents:
A micro temporal approach. New York, NY: Oxford University Press.
Breitmeyer B.G. & Öğmen, H. (2006). Visual Masking: Time Slices Through Conscious and
26 Bushara, K.O., Grafman, J., & Hallett, M. (2001). Neural correlates of auditory–visual stimulus
onset asynchrony detection. The Journal of Neuroscience, 21, 300-304. Buzsaki, G. (2006). Rhythms of the Brain. Oxford University Press.
Cappe, C., Clarke, A., Mohr, C., Herzog, M. H. (2014). Is there a common factor for vision?
Journal of Vision, 14, 1-11.
Carrasco, M. (2011). Visual attention: The past 25 years. Vision research, 51(13), 1484-1525. Chen, W. Y., Wilson, P. H., & Wu, S. K. (2012). Deficits in the covert orienting of attention in
children with Developmental Coordination Disorder: Does severity of DCD count?. Research in developmental disabilities, 33, 1516-1522.
Clay, O. J., Wadley, V. G., Edwards, J. D., ROTH, D. L., Roenker, D. L., & Ball, K. K. (2005). Cumulative meta-analysis of the relationship between useful field of view and driving performance in older adults: Current and future implications. Optometry & Vision
Science, 82, 724-731.
Cohen, M. A., Cavanagh, P., Chun, M. M., & Nakayama, K. (2012). The attentional requirements of consciousness. Trends in cognitive sciences, 16, 411-417. Colman, A.M. (2015). A dictionary of psychology. Oxford university press.
Corbetta, M., & Shulman, G.L. (2002). Controls of goal-directed and stimulus-driven attention in the brain. Nature Neuroscience, 3, 201‐215.
Dehaene, S., Changeux, J. P., Naccache, L., Sackur, J., & Sergent, C. (2006). Conscious,
preconscious, and subliminal processing: a testable taxonomy. Trends in cognitive sciences,
10, 204-211.
De Schotten, M.T., Dell'Acqua, F., Forkel, S.J., Simmons, A., Vergani, F., Murphy, D.G., & Catani, M. (2011). A lateralized brain network for visuospatial attention. Nature
neuroscience, 14, 1245-1246.
Derryberry, D., & Reed, M. A. (2002). Anxiety-related attentional biases and their regulation by attentional control. Journal of abnormal psychology, 111, 225.
Dunn, O. J. (1959). Estimation of the medians for dependent variables. The Annals of
Mathematical Statistics, 192-197.
Duchek, J. M., Hunt, L., Ball, K., Buckles, V., & Morris, J. C. (1997). The role of selective attention in driving and dementia of the Alzheimer type. Alzheimer Disease & Associated
27 Drummond, J. (2013) Visual Masking and Virtual Environments [Research page].
Retrieved from http://www.jasondrummond.info/art2_VmaskVE.html
Eckstein, M.P., Pham, B.T., & Shimozaki, S.S. (2004). The footprints of visual attention during search with 100% valid and 100% invalid cues. Vision research, 44, 1193-1207.
Egner, T., Monti, J.M., Trittschuh, E.H., Wieneke, C.A., Hirsch, J., & Mesulam, M.M. (2008). Neural integration of top-down spatial and feature-based information in visual search.
The Journal of Neuroscience, 28, 6141-6151.
Engelmann, J.B., Damaraju, E., Padmala, S., & Pessoa, L. (2009). Combined effects of attention and motivation on visual task performance: transient and sustained motivational effects.
Frontiers in Human Neuroscience, 3, 1-17.
Fan, J.; McCandliss, B.; Sommer, T.; Raz, A.; Posner, M. (2002). "Testing the efficiency and independence of attentional networks". Journal of Cognitive Neuroscience14,
340–347.
Foxe, J.J., & Snyder, A.C. (2011). The role of alpha-band brain oscillations as a sensory suppression mechanism during selective attention. Frontiers in psychology, 2. Gould, I.C., Rushworth, M.F., & Nobre, A.C. (2011). Indexing the graded allocation of
visuospatial attention using anticipatory alpha oscillations. Journal of
Neurophysiology, 105, 1318-1326.
Gratton, G., Coles, M. G., & Donchin, E. (1983). A new method for off-line removal of ocular artifact. Electroencephalography and clinical neurophysiology, 55, 468-484.
Green, C.S., & Bavelier, D. (2003). Action video game modifies visual selective attention.
Nature, 423, 534-537.
Grent-'t-Jong, T., Boehler, C.N., Kenemans, J.L., & Woldorff, M.G. (2011). Differential
functional roles of slow-wave and oscillatory-alpha activity in visual sensory cortex during anticipatory visual–spatial attention. Cerebral Cortex, 21, 2204- 2216.
Harley, T. (2008). The psychology of language. 3rd edition. New York: Psychology Press. p171. Haegens, S., Händel, B.F., & Jensen, O. (2011). Top-down controlled alpha band activity in
somatosensory areas determines behavioral performance in a discrimination task.
28 Haegens, S., Barczak, A., Musacchia, G., Lipton, M.L., Mehta, A.D., Lakatos, P., & Schroeder,
C.E. (2015). Laminar profile and physiology of the α rhythm in primary visual, auditory, and somatosensory regions of neocortex. The Journal of Neuroscience, 35,
14341-14352.
Herrmann, C., Grigutsch, M., & Busch, n.A. (2005). Eeg oscillations and wavelet analysis.
Event-related potentials. A methods handbook (pp. 229-260). Cambridge, MA: Mit Press.
Hesselink, G. (2016) Consciousness and Attention: The extent to which individual differences in
consciousness are predictable by evoked lateralized EEG activity (Unpublished bachelor
thesis).University of Twente, Enschede, Netherlands.
Hoffman, J.E. (1998). Visual attention and eye movements. Attention, 31, 119-153. Hopfinger, J. B., Buonocore, M. H., & Mangun, G. R. (2000). The neural mechanisms of
top-down attentional control. Nature neuroscience, 3, 284-291.
Hong, X., Sun, J., Bengson, J.J., Mangun, G.R., & Tong, S. (2015). Normal aging selectively diminishes alpha lateralization in visual spatial attention. NeuroImage, 106, 353-363. Ishihara, S. (1976). Test for color blindness, 38 plates edition. Tokyo: Kanehara Shuppen Co. Kelly, S.P., Lalor, E.C., Reilly, R.B., & Foxe, J.J. (2006). Increases in alpha oscillatory power
reflect an active retinotopic mechanism for distracter suppression during sustained visuospatial attention. Journal of Neurophysiology, 95, 3844-3851.
Klimesch, W. (2011). Evoked alpha and early access to the knowledge system: the p1 inhibition timing hypothesis. Brain Research, 1408, 52-71.
Klimesch, W. (2012). Alpha-band oscillations, attention, and controlled access to stored information. Trends in cognitive sciences, 16, 606-617.
Kroes, S. (2015).Efficiency of attentional allocation examined with lateralized EEG
power spectra (Unpublished bachelor thesis).University of Twente, Enschede,
Netherlands.
Lamme, V. A. (2003). Why visual attention and awareness are different. Trends in cognitive
sciences, 7(1), 12-18.
29 Lavie, N., Beck, D. M., & Konstantinou, N. (2014). Blinded by the load: attention, awareness
and the role of perceptual load. Philosophical Transactions of the Royal Society B:
Biological Sciences, 369, 20130205.
Lorist, M.M., Bezdan, E., ten Caat, M., Span, M.M., Roerdink, J.B., & Maurits, N.M. (2009). The influence of mental fatigue and motivation on neural network dynamics; an EEG coherence study. Brain Research, 1270, 95-106.
Mathewson, K.E., Gratton, G., Fabiani, M., Beck, D.M., & Ro, T. (2009). To see or not to see: prestimulus α phase predicts visual awareness. The Journal of Neuroscience,
29, 2725-2732.
Mueller, B., Baner, N., Leong, D., Fleiss, K., Moehringer, N., Galetta, S. & Balcer, L. (2015). Visual Performance Testing in Children with Attention Deficit Hyperactivity Disorder (P1. 330). Neurology, 84, 1-330.
Naccache, L., Blandin, E., & Dehaene, S. (2002). Unconscious masked priming depends on temporal attention. Psychological Science, 13, 416-424.
Pessoa, L., & Engelmann, J.B. (2010). Embedding reward signals into perception and cognition.
Frontiers in Neuroscience, 4, 1-8.
Peli, E., Bowers, A.R., Luo, G., & Zebehazy, K.T. (2005). Assessing visual aids for night blindness. Journal of Vision, 5, 23-23.
Peter, U. T., Martinez-Conde, S., Schlegel, A. A., & Macknik, S. L. (2005). Visibility, visual awareness, and visual masking of simple unattended targets are confined to areas in the occipital cortex beyond human V1/V2. Proceedings of the National Academy of Sciences
of the United States of America, 102, 17178-17183.
Pins, D. (2003). The neural correlates of conscious vision. Cerebral cortex, 13, 461-474. Pochon, J.B., Levy, R., Fossati, P., Lehericy, S., Poline, J.B., Pillon, B. & Dubois, B. (2002).
The neural system that bridges reward and cognition in humans: an fMRI study.
Proceedings of the National Academy of Sciences, 99, 5669-5674.
Posner, M. I. (1980). Orienting of attention. Quarterly Journal of Experimental Psychology, 32, 3-25.
Posner, M.I., & Cohen, Y. (1984). Components of visual orienting. Attention and performance x:
30 Posner, M. I., & Petersen, S. E. (1989). The attention system of the human brain 89.
Washington University St. Louis, Department of Neurology.
Posner, M. I. (2014). Orienting of attention: then and now. The Quarterly Journal of
Experimental Psychology, (ahead-of-print), 1-12.
Raffone, A., Srinivasan, N., & van Leeuwen, C. (2014). Perceptual awareness and its neural basis: bridging experimental and theoretical paradigms. Philosophical Transactions of the
Royal Society B: Biological Sciences, 369, 201-203.
Raza, H., Cecotti, H., & Prasad, G. (2015). Optimising frequency band selection with
forward-addition and backward-elimination algorithms in EEG-based brain-computer interfaces. In Neural Networks (IJCNN), 2015 International Joint Conference), 1-7. Rihs, T.A., Michel, C.M., & Thut, G. (2007). Mechanisms of selective inhibition in visual
spatial attention are indexed by α‐band EEG synchronization. European Journal of
Neuroscience, 25, 603-610.
Romei, V., Gross, J., & Thut, G. (2010). On the role of prestimulus alpha rhythms over
occipito-parietal areas in visual input regulation: correlation or causation? The Journal of
Neuroscience, 30, 8692-8697.
Sauseng, P., Klimesch, W., Doppelmayr, M., Pecherstorfer, T., Freunberger, R., &
Hanslmayr, S. (2005). EEG alpha synchronization and functional coupling during top down processing in a working memory task. Human Brain Mapping, 26, 148-155. Schlotzhauer, S. D. (2007). Elementary statistics using JMP. SAS Institute.
Shevrin, H. (Ed.). (1996). Conscious and unconscious processes: Psychodynamic, cognitive, and neurophysiological convergences. Guilford Press. p 102.
Shimi, A., Kuo, B. C., Astle, D. E., Nobre, A. C., & Scerif, G. (2014). Age group and individual
differences in attentional orienting dissociate neural mechanisms of encoding and
maintenance in visual STM. Journal of cognitive neuroscience, 26, 864-877.
Small, D.M., Gitelman, D., Simmons, K., Bloise, S.M., Parrish, T., & Mesulam, M.M. (2005). Monetary incentives enhance processing in brain regions mediating top-down control of attention. Cerebral Cortex, 15, 1855-1865.
Summerfield, C., & Egner, T. (2009). Expectation (and attention) in visual cognition. Trends in
Cognitive Sciences, 13, 403-409.
31 activity over occipital cortex indexes visuospatial attention bias and predicts visual target detection. The Journal of Neuroscience, 26, 9494- 9502.
Underwood, G., Chapman, P., Brocklehurst, N., Underwood, J., & Crundall, D. (2003). Visual attention while driving: sequences of eye fixations made by experienced and novice drivers. Ergonomics, 46, 629-646.
Vandenberghe, R., Molenberghs, P., & Gillebert, C. R. (2012). Spatial attention deficits in humans: the critical role of superior compared to inferior parietal lesions.
Neuropsychologia, 50, 1092-1103.
Van der Lubbe, R.H., Neggers, S.F., Verleger, R., & Kenemans, J.L. (2006). Spatiotemporal overlap between brain activation related to saccade preparation and attentional orienting.
Brain research, 1072, 133-152.
Van der Lubbe, R.H., & Utzerath, C. (2013). Lateralized power spectra of the EEG as an index of visuospatial attention. Advances in Cognitive Psychology, 9, 184.
Van der Lubbe, R.H., Bundt, C., & Abrahamse, E.L. (2014). Internal and external spatial
attention examined with lateralized EEG power spectra. Brain research, 1583, 179-192. Van Gaal, S., & Fahrenfort, J. J. (2008). The relationship between visual awareness, attention,
and report. The Journal of Neuroscience, 28, 5401-5402.
Verleger, R., Śmigasiewicz, K., & Möller, F. (2011). Mechanisms underlying the left visual‐ field
advantage in the dual stream RSVP task: Evidence from N2pc, P3, and distractor‐evoked VEPs. Psychophysiology, 48, 1096-1106.
Wang, Y., Wu, J., Fu, S., & Luo, Y. (2015). Orienting and focusing in voluntary and involuntary visuospatial attention conditions. Journal of Psychophysiology.
Watanabe, M., Cheng, K., Murayama, Y., Ueno, K., Asamizuya, T., Tanaka, K., & Logothetis, N. (2011). Attention but not awareness modulates the BOLD signal in the human V1 during binocular suppression. Science, 334, 829-831.
Worden, M.S., Foxe, J.J., Wang, N., & Simpson, G.V. (2000). Anticipatory biasing of
visuospatial attention indexed by retinotopically specific-band electroencephalography increases over occipital cortex. The Journal of Neuroscience. 20, 1-6.
Wright, R.D., & Ward, L.M. (2008). Orienting of Attention. New York: Oxford University Press. Wyart, V., & Tallon-Baudry, C. (2008). Neural dissociation between visual awareness and spatial
32 Young, A.W., & Haan, E.H. (1990). Impairments of visual awareness. Mind & Language, 5,
Apendix A
Toestemmingsverklaringformulier
Titel onderzoek: EEG analyse bij endogene aandachtstaak
Verantwoordelijke onderzoeker: Dr.R.H.J. van der Lubbe ([email protected])
In te vullen door de deelnemer
Ik verklaar op een voor mij duidelijke wijze te zijn ingelicht over de aard, methode, doel en mogelijke belasting van het onderzoek. Ik ben op de hoogte van het belang van het experiment en zal de aan mij gestelde vragen naar waarheid te beantwoorden. Ik weet dat de gegevens en resultaten van het onderzoek alleen anoniem en vertrouwelijk aan derden bekend gemaakt zullen worden.Ik stem geheel vrijwillig in met deelname aan dit onderzoek. Ik behoud me daarbij het recht voor om op elk moment zonder opgave van redenen mijn deelname aan dit onderzoek te beëindigen. Als ik nog verdere informatie over het onderzoek zou willen krijgen, nu of in de toekomst, kan ik me wenden tot Johanna Rippe ([email protected]) of Geert Hesselink ([email protected]).
Naam deelnemer: ...
Datum: ... Handtekening deelnemer: ...
In te vullen door de uitvoerende onderzoeker
Ik heb een mondelinge en schriftelijke toelichting gegeven op het onderzoek. Ik zal resterende vragen over het onderzoek naar vermogen beantwoorden. De deelnemer zal bij een eventuele voortijdige beëindiging van deelname aan dit onderzoek geen nadelige gevolgen ondervinden.
Naam onderzoeker: ...
Apendix B
Informatie Deelnemer
Titel onderzoek: EEG analyse bij endogene aandachtstaak
Verantwoordelijke onderzoeker: Dr.R.H.J. van der Lubbe ([email protected])
Naam Studentennummer
Leeftijd Geslacht
man vrouw O O
Heeft u al eerder aan een EEG onderzoek deelgenomen?
ja nee O O
Heeft u in het verleden neurologische aandoeningen (zoals epilepsie) gehad?
ja nee O O
Bent u kleurenblind ?
ja nee O O
De aangegeven informatie wordt vertrouwelijk behandeld.
Hiermee bevestig ik alle gegevens met waarheid ingevuld te hebben.
Apendix C
Informatieblad
Titel onderzoek: EEG analyse bij endogene aandachtstaak
Verantwoordelijke onderzoeker: Dr.R.H.J. van der Lubbe ([email protected])
Bedankt voor uw medewerking aan ons onderzoek. Hieronder staat beschreven wat het experiment precies inhoudt en wat u kunt verwachten. Mocht u na deze uitleg nog vragen hebben, kunt u deze uiteraard aan ons stellen.
In dit experiment gaat u een endogene aandachtstaak uitoefenen. Ondertussen wordt er door middel van EEG hersenactiviteit gemeten met behulp van kleine electrodes die op het hoofd worden geplaatst. Het aanbrengen van de electroden aan het hoofd kan onwennig aanvoelen, deze methode is echter pijnloos en ongevaarlijk.
In het begin van het experiment verschijnt er op het scherm een wit fixatiepunt waarop u uw ogen dient te richten. Vervolgens verschijnt er een gele of een blauwe driehoek. Deze blauwe/gele driehoek geeft de richting aan waar de relevante stimulus zal verschijnen. Vervolgens is het de taak te beoordelen of de relevante stimuli links danwel rechts verschijnt. Het is belangrijk dat u uw ogen hierbij op het fixatiepunt blijft richten. Indien er een cirkel met horizontale lijnen wordt getoond moet u de rechter CTRL toets indrukken. Voor de verticale lijnen geldt het tegenovergestelde; hierbij moet de linker CTRL toets ingedrukt worden.
Het zal af en toe zo zijn dat de stimulus zo snel wordt getoond dat u hem niet kunt waarnemen. Als u de antwoord niet weet, gok dan gewoon.
Ik heb de informatie op dit informatieblad begrepen en mijn vragen zijn naar tevredenheid beantwoord.
Apendix D
Annett Handedness Inventory
Apendix E
Figure 8. Shows the relationship between visuospatial attention and visual awareness, based on
Appendix F
Table 4.
Summary of the individual performance in the task
Participant Ranking order SOA for 75% correct
Average percentage correct
1 10 42.93 81,46
2 6 24 86,6
3 13 50.32 77,11
4 9 32.26 85,89
5 8 24 82
6 16 78.56 73,36
7 7 24 86,18
8 2 24 92,63
9 9 24 81,95
10 17 216 68,56
11 5 24 87,29
12 12 32.17 75,85
13 12 60.84 81,6
14 4 24 91,28
15 15 65.16 74,56
16 16 99.50 73,92
17 3 24 91,87
18 11 40.9 80,88
19 14 78.6 80,36
Apendix G
Significant lateralization in the alpha-1 frequency band
200 240 280 320 360 400 440 480 520 560 600 640 680 720 760 800 840 880 920 960 1000 1040 1080 1120 1160 1200 1240 1280 1320 1360 1400
F8/F7 ---
FC6/FC5 ---
CP6/CP5 --- ---
P4/P3 ---
P8/P7 ---
PO4/PO3 ---
PO8/PO7 --- ---
Apendix H
Significant lateralization in the alpha-2 frequency band
200 240 280 320 360 400 440 480 520 560 600 640 680 720 760 800 840 880 920 960 1000 1040 1080 1120 1160 1200 1240 1280 1320 1360 1400
T8/T7 ---
CP6/CP5 --- ---
P4/P3 ---
P8/P7 ---
PO4/PO3 --- ---
PO8/PO7 ---