University of Warwick institutional repository: http://go.warwick.ac.uk/wrap
This paper is made available online in accordance with publisher policies. Please scroll down to view the document itself. Please refer to the repository record for this item and our policy information available from the repository home page for further information.
To see the final version of this paper please visit the publisher’s website. Access to the published version may require a subscription.
Author(s): M.J. Harrison, D.P. Woodruff, and J. Robinson Article Title: Density functional theory calculations of adsorption-induced surface stress changes
Year of publication: 2008 Link to published version:
http://dx.doi.org/ 10.1016/j.susc.2007.10.011
Density functional theory calculations of adsorption-induced surface
stress changes
M.J. Harrison, D.P. Woodruff∗
Physics Department, University of Warwick, Coventry CV4 7AL, UK and J. Robinson
Abstract
Density functional theory calculations of adsorbate-induced surface stress changes have been performed for a number of adsorbate and overlayer systems for which experimental data exists, namely: oxygen and sulphur adsorption on Ni(100); oxygen adsorption on W(110); pseudomorphic growth of Ni on Cu(100) and of Fe on W(110); oxygen adsorption on a 5 ML pseudomorphic film of Ni(100) grown on Cu(100). The theoretical calculations reproduce all the qualitative features of the experimental data, but there are some significant quantitative differences, most notably for the two atomic adsorbates on the bulk Ni(100) surface, for which the theoretical stress changes are substantially smaller than the experimental ones, a situation not obviously attributable to experimental error. For the W(110)/Fe system there is also a marked difference between experiment and theory in the coverage at which key surface stress changes occur.
Keywords: Density functional calculations; chemisorption; surface stress; surface structure; nickel; copper; tungsten; iron; oxygen; sulphur; low index single crystal surfaces
∗
1. Introduction
While the equilibrium structure of surfaces is determined by the minimisation of the surface free energy, the role of one contribution to the energy, the surface stress, has been highlighted in some discussions of the factors determining quite a number of surface structures, particularly those involving reconstruction of the outermost surface layer(s) of both clean surfaces and some adsorbate-induced reconstructions. In most cases, however, these discussions are only qualitative, and there are rather few quantitative investigations of surface stress. Experimental studies of surface stress exploit the slight bending of a thin crystal ‘beam’ which occurs when the surface stresses on the two opposite faces are different; using a variety of methods to measure slight changes in the crystal curvature, the change in surface stress induced by adsorption on one face can be measured (e.g. [1]). This approach cannot, however, provide information on the absolute surface stress.
However, despite the interesting trends identified in these calculations, there is only one surface alloy phase for which there are experimental data on the alloying-induced surface stress change, with which to confront the theoretical calculations. For this one case, the Cu(100)c(2x2)-Mn surface phase, agreement between experimental [17] and calculated [18
14
] values of this quantity is rather good, the discrepancy of about 20% being modest for a quantity which is both difficult to measure and difficult to calculate with great precision. For more conventional (low atomic number) chemisorption systems, there are quite a number of experimental surface stress change measurements, but few calculations. For the case of oxygen adsorption on Pt(111) [ ], the agreement between theory and experiment is similar to that for the Cu(100)c(2x2)-Mn surface mentioned above. However, calculated stress changes associated with oxygen adsorption on Cu(100) in two different phases are about a factor of 3 larger than the experimental ones [19
15
]; we have suggested that this large discrepancy may be due to effects of stress relief at antiphase domain boundaries in the experimental measurements on these surfaces. Calculated stress changes for oxygen (and carbon) adsorption on Ni(100) have also been reported [ ]; these are discussed below in the context of our own results for the Ni(100)/O system.
provide quantitative information on the structural parameters associated with the lowest energy state of the surfaces, and these provide a further basis for comparison with experimental data.
2. Computational Details
The DFT calculations reported here were conducted using the CASTEP computer code [20], (version 3.02) with the aid of the Cerius graphical interface [21
[110]
]. Except for the case of Ni growth on Cu(100), calculations were conducted on 7-layer double-sided slabs with inversion symmetry around the central layer of atoms, with all layers allowed to relax perpendicular to the slab relative to this central layer. With both faces of the slabs having identical adsorbate coverage the surface stress is the same on each face and it is particularly trivial to extract this quantity from the calculated three-dimensional stress tensor. The surface stress was calculated analytically, based on the Hellmann-Feynman forces. The W(110) surface calculations were performed using the centred rectangular Bravais unit mesh to ensure a diagonalised stress tensor from which the in-plane anisotropy in the [001] and directions can be extracted directly. The lateral interatomic spacings within the slabs were fixed to the nearest neighbour value found in a similar DFT calculation for the bulk metals (using the same functionals and potentials); the associated bulk lattice parameters were 3.216 Å (W), 3.600 Å (Cu), 3.542 Å (Ni) and 2.816 Å (Fe).
conducted on the 7-layer Ni slab with the lateral interatomic spacings of Cu, providing a check on the O-induced surface stress change on the Ni films.
All calculations were performed in the generalised gradient approximation (GGA) using PBE functionals [22
16
] with a 380 eV cut off energy. k-point sampling used the Monkhorst-Pack scheme with a constant k-point spacing of less than 0.025 Å-1. This is a significantly smaller spacing (by about a factor of 2) than would typically be used in calculations performed for geometry or adsorption energy optimisation, but we have found this finer sampling is essential for reasonable convergence of surface stress values which depend on energy and force gradients [ ]. For W(110) this resulted in a 14x10x2 sampling grid, while for (1x1) and c(2x2) calculations on Ni(100) the sampling grids were 16x16x2 and 12x12x2 respectively.
3. Results and discussion
3.1 O and S adsorption on Ni(100) and W(110)
The surface stress changes associated with the formation of the c(2x2) adsorption phases of atomic O and S on Ni(100) provided some of the earliest measurements of adsorbate-induced surface stress changes [23 1, ], while subsequently biaxial measurements of the surface stress change associated with a similar 0.5 ML oxygen coverage phase (in this case (2x1)) on W(110) seem to have provided the first data on anisotropic surface stress changes in oxygen adsorption [24].
for which we report a value of 1.89 N/m, earlier calculations gave 1.38 N/m [10] and 1.40 N/m [11] in the same EAM calculations and 2.10 N/m [13] from a DFT slab calculation. Clearly our values are in the general range of previous calculations; we should emphasise that, as previously remarked both by us and other authors, the precision of surface stress calculations is generally much worse (probably no better than ~10%) than of other quantities derived from total energy calculations, such as adsorption energies and geometrical structural parameters, due to the more extreme demands of convergence and k-point sampling. Indeed, we should note that we have also previously reported a value of 2.39 N/m for the surface stress of Ni(100) and 1.51 N/m for Cu(100) in our studies of related surface alloy systems [16, 18]; the first of these values was obtained using an earlier version of CASTEP prior to improvements intended to render force calculations more reliable, while the second value did use the new version of the code and was also performed on 7-layer metal slabs in GGA using PBE functionals, but at that time the pseudopotentials available had been generated in LDA and not, as is the case in the pseudopotentials used here, in GGA. This difference in the combination of potential and approximation is known to lead to some differences in total energies [25
5
] and also leads to a small difference in the bulk lattice parameter which may, at least in part, account for the different absolute surface stress value. A check of the Mn-induced surface alloy phase on Cu(100) using the new pseudopotentials showed that the surface stress change was almost unchanged by the use of the different pseudopotentials. For W(110) there is also one previous theoretical study based on a semi-empirical calculation [ ], but the values of the surface stress reported, namely 0.27 N/m in the [001] direction and 2.29 N/m in
the[110] direction, differ very significantly from our values of 5.65 N/m and 3.75 N/m respectively. Not only is the quantitative value in the [001] direction very different, but the two calculations show opposite anisotropies. The methods of calculation are, however, very different, with our ab initio methods generally being regarded nowadays as substantially superior.
theory and experiment show a much larger surface stress change in the [110 direction ] than in [001]. However, Table 1 also shows some significant quantitative discrepancies between theory and experiment. For the W(110)(2x1)-O surface (as for our earlier calculations for two different structural phases of oxygen on Cu(100) [19]), the theoretically calculated surface stress changes are very significantly larger than the experimentally observed values, but the opposite is true for the Ni(100)c(2x2)-S and Ni(100)c(2x2)-O systems.
ordering. Within these boundary regions (in which the local adsorbate coverage is expected to be lower) one might expect local adsorbate-induced stress relief to occur, so the average surface stress over the whole crystal is less than the stress within a single ordered domain – which corresponds to the quantity calculated theoretically. This problem was felt to be particularly relevant to the Cu(100)/O systems, for which there is clear prior evidence of domain boundary effects in the structures [19], but it is less clear that this is particularly important in the systems reported on here.
to the chemisorbed O atoms, and if they constrain this spacing to values lower than the one corresponding to the lowest total energy, the adsorbate-induced compressive surface stress change increases, and indeed can be increased to a value larger than that measured experimentally. One feature of both of these DFT calculations (our GGA and these earlier recent, mainly LDA, calculations) is that they both provide an excellent description of the equilibrium structure relative to experimental structural studies of these much-studied surfaces.
In the case of the W(110)/O system, for which the calculated surface stress change values are larger than the experimental values, a difference which could conceivably be related to stress relaxation and antiphase domain boundaries, the optimised structure is also in very good agreement with experimental structure determination, as shown in Table 2. There appears to be only one rather early quantitative LEED investigation of the W(110)(2x1)-O surface phase [29
26
] that investigated only the O-W interlayer spacings, and not relaxation or rumpling of the substrate. Interestingly, our calculations show that while oxygen adsorption on Ni(100) and Cu(100) leads to an expansion of the outermost substrate layer spacing, on W(110) the outermost substrate layers show a significant contraction. It would be interesting to know if this can be confirmed experimentally. As noted above, the surface stress change measurements for oxygen adsorption on W(110) do show that with continued oxygen exposure the initial crystal bending associated with a compressive change in surface stress eventually attenuates to near zero, an effect attributed by the authors to oxygen adsorption on the back face of the crystal [ ]. The shape of the crystal bending versus oxygen exposure plot found, with a rapid change at low exposure and a much slower decrease at high exposure, strongly suggests that the arrival rate at the back of the crystal is much lower than at the front, so the maximum bending seen is unlikely to be more than a few percent less than that characteristic of the total adsorbate-induced stress change. This effect is therefore far too small to account for the large quantitative discrepancy between the experimental and theoretical surface stress changes reported in Table 1. Nevertheless, it is notable that the strong anisotropy of the surface stress change of the calculations is consistent with that observed experimentally.
3.2 Pseudomorphic growth of Ni on Cu(100) and O adsorption
pseudomorphic growth as a function of layer thickness, but also the stress change associated with exposure of pseudomorphically grown Ni(100) surface to produce a similar c(2x2)-O surface phase. There is no doubt that the most significant conclusions of this work relate to the nature of the oxygen surfactant layer when the Ni is grown onto a Cu(100) surface initially dosed with oxygen, but the experimental structure determination in this case indicates partial occupation of both surface and sub-surface oxygen sites together with surface roughening and some Ni/Cu intermixing. Realistic DFT slab calculations of this situation would require a very large supercell and are therefore beyond the scope of our present calculations. However, the experimental stress change data for oxygen dosing of the pseudomorphic layer grown on a clean Cu surface provide an interesting comparison of the influence of a c(2x2)-O overlayer on Ni(100) described in the previous section.
The rationale for this large difference is not simple, not least because oxygen adsorption on the strained Ni(100) surface leads to differences in the structural parameters, as shown in Table 3. Previous total energy calculations for this system produced results very similar to those of Table 3. In particular, Hong et al. [31] have performed similar DFT calculations for several different thicknesses of pseudomorphic Ni on Cu(100) with and without a c(2x2)-O overlayer. They find the interlayer spacing within the film to be 1.75 Å, closely similar to our value and slightly reduced relative to the value for bulk Ni due to the tetragonal distortion of the pseudomorphic layer. On the clean surface, however, the outermost Ni-Ni layer spacing is substantially contracted to 1.64 Å, while the oxygen overlayer causes this to increase to 1.84 Å; both of these are closely similar to the values we report in Table 3. These authors also find the adsorbed oxygen induces a rumpling of the second Ni layer by 0.03 Å, essentially identical to our value of 0.04 Å, but do not report the O-Ni interlayer spacing. Some results of similar calculations have been reported by Nünthel et al. [32
In considering the structural information of table 3, it is important to remember that the equilibrium bulk lattice parameters of Cu and Ni obtained from the DFT calculations differ from the true experimentally-determined values. Specifically, while the lattice parameters of Cu and Ni are 3.61 Å and 3.52 Å respectively (which differ by 2.5%), the values we find in our DFT calculations for the bulk solids are 3.60 Å and 3.54 Å (which differ by only 1.6%). Bearing in mind that this implies that the strain of the pseudomorphic Ni film is smaller in the DFT calculations than in reality, it is therefore surprising that the calculated tensile stress in the 5 ML film is actually slightly larger than that determined experimentally. A possible reason for this is an expected increasing roughness of the Ni film surface as it is grown without the aid of the oxygen surfactant.
3.3 Earliest stages of pseudomorphic growth of Fe on W(110)
There have been extensive investigations of the growth of the ferromagnetic 3d elements Fe, Co and Ni on W(110); like the Ni on Cu system described above, these are model systems of ultra-thin magnetic thin films, and some of this work has been accompanied by measurements of the associated changes in the associated stress (e.g. [34]). The growth of Fe on this surface has received particular attention, but it appears that pseudomorphic growth only occurs up to a coverage a little in excess of 1 ML; at higher coverages misfit dislocations appear in the film. Measurements of the surface stress change in this coverage range appear to reflect the effect of this structural change (Fig. 1). At the lowest (sub-monolayer) Fe coverages there is a slight decrease in the surface stress (i.e. the stress change is compressive – of the opposite sign to the tensile stress expected for the clean surface). With increasing coverage the stress change becomes tensile and rises sharply, reaching a local maximum at a coverage of 1.2 ML before dropping back and then rising more gradually as the average thickness increases to several atomic layers. Because the W(110) surface is only 2-fold symmetric, the surface stress is anisotropic, as discussed for the clean surface in section 3.1.
While the difference in the coverage calibration suggested by the arrow-heads of fig. 1 therefore almost certainly does not have any basis in fact, the figure does show rather clearly that the qualitative trends of the experimental and theoretical surface stress changes with increasing coverage are very similar. Both show an initial compressive stress changing to an increasing tensile stress. Both show a larger compressive stress at low coverage in the [001] direction, and a smaller tensile stress in this direction at higher coverage. The large tensile stress in the theoretical calculation for the (hypothetically pseudomorphic) 2 ML film is also consistent with the fact that the substrate W(110) lattice parameter is much larger than that of bulk Fe; in the calculations the lateral Fe-Fe spacing is forced to be 2.785 Å, 14% larger than the equivalent value in bulk Fe of 2.439Å. Not surprisingly, the Fe-Fe interlayer spacing in this 2 ML film is only 1.87 Å, 0.12 Å smaller than in bulk Fe. At lower coverage, however, and particularly at sub-monolayer coverage, the calculations show that the behaviour is quite different, the local chemisorption (rather than lateral Fe-Fe attraction) leading to a compressive surface stress change. Quantitatively, however, the experimental and theoretical data of fig. 1 show rather important differences. In the [110 direction the theoretical surface stress ] changes are smaller than those measured experimentally. In the [001] direction, at the lowest coverage, the theoretical compressive stress change is larger than the experimental value. More significantly, perhaps, if we accept that the coverage calibration on both experiment and theory is correct, the coverage at which the switch from compressive to tensile stress changes occurs is different, the theory indicating that the compressive chemisorption behaviour is still the dominant effect, at least in the [001] azimuth.
4. Conclusions
theory and experiment. Here we have presented the results of a series of new calculations of adsorbate-induced surface stress changes of a variety of systems for which experimental data exist: O and S on Ni(100), O on W(110), pseudomorphic growth of Ni on Cu(100) and the effect of O adsorption on the surface of the resulting strained Ni(100) film, and the earliest stages of pseudomorphic growth of Fe on W(110). In all cases the qualitative trends of the experimental results are reproduced by the DFT calculations: O and S adsorption in all cases lead to a compressive surface stress change; ultra-thin pseudomorphic films of Ni(100) and Fe(110), both grown on substrates with larger lattice parameters, lead to increasing tensile surface stress; the sign of the anisotropy of the surface stress changes on W(110) produced by both O and Fe is the same in theory and experiment; Fe growth on W(110) at sub-monolayer coverage leads to a compressive surface stress change. Despite all these successes, the quantitative agreement between theory and experiment, however, is generally not so good, with many cases in which they differ by a factor of two or more. In several cases the theoretical surface stress changes are larger than the experimental ones, and one possible contributory cause could be stress relaxation at antiphase domain boundaries in the experimental surfaces. However, for O and S adsorption on Ni(100), in particular, the measured surface stress changes are about a factor of two larger than the calculated values. Interestingly, recent independent calculations of the surface stress change associated with O adsorption on Ni(100) [15] lead to the same result; indeed, these calculations yield even lower calculated values than our own results.
function of the surface energy, it is therefore perhaps not surprising that getting the surface stress correct is even more demanding. One consequence of this that we have already identified is the need to use much finer k-point sampling than would normally be regarded as necessary to calculate the surface structure or the adsorption energy, in order to achieve reasonable convergence of the surface stress value. It may be that the choice of approximation and functional is also relevant to obtain the most reliable surface stress values. Of course, it would also be of interest to have a check on some of the experimental values. Ideally, one would like to have alternative methods of measurement, but while there are alternative methods to measure the adsorption-induced crystal bending, there seems to be no alternative to the basic strategy of measuring the macroscopic bending as a way of determining the surface stress changes.
Acknowledgements
Table 1. Summary of calculated absolute surface stress in Ni(100), Cu(100) and W(110)
and for various O and S adsorption structures on these surfaces, together with both calculated and experimental adsorbate-induced surface stress changes.
Surface Calculated
surface stress (N/m)
Calculated
adsorbate-induced
surface stress change (N/m)
Experimental adsorbate-induced
surface stress change (N/m)
Ni(100) 2.22
Ni(100)c(2x2)-S -0.98 -3.21 -5.0
Ni(100)c(2x2)-O -0.38 -2.60 -5.4
Cu(100) 1.89
W(110) 5.65 [001],
3.75 [110 ]
W(110)(2x1)-O -0.50 [001],
-4.87 [110 ]
Table 2
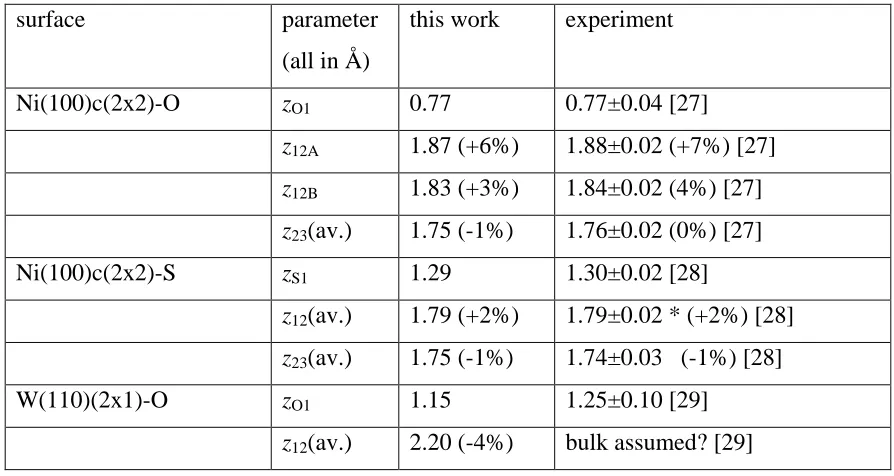
Comparison of the structural parameters of the lowest energy surface structures found in this study with experimental measurements of the same quantities for O and S adsorption phases on Ni(100) and W(110). * indicates a value for which layer rumpling (found in our calculations) was not tested in the experimental structure determination. The figures in parentheses are the fractional changes in interlayer spacing relative to the bulk values.
surface parameter
(all in Å)
this work experiment
Ni(100)c(2x2)-O zO1 0.77 0.77±0.04 [27] z12A 1.87 (+6%) 1.88±0.02 (+7%) [27] z12B 1.83 (+3%) 1.84±0.02 (4%) [27]
z23(av.) 1.75 (-1%) 1.76±0.02 (0%) [27]
Ni(100)c(2x2)-S zS1 1.29 1.30±0.02 [28]
z12(av.) 1.79 (+2%) 1.79±0.02 * (+2%) [28]
z23(av.) 1.75 (-1%) 1.74±0.03 (-1%) [28]
W(110)(2x1)-O zO1 1.15 1.25±0.10 [29]
Table 3
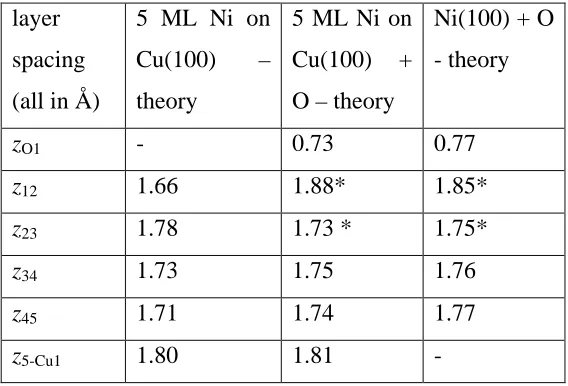
Interlayer spacings for a 5 ML pseudomorphic film of Ni on Cu(100) with and without a c(2x2)-O overlayer, as determined in the present theoretical calculations. Also shown are comparable values of the Ni(100)c(2x2)-O surface as reported in Table 2. *in both the bulk Ni(100) and the pseudomorphic film O adsorption leads to a rumpling of the second Ni layer of 0.04 Å, with the Ni atom directly below the O atom lower in the surface (see table 2). The z12 and z23 values given for these structures are the average interlayer spacings.
layer spacing (all in Å)
5 ML Ni on Cu(100) – theory
5 ML Ni on Cu(100) + O – theory
Ni(100) + O - theory
zO1 - 0.73 0.77
z12 1.66 1.88* 1.85*
z23 1.78 1.73 * 1.75*
z34 1.73 1.75 1.76
z45 1.71 1.74 1.77
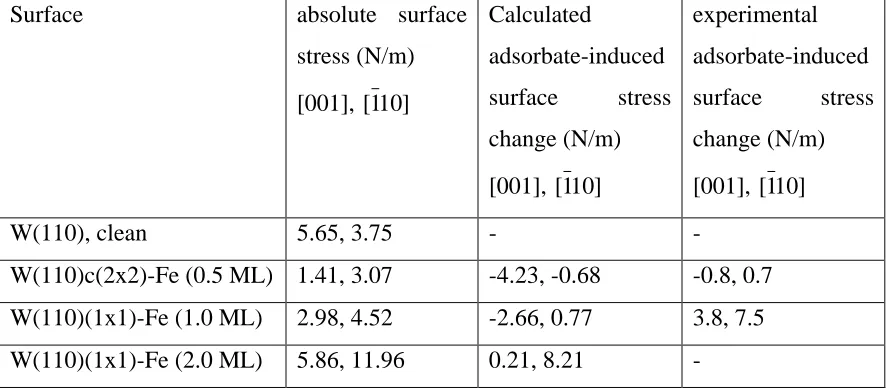
[image:21.612.84.368.257.450.2]Table 4. Calculated absolute surface stress values and adsorbate-induced changes in the
surface stress for Fe growth on W(110). Also shown are the experimental surface stress changes at the calculated coverages taken from the data of fig. 1. Experimental values are not given for the 2 ML film as this is judged not to be pseudomorphic.
Surface absolute surface
stress (N/m)
[001], [110 ]
Calculated
adsorbate-induced surface stress change (N/m)
[001], [110 ]
experimental adsorbate-induced surface stress change (N/m)
[001], [110 ]
W(110), clean 5.65, 3.75 - -
Figure Caption
References
1 H. Ibach, Surf. Sci. Rep. 29 (1997) 193
2 O. H. Nielsen, R. M. Martin, Phys. Rev. Lett. 50 (1983) 697 3 O. H. Nielsen, R. M. Martin, Phys. Rev. B 32 (1985) 3780 4 O. H. Nielsen, R. M. Martin, Phys. Rev. B 32 (1985) 3792 5 G. J. Aukland, M. W. Finnis, Phil. Mag. A 54 (1986) 302 6 R. J. Needs, Phys. Rev. Lett. 58 (1987) 53
7 D. Vanderbilt, Phys. Rev. Lett. 59 (1987) 1456
8 M.C. Payne, N. Roberts, R. J. Needs, M. Needels, J.D. Joannopoulos, Surf. Sci. 211/212 (1989) 1
9 R. J. Needs, M. J. Godfrey, M. Mansfield, Surf. Sci. 242 (1991) 215 10 P. Gumbsch, and M. S. Daw, Phys. Rev. B 44, 3934 (1991)
11 J. Wan, Y. L. Fan, D. W. Gong, S. G. Shen, and X. Q. Fan, Modelling Simul. Mater. Sci. Eng. 7, 189 (1999)
12 P. M. Marcus, X. Qian, W. Hübner, J. Phys.: Condens. Matter 12 (2000) 5541 13 Y. Yoshimoto, and S. Tsuneyuki, App. Surf. Sci. 237, 274 (2004)
14 P.J. Feibelman, Phys. Rev. B 56 (1997) 2175
15 S. Hong, A. Kara, T. S. Rahman, R. Heid, K. P. Bohnen, Phys. Rev. B 69 (2004) 195403
16 M. J. Harrison, D .P. Woodruff, J. Robinson, Surf. Sci. 572 (2004) 309
17 W. Pan, R. Popescu, H. L. Meyerheim, D. Sander, O. Robach, S. Ferrer, Minn-Tsong Lin, and J. Kirschner, Phys. Rev. B 71, 174439 (2005)
18 M.J. Harrison, D.P.Woodruff and J.Robinson, Phys. Rev. B 72 (2005) 113408 19 M.J. Harrison, D.P. Woodruff, J. Robinson, D. Sander, W. Pan, J. Kirschner, Phys.
Rev. B 74 (2006) 165402
20 M.C. Payne, M.P. Teter, D.C. Allen, T.A. Arias and J.D. Joannopoulos Rev.Mod.Phys. 64 (1992) 1045
21 http://www.accelrys.com/cerius2/qmw.html
24 D. Sander, A. Enders, C. Schmidthals, D. Reuter, J. Kirschner, Surf. Sci. 402-404
(1998) 351
25 M. Fuchs, M. Bockstedte, E. Pehlke, M. Scheffler, Phys. Rev. B 57 (1998) 2134 26 D. Sander, A. Enders, J. Kirschner, Europhys. Lett. 45 (1999) 208
27 W. Oed, H. Lindner, U. Starke, K. Heinz, K. Müller, J. B. Pendry, Surf. Sci. 224 (1989) 179
28 U. Starke, F. Bothe, W. Oed, K. Heinz, Surf. Sci. 232 (1990) 56 29 M. A. Van Hove, S. Y. Tong, Phys. Rev. Lett. 35 (1975) 1092
30 H. L. Meyerheim, D. Sander, R. Popescu, W. Pan, I. Popa, J. Kirschner, Phys. Rev. Lett. in press
31 J. Hong, R. Q. Wu, L. Lindner, E. Kosubek, K. Baberschke, Phys. Rev. Lett. 92 (2004) 147202
32 R. Nünthel, T. Gleitsmann, P. Poulopoulos, A. Scherz, J. Lindner, E. Kosubek, Ch. Litwinski, Z. LI, H. Wende, K. Baberschke, S. Stolbov, T. S. Rahman, Surf. Sci. 531 (2003) 53
33 C. Sorg, Pompandian, M. Bernien, K. Baberschke, H. Wende, R. Q. Wu, Phys. Rev. B 73 (2006) 064409
34 D. Sander, Rep. Prog. Phys. 62 (1999) 809
35 D. Sander, R. Skomski, A. Enders, C. Schmidthals, D. Reuter, J. Kirschner, J. Phys. D: Appl. Phys. 31 (1998) 663