Munich Personal RePEc Archive
New evidence of environmental efficiency
on the export performance
Sakamoto, Tomoyuki and Managi, Shunsuke
Center for Low Carbon Society Strategy, Japan Science and
Technology Agency, Urban Institute, Departments of Urban and
Environmental Engineering, School of Engineering, Kyushu
University
2016
Online at
https://mpra.ub.uni-muenchen.de/74850/
-1-
New evidence of environmental efficiency on the export performance
Tomoyuki Sakamoto†
† Center for Low Carbon Society Strategy, Japan Science and Technology Agency, Reseacher
(E-mail: [email protected]) and
Shunsuke Managi‡
‡Urban Institute, Departments of Urban and Environmental Engineering, School of Engineering, Kyushu University, Professor.
Date: April 15, 2016
Abstract
This article investigates the relationship between the environment-related efficiency and export performance according to the recent international trade theory which has offered to a theoretical model to quantify the Ricardian comparative advantage. We find that the energy and environmental efficiency can be a source of the comparative advantage in industries. The largest magnitude and the smallest of the efficiency on exporting are estimated to be NOx and energy efficiency, respectively. The empirical results further show that the efficiency has a smaller impact on export performance in relatively less footloose industries, and the impact of the efficiency is found to depend on industrial characteristics.
Highlight
We model trade theory can quantify the Ricardian comparative advantage considering energy and
environmental efficiency.
We analyze the environment-related efficiency and export performance empirically.
The result shows that the efficiency can be a source of the comparative advantage in industries.
The efficiency has a smaller impact on export performance in relatively less footloose industries.
Keywords:
-1-
1
Introduction
One of the fundamental questions that drive the literature that connects international trade and the environment is whether trade flow affects environmental aspects, such as environmental quality and regulation, and vice versa. The related literature can be classified into two categories. The first set of literature focuses on whether trade liberation influences environmental quality. The second set concerns how the stringency of environmental regulation in an exporting country affects trade flow. This paper falls into the latter category, but it differs from previous empirical analyses in that we shift the focus of analysis from regulatory effects to the effects of energy efficiency.
The influence of trade on the environment depends on scale, technique, and composition effects (Grossman
and Krueger, 1991)1. Previous empirical analyses have attempted to quantify the influence of these effects
(Antweiler et al., 2001; Arce et al., 2016; Cole and Elliott, 2003; Grossman and Krueger, 1995; Managi et al., 2009; McAusland and Millimet, 2013; Meng et al., 2015). In contrast, many theoretical and empirical works have studied the impact of environmental regulation on trade flow. The discussions particularly focus
on the pollution haven hypothesis2, which claims that stringent environmental regulations induce the
comparative advantage of less pollution-intensive industries because regulation imposes relatively higher costs on pollution-intensive industries (Ederington et al., 2005; Ederington and Minier, 2003; Levinson and Taylor, 2008; Managi et al., 2009). However, the empirical studies provide little consensus on the relationship between environmental regulation and trade flow.
We focus on environment-related efficiency because the impact of technology that improves environmental externalities has received little attention in the main economics literature, although many economists recognize its vital importance (Carraro et al., 2014). Hence, this paper attempts to provide further insight into the roles of resources and the environment in economic activity, particularly in trade. We analyze the relationship between the environment and trade by studying the effect on export performance of environment-related efficiencies, which are measured by energy use (energy efficiency) and pollution emissions (pollution efficiency) as units of production in the exporting country.
Our work is closely related to the literature on trade and heterogeneous productivity across industries and firms. The models in the literature show positive relationships between firm scale, capital intensity, and productivity in most countries (Bernard et al., 2003; Bernard and Jensen, 1999; Pavcnik, 2002). In these analyses, productivity plays a central role in understanding the exporting variation among domestic industries as well as among the firms in a specific industry. The productivity in these models generally refers to total factor productivity, which captures all factors except for capital and labor. We contribute to the literature by quantifying the effect of environment-related efficiency rather than the more conventionally used productivity.
1 Pollution emissions through trade depend on a magnitude relationship between these effects, but a basket of the three effects is generally undetermined in advance because the composition effect is thought to depend on a comparative advantage across countries.
-2-
We follow the setup and implication of Costinot et al. (2012), hereafter CDK, which tests a Ricardian comparative advantage based on a theoretical foundation. CDK uses labor per production as productivity. We apply their framework, which connects productivity and trade flow, by replacing the labor productivity in their model with environmental efficiency measured by energy use and emission levels. We test the theoretical implications using the trade flow data and the environment-related efficiency data from the World Input-Output Database (WIOD). Our analysis indicates that the degree of energy and pollution efficiency positively affects export levels across domestic industries.
The remainder of this article is organized as follows. Section 2 reviews previous studies that consider the relationship between trade and the environment and the effect of environmental regulation on trade. Section 3 explains the empirical models and the data. Section 4 provides estimation results. Section 7 discusses the results.
2
Trade, the Environment, and Productivity
This paper attempts to connect trade, energy and pollution efficiency. There are two sets of literature that are particularly relevant to this work. One concerns the impact of the environment on trade, and the other focuses on the relationship between trading patterns and productivity. We review the implications of both sets of studies separately.
2.1 The Environment and Trade
Tobey (1990) empirically showed that environmental regulation had little impact on net exports in the
pollution-intensive industries in developed countries3. Similarly, Xu (1999) found that export performance is
not particularly affected by variations in the stringency of environmental regulations; the export performance of environmentally sensitive goods was found to be stable between the 1960s and the 1990s, even as environmental standards became more stringent over this period. In contrast, Robison (1988) found a significant impact of environmental regulation on net exports using U.S. trade data. The author’s result indicates that a marginal change in abatement cost negatively influences industrial trade volume, and thus the goods with higher abatement costs are imported whereas the goods with lower abatement costs are exported.
Earlier empirical analyses assumed the exogeneity of environmental regulations in trade patterns (Robison, 1988; Tobey, 1990), but recent studies have ruled out such assumptions and addressed the endogeneity
between trade patterns and the stringency of regulations4. Taking endogeneity into account, the empirical
results appear to support the statistically significant effect of environmental regulations on trading patterns. Ederington and Minier (2003) found that environmental regulation had a positive impact on net imports in the U.S. Their results showed that a usual ordinal least square (OLS) estimation that did not consider
3 Beers and Bergh (1997) highlight that his results were influenced by inaccurate environmental policy indicators in his analysis.
-3-
endogeneity underestimated the magnitude of the marginal effect of environmental regulation. The empirical results of Levinson and Taylor (2008) also support the possible underestimation of regulatory impact if endogeneity is ignored. Using the data on environmental regulations in the U.S. and net imports to Canada and Mexico, the authors show that the positive impact of abatement costs on net imports from Mexico and the endogeneity-adjusted impact of environmental regulations are larger than the impact of unadjusted models.
The pollution haven hypothesis is popularly discussed and tested in the literature. This hypothesis predicts that the industries that are affected by stringent environmental regulations move to less-regulated environments to avoid the added costs from the imposed regulations. There is no consensus about the
hypothesis in the empirical analyses; whereas Antweiler et al. (2001) and Ederington et al. (2005)5 find little
support for the hypothesis, Managi et al. (2009) present empirical evidence that supports the predictions of the pollution haven hypothesis. Not only is the supportive empirical evidence for the hypothesis inconsistent, some argue that the pollution haven may be unrelated to environmental regulations. Chua (2003) built a theoretical model that implies that pollution taxes increase the prices of goods by increasing production costs, which consist of factor prices in a numeraire good and an abatement service.
There are empirical studies to investigate the relationship between a trade pattern and energy consumption at a country level. Sadorsky (2012a) shows that there is a positive relationship between them in the Middle East countries and Shahbaz et al. (2013) also find the positive bidirectional relationship between them in China. Moreover, the relationship is also found in the South American countries (Sadorsky, 2012b). These evidences illustrate that energy is an essential good for economic activities, but they seem to be hard to explain the structural mechanism of trade patterns to energy consumption and environmental regulations.
In order to connect the environment and trade, the previous studies have focused mainly on the effect of environmental regulations on the trade patterns of countries and industries. Where the importance of the regulation effect is typically emphasized, we consider the effect of the environment from a different angle, that of productivity rather than the regulations.
2.2Trade and productivity
The effect of productivity variation on trade patterns is well documented. The previous studies on trade and firms have indicated a robust relationship between the scale of firm capital intensity, productivity and export performance. Bernard and Jensen (1999) investigated a relationship between exporting and producing at the firm level using census data, and they showed that high-performance firms become exporters but that past export performance does not necessarily boost a firm’s current performance. Similarly, Aw et al. (2000) investigated the relationship using plant-level data from Korea and China, and Bernard and Wagner (2001) investigated using German data. Pavcnik (2002) analyzed the impact of tariff reductions on export performance using firm-level data in Chile and showed that tariff reductions encourage firms with relatively
-4-
lower productivity to exit the market. According to that study, exiting firms’ productivity is 8 percent lower than the average. Therefore, increased export performance is induced by the increase in average productivity, which is caused by the exit of lower-productivity firms.
One of the consistently observed facts is that the productivity of an engaged exporting firm is greater than
that of firms that only operate in the domestic market6. The measure of productivity that is used in these
studies is either estimated total factor productivity (Aw et al., 2000; Bernard and Jensen, 1999; Pavcnik,
2002)7 or labor productivity (Bernard and Wagner, 2001). Environment-related productivity may play an
increasingly significant as more attention is paid to the climate change in expanding global economy. It is possible that a change in trade pattern in exporters may reduce the global CO2 emissions (Arce et al., 2016). Therefore, it is important to investigate the relationship between the export and the productivity related to energy and environment. Many studies point out the insufficiency to implement cost-effective energy efficiency technologies, and there are possibilities to improve the energy and environmental efficiency in industrial sectors from engineering, social, and economic perspective (May et al., 2016; Palm and Thollander, 2010; Trianni et al., 2016). It is important to study the impact of the environment-related productivity improvement on exporting in industries, and we contribute to the literature by considering environment-related productivity, which may play an increasingly significant role.
The related literature suffers from a number of caveats. CDK highlights the “absence of clear theoretical foundations to guide the empirical analysis” in this field, and the authors emphasize the usefulness of the Ricardian comparative advantage framework to discuss the relationship between trade and the environment. Moreover, technology to improve environmental externalities is often ignored in the literature that studies the relationship between productivity and trade (Carraro et al., 2014). In an industry-level analysis that focuses on environment-related efficiency, CDK provides a theoretical model of Ricardian comparative advantage based on a micro-economic theoretical foundation. The model theorizes the effect of intra-industry heterogeneity in labor productivity on export performance and predicts that increases in relative productivity lead to better export performance. CDK also empirically test the prediction of their model. The dependent variable in the empirical model is the log of export, which is disaggregated by exporting and importing countries and differenced across exporters and industries. The productivity in CDK is a relative price using
producer price indices8. We base our analysis on the CDK model by moving the focus from labor productivity
to environment-related productivity, which is measured by energy usage and pollution emissions per unit of production. The roles of energy and environmental quality in economic activity, more specifically in trade, are further analyzed based on the CDK model in the next section.
6 Other facts can be summarized as follows: (i) large firms expand their scale and small firms exit the market when a trade policy increases export volume, and (ii) free trade of a good leads to increased productivity in the industry.
7 Aw et al. (Aw et al., 2000) measured productivity using a multilateral index, and Pavcnik (Pavcnik, 2002) used the Olley-Pakes method.
-5-
3
Methodology and data
3.1The empirical models
Our empirical analysis is based on the structure of the theoretical model built by CDK. CDK’s theoretical
model9 leads to empirical estimation using the following structural model.
log x δ δ τ θ log e ϵ (1)
i 1, ⋯ , Exporters; j 1, ⋯ , Importers; k 1, ⋯ , Industries; t 1, ⋯ , Time
where x is an export from country i to country j in industry k at time t; δ and δ are dummy
variables to indicate the ith exporter-jth importer and kth industry in jth importer; τ is a year-specific
dummy variable; and ϵ is an error term. x is the corrected export by import penetration ratio (IPR),
which is defined as 1 x / ∑ x . It is a fixed effect, and it captures any attribution between export
country i and import country j whose examples are provided by trade barriers. The other fixed effect, δ ,
captures any attribution of industry k in import country j, and its example is provided by policy barriers10
and/or preferences in industry k across import country j.
Our estimation model replaces the labor productivity in CDK’s model with environment-related efficiency. CDK assumes labor’s mobility across industries and immobility across countries. Similarly, we assume the same for the mobility of energy sources. Although our focus is not to defend this assumption, we see patterns of energy source mobility that support the implications of the assumption. For example, fossil fuel trade is restrained because of the destination clause, which prohibits a buyer from reselling crude oil and natural gas. Moreover, not all energy commodities are allowed to trade internationally.
In model (1), e expresses the efficiency in country i. The efficiencies that we focus on are energy
efficiency and pollution efficiency, which are energy consumption per production, carbon dioxide (CO2)
emissions per production, sulfur oxide (SOx) emissions per production and nitrogen oxide (NOx) emissions
per production in country i in industry k. We apply the energy intensity as a measure for energy efficiency,
and note the discussion on the difference on these two11. According to the estimate model, we empirically
analyze a parameter θ, which is an elasticity of an export with respect to the efficiencies, for exporting any
good k from country i to country j.
Improving environment-related efficiency depends on technological progress. Compared with CDK’s model, our model differs in that we consider the time effect as an underlying variable for progress. We, however, face difficulty in estimating our model because we need to estimate a fixed-effect model that
contains the two individual effects as well as the time effect using panel data that consists of three factors12.
Moreover, for the variables of individual effects, δ , δ and τ, in total, there are more than sixteen
9 See theorem 1 in CDK.
10 In a context of our analysis, effect of energy and environmental regulations on exports are captured by the variable, .
11 See EIA (EIA, 2000) for further discussion
-6- thousand dummy variables.
The estimation model in CDK corresponds to their theoretical framework, and the estimated parameters are structural. Hence, the time effect in our estimation model is not based on their theoretical consideration but captures the difference between time units, which is influenced by economic repercussions in response to local and global events.
Additionally, we consider a variation of model (1) in order to capture the individual effects, which is expressed,
log x ν τ ζ log e ϵ (2)
where ν represents one individual effect which means that an exporter i exports a good k, to a country j.
The individual effect in the model captures the circumstance of a trade between exporter i and importer j
in industry k and can be regarded as both δ and δ in model (1). Model (2) can be estimated with regular
panel data.
We consider two different models, one with the measures of environment-related efficiencies as the explanatory variable and the other with an additional labor-productivity-related variable. We provide the results of this alternative model in Appendix. A.
3.2Data
Our analysis uses two separate datasets, data on trade flow and data on the measures of environment-related efficiencies. Both required datasets can be acquired from the WIOD, which consists of four parts: the world input-output (IO) table, the national IO table, and socioeconomic and environmental satellite accounts. The world IO and the national IO are available for the period of 1995 to 2011, but the environmental-efficiency-related data are only available up to 2009; therefore, we limit our analysis to the period of 1995 to 2009.
Trade flow data are derived from the world IO table. We use the bilateral export of final private
consumption as the dependent variable. The bilateral exports are from 22 exporting countries i to each of
41 importing countries j for each of 20 industries k, which are equivalent to x in our empirical models.
Our selections of export countries i and industries k are listed in Table 1. Following CDK, we correct the
export data using IPR.
We measure the efficiencies across countries and industries using the world IO table and environmental
accounts. The environmental accounts include data on energy use and CO2, SOx, and NOx emissions at the
industry level. From energy use and the emissions data, we calculate the industry-level energy efficiency and pollution efficiency. These efficiencies are measured by the ratio of the value of energy use or emissions to total production by industry. An additional efficiency measure, namely, labor productivity, is used in our estimation, and we also use the variables from socioeconomic accounts. Labor productivity is calculated as the ratio of the labor force to the total output.
-7-
and an industry as 0 in our analysis. Figure 1 shows the relationship between the exports and the environment-related efficiency in 40 countries. The figure also indicates a positive correlation between the exports and the four efficiencies.
<Table 1> <Table 2> <Figure 1>
4
The results of the estimation Equation Section (Next)
We estimate the effect of environment-related efficiency on the trade patterns across countries and industries.
We focus on the parameters of θ and ζ, which represent an elasticity of export with respect to the
efficiencies.
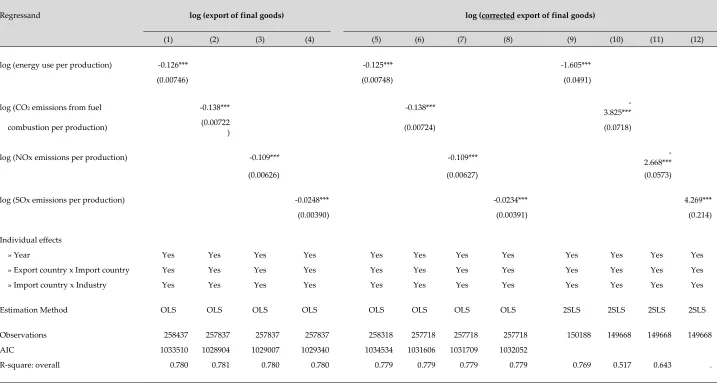
Table 3 reports the estimates of θ in model (1). Columns (1) to (4) show the results using bilateral export
data without adjustment by IPR, and the remaining columns show the results using the adjusted export data. According to the theoretical implication in CDK, when we use the adjusted bilateral export data, we expect the negative estimates to be negative, and we also expect smaller estimates compared with when we use unadjusted data. From the results, ceteris paribus, a one percent improvement in the efficiencies leads to an increase in exports in the range of approximately 0.025 to 3.83, and the estimates with adjusted bilateral exports are found to be slightly smaller than the estimates without the adjustment. The difference in magnitude in the treatments for the exports agrees with the finding of CDK.
There is a correlation between explanatory variables and error terms when we consider the relationship between more disaggregated firm- or plant-level exports and environment-related efficiency. The correlation causes simultaneous equation and attenuation biases, which are caused by a measurement error in the efficiencies and leads to the underestimation of the parameters. Although the simultaneous bias is a potential
concern for a relationship between unobserved firms’ internal productivity and factor endowments13, our
main question is the impacts of environment-related efficiency, not those of total factor productivity. To take the bias into account, model (1) is estimated using instrument variables for the endogenous
regressor, log e . A government generally makes different decisions from households and firms and
intervenes to improve efficiencies. We use the government expenditures, taxes and subsidies in the WIOD as
the instrument variables. Columns (9) to (12) in Table 3 show the instrument variable (IV) estimate of θ.
The impacts of energy use, CO2 emissions, and NOx emissions are negative and statistically significant, but
the θ of SOx emissions is opposite in sign. The magnitude of θ from the IV estimation is larger than that
of the estimates from OLS estimation. This difference is likely caused by the previously discussed attenuation bias.
The positive coefficient of SOx is not consistent with the theoretical consideration. The reason can be
-8-
derived from the cost of SOx emissions abatement and the limited market of the transboarder electricity transaction. SOx is mainly emitted in the electricity power generators where coal is burned (Shemwell et al., 2002), and the trade seems to be excessively concentrated in European countries. This may lead to the difference in the progress to take measures for SOx abatement across the countries. It is possible that the model can capture the relationship between SOx efficiency and export.
<Table 3>
The main result of this analysis is summarized in Columns (9) to (12) in Table 3. The magnitude of
estimated result is θ θ θ , and the coefficient of energy which is regarded as higher marginal
abatement cost results in the least values. From our findings, we can offer the empirical fact that the energy and environment efficiency in energy use, CO2 emissions, and NOx emissions may be a source of the comparative advantage in industries. However, we cannot show the relationship between the environment efficiency in SOx and the export performance. A possible reason is that major SOx emitter in industries is the electric power supplier and the international trade in the electricity has been concentrated in euprean market. In addition, there is the difference in costs of pollution management between SOx and NOx, and the
total cost to abate NOx emissions in the power plant is relatively expensive14. The high SOx pollution
management cost may cause regional gaps of SOx emissions reduction in European couties. These factors can obfuscate the structural effect of SOx on export performance across industries.
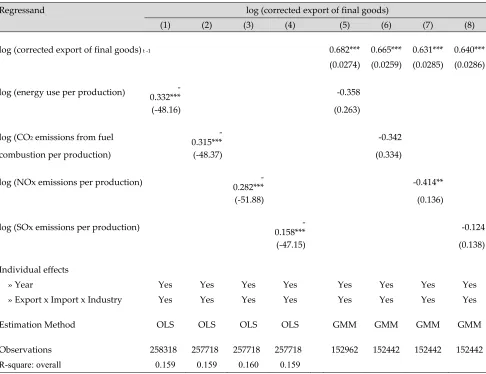
Table 4 reports the results of the model (2). Columns (1) to (4) show the results using fixed-effect models.
The impacts of energy efficiency and pollution efficiency, ζ, are larger compared with those in model (1).
Considering the endogeneity of the regressor, we estimate model (2) using a dynamic generalized method
of moments (GMM). When we compare columns (1) to (4) and (5) to (8), the magnitude of ζ with the
dynamic GMM is found to be larger. Both models (1) and (2) show the expected impacts of the efficiencies. <Table 4>
5
Impacts on industrial export performance
5.1Extension of the empirical model
The results of the environment-related efficiency show that the industries with higher efficiency tend to export more, but the estimated models do not take the differences in industrial efficiency into account. We further investigate the impacts of environment-related efficiency by industry because energy consumption and emissions depend partly on industrial characteristics. In the context of the environmental economics literature, the industrial characteristics of energy use are important issue for environmental regulations. Pollution-intensive industries may face high abatement costs and are more likely to be influenced by
-9-
economic regulatory instruments, such as environment taxes and other restrictions. Ederington et al. (2005) observe that the estimated average effect of abatement costs on all industries will lead to underestimation for some industries. Thus, given that we use the data of 20 different industries in this study, it is important to consider whether the impacts of environment-related efficiency differ by industry.
There are some reasons for which we expect industrial characteristics to affect relative energy efficiency. First, energy can be used as either a source of power or heat or as raw material. For example, petroleum can be used as a fuel in the form of gasoline, but it can also be used as a raw material in the petroleum chemical industry to produce vinyl and plastic. Even if both types of usage count as energy consumption, when the energy source is used as raw material, it is less likely to produce emissions.
Second, depending on the technology choice, the energy source and emission levels may vary. For example, the blast furnace is a conventional technology used in the iron and steel sectors. Furnaces use coke, but furnaces have been replaced by different technologies, such as direct-reduced iron, which uses natural gas. According to report by IEA (2010a), direct-reduced iron technology allows natural gas to replace coke as the main energy source in the iron and steel industry.
Third, the industries in energy-intensive sectors are more likely to be energy efficient because they utilize recovery technology to use the energy that is the by-product of their production processes as their power and heat sources. For example, coke oven gas in the steel and iron sector and refinery gas in the petroleum sector are generated from their production processes and are used as energy sources in the related production processes.
For a number of reasons, including the three points mentioned above, industry-specific technology and production processes influence environment-related efficiency. Thus, it is important to consider the industry-specific impact when we analyze the relationship between export performance and environment-related efficiency.
Additionally, we investigate the effect of environment-related efficiency by industry in each country. When we look at the same industry across different countries, we expect the impact of that industry’s environment-related efficiency to be roughly the same because the elemental technology in each industry is essentially the same across countries. Although we expect relatively constant results across countries by industry, there may be cases in which the effect of environment-related efficiency in a particular industry may differ visibly by country. We may observe such differences owing to variations in energy access because countries vary in their endowment of natural resources. A country in which energy resource endowment is scarce may use energy more efficiently, and a country with a relatively rich endowment of less pollution-intensive energy has relatively low abatement costs.
-10-
across countries, and some industries are legally allowed to opt out of the regulations to promote international competition.
In order to consider the environment-related efficiency by industry in detail, we use two separate models: one with an interaction variable between environment-related efficiency and industry dummies and the other with the additional triple interaction of environment-related efficiency, industry dummies, and country dummies.
log x δ δ τ θ log e δ δ δ θ ⋅ δ ⋅ log e ϵ (3)
where δ , δ and δ are dummy variables in the exporting country, importing country, and industry,
respectively. This model is based on model (1(3), and we add individual effects to it. An estimate of θ
θ captures the marginal contribution of efficiency to export performance across industry, and we regard it as
a measurement of the impact of each industry.
θ is one of the important parameters in CDK and measures intra-industry heterogeneity. In CDK, θ is
assumed to be constant across exporting countries and across industries. In contrast to CDK, we lift the
assumption of constant θ in our estimation models (3) and we let θ vary across industries. By allowing θ
to vary, there may be a concern that the estimation model calculates absolute rather than comparative advantage. However, a closer look at the model indicates that it can be used to calculate comparative advantage.
From our definition of environment-related efficiency, the ratio of the efficiency in exporting country ı̃
and i, ẽ ,/e ,, shows the extent to which exporting country i holds an absolute advantage in efficiency
related to country ı̃ in industry k. From the results of CDK, the relationship between export performance
and the absolute advantage of the efficiency in industry k is expressed as
log x
x ϑ log e
e ϑ log d
d (4)
where the ratio of e /e expresses the degree of the absolute advantage of the efficiency. The relationship
between export performance and the efficiency in (4) is for any importer j and any pair of exporters i, and
i but for the identical industry k. Hence, ϑ is an industry-specific impact of efficiency on export
-11-
log x δ δ τ θ log e δ δ δ θ log e ⋅ δ
θ ⋅ δ ⋅ δ ⋅ log e ϵ (5)
where δ, δ and δ are the same dummy variables as in model (3). θ in model (5) captures the
industry-specific impact of environment-related efficiency on trade performance across countries. The equation (4) is helpful to consider the industry-specific impact from model (5).
5.2Results of industrial performance
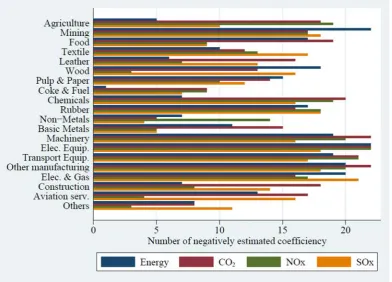
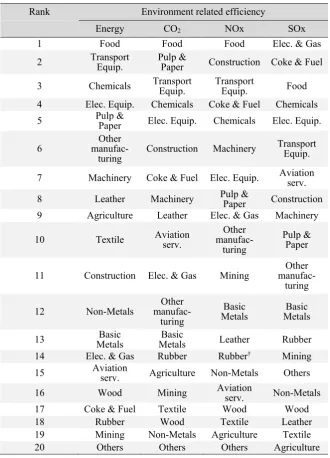
Table 5 shows the industrial rank order of a marginal impact of environment-related efficiency. This order is
based on the estimated θ θ in model (3) using the IV method. We are interested in the difference in
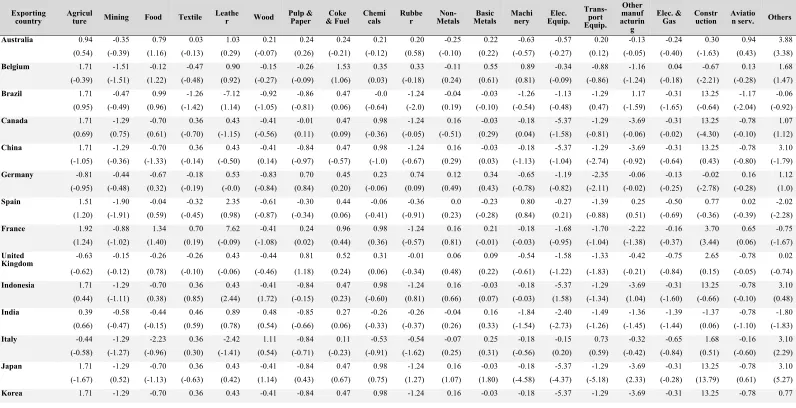
impact between industries, and we show the industries in descending order of impact because the estimation results cannot easily be read. Table 6 shows the industry-specific impact of energy efficiency on export
performance across countries. The number in the table is θ θ θ in model (5) and is equal to the
marginal impacts in each industry, which are divided into impact across countries. The sign of each marginal impact can be positive or negative, and a negative value indicates that more energy-efficient industries export more. Figure 2 describes the number of negative values of the marginal effects in environment-related efficiency.
The results of industrial impacts in Table 5 and Figure 2 have three features: 1) the top-ranked industries in Table 5 have more negative impact values across countries, 2) the industries that rank at the bottom have fewer negative values, and 3) the industries that are inversely related in ranking order have some negative impacts. The first and the second features are in line with expectations, but the third feature implies that country-specific factors influence particular industries.
From Table 5 and Figure 2, we find that the electric equipment and transport equipment industries are placed near the top of the ranking for all efficiency measures, and this result is robust when we look at the impact of environment-related efficiency on export performance by industry in each country. One possible explanation for why environment-related efficiency has a significant positive impact on the export performance of these industries is that these industries are highly competitive in the international market. Hence, a small difference in energy efficiency affects their performance. In other words, competition leads to high opportunity costs for not being energy efficient. Our result also shows that the food industry ranks in efficiency impact. Although the food industry is less susceptible to international competition compared with electric and transportation, the impact of efficiency on export performance may be strong because energy costs are a dominant cost factor and energy efficiency is key for business management in the industry (American Gas Funding, 2005; U.S. Environmental Proteciton Agency, 2007).
-12-
impacts vary across countries; they are sometimes positive and sometimes negative depending on the country. The reason we observe such variation in the impacts of low-ranked industries may be that these industries are what we often call the heavy industries, which heavily depend on natural resources.
The relatively lower ranked industries tend to share some characteristics of energy use and the international market. The iron and steel industry is ranked among the lower level group in all energy and environment efficiency in the result. China is the largest producer of the crude steel and followed by EU, Japan, and the US in order. It seems sure that the prominent difference in the stringency of environment regulation in China and developed countries (Botta and Koźluk, 2014). This implies that it is hard to shift the environment management cost on the product price, and the industry results in the lower level group.
China is also the largest exporter in the textiles and clothing and followed by EU and countries in the South-east Asia. The textile industry mainly uses electricity in the production process and relatively less pollution emitters compared to the energy intensive industry. Moreover, the industry tends to be labor intensive and then a relatively lower labor cost countries have an advantage in the production. The textile industries are a competitive market among competitors which involve producers with lower labor cost, and then the industries are conscious of the limited energy price change. The comparative advantage in the industrial production can be regarded as the country-specific factors which form into the key industry in a country, for example, economy, the technology level, and the available energy resources in a country. Thus the efficiency impacts depend on country-specific characteristics of energy source endowment.
<Table 5>
<Figure 2>
<Table 6>
6
Discussions
We find that environment-related efficiency explains the existence of comparative advantage in export performance. This implies that improved efficiency increases export performance. This result leads us to the next question: How do we increase environment-related efficiency given that increasing export performance is an important economic concern for countries? Although there are multiple ways to improve environment-related efficiency, we discuss two possible mechanisms.
One is improving the technology and labor skills that would contribute to increased energy efficiency in production processes. This could be accomplished through either government regulations and subsidies or voluntary efforts by firms themselves. Many countries address energy efficiency and climate change policy
(see the IEA `Policy and Measure Database’15), and they structure their regulations and economic policies to
meet certain goals and standards. Moreover, some empirical works show that environmental regulations enforced by governments improve firm performance (Lanoie et al., 2011; Rexhäuser and Rammer, 2014).
-13-
The migration of industries can achieve increases in average energy efficiencies in both developed and developing countries according to the assumption of the pollution haven hypothesis. The reason is that efficient industries migrate out of countries to avoid stringent environment regulations, and the average efficiency increases in the home country, where the industries with high environment-related efficiency can comply with more strict regulations. In contrast, however, those industries that migrated to the countries with relatively softer environmental regulations could have higher energy efficiency compared with the existing industries in the host countries. Therefore, the average efficiency can be increased in both countries.
Our analysis does not provide definite support for which mechanisms or what combinations of these mechanisms actually increase energy efficiency, but our results may provide some hints regarding what mechanisms lead to greater environment-related efficiencies. The results indicate that the positive impact of energy efficiency is larger in relatively mobile industries, such as electric and transport equipment, whereas the efficiency impact on export performance is low in relatively heavy industries. The top large firms in electric equipment and transport equipment, such as General Electrics, Samsung, Toyota and the other major companies, have built plants outside of their home countries. However, heavy industry by definition is energy-source-intensive and depends heavily on each country’s specific endowment of natural resources. Therefore, the firms in heavy industry are less mobile given that migration is limited by the availability of access to energy sources. This result may imply that migration is relevant when we consider the relationship between energy efficiency and export performance.
Finally, we consider the implication of energy and environmental policy from the results. The results show the possibility of the energy and environmental efficiency as well as the other costs to be a source of the comparative advantage in industries. There two implications on the energy and environmental policy. Firstly, the environmental regulation is fairly implemented to all regulated participants in the international trade market. Second, the efficient market of the energy and the technology to reduce environment pollution is developed globally, and, if necessary, government support and administer the market. It is inadequate that the positive relationship between environmental efficiency and exporting is disturbed in the market.
7
Concluding Remarks
We analyze the impact of energy and pollution efficiencies on export performance based on the recent trade theory by Costinot et al. (2012) using comparative industry-level data. The empirical results indicate that industries with higher energy and emission efficiency tend to export more. Our estimation shows that 1
percent decreases in energy consumption, CO2 emissions, and NOx emissions per unit of production lead to
1.6, 3.8, and 2.7 percent increases in exports, respectively.
-14- more on country-specific resource endowment.
These evidences illustrate that energy is an essential good for economic activities (Ozturk and Acaravci, 2013; Sadorsky, 2012b, 2011; Shahbaz et al., 2013b), but they seem to be hard to explain the structural mechanism of trade patterns to energy use. Our investigation can provide a suggestion on a relationship between international trade pattern and energy consumption across industries and countries. Our results show that the industrial sectors can have a comparative advantage at producing goods when they can produce them at less energy use. They are coherent to the classical trade theory. Our findings imply that it is possible that an industry to attain higher energy efficiency increases exports.
The related to our analysis is an elucidation of energy price and trade pattern, and Sato and Dechezleprêtre (2015) show the small impact of energy price on imports across 42 countries and 62 sectors. Their findings imply that domestic regulation on energy use, for example fossil fuel and carbon emissions tax, may lead to increase imports because of a decrease in domestic production and exports. A mechanism of their observed facts is that energy price affects cost functions of domestic goods and price of imported goods relatively declines. Most studies have indicated that energy price has an effect on production cost; an increasing in energy price induces to improve energy efficiency in order to save the energy cost. Our analysis to capture domestic regulations shows that it is possible to increase export from more efficient energy use under the regulations.
Given the indication that improving environment-related efficiency leads to increased export performance, it is in industries’ as well as governments’ interest to think about how to actually increase energy efficiency. Although there may be multiple ways to achieve this increase, we briefly highlight two possible mechanisms. One is by developing and applying related technology that leads to increased energy efficiency in production. This could be accomplished through either government regulations and subsidies or voluntary efforts by firms themselves. Secondly, average energy efficiencies can be increased by the migration of industries. According to the pollution haven hypothesis, industries with low energy efficiency migrate out of countries with more stringent regulations, and this migration increases the average energy efficiency those countries. In contrast, those industries that migrate to developing countries with relatively more lax environmental regulations could have higher energy efficiency compared with the existing industries in the host countries. Therefore, in both countries, average energy efficiencies can be increased through industry migration. As we discussed above, our results appear to imply that industry migration may be important when we consider the effect of energy efficiency on export performance. As for future research, it would be important to empirically analyze whether regulations and/or industry migration actually contribute to increasing energy efficiencies and thus lead to improved export performance.
Reference
American Gas Funding, 2005. Natural gas outlook to 2020.
-15-
Arce, G., López, L.A., Guan, D., 2016. Carbon emissions embodied in international trade: The post-China era. Appl. Energy. doi:10.1016/j.apenergy.2016.05.084
Aw, B.Y., Chung, S., Roberts, M.J., 2000. Productivity and Turnover in the Export Market: Micro-level Evidence from the Republic of Korea and Taiwan (China). World Bank Econ. Rev. 14, 65–90. doi:10.1093/wber/14.1.65
Beers, C. Van, Bergh, J. Van Den, 1997. An Empirical Multi-Country Analysis of the Impact of Environmental Regulations on Foreign Trade Flows. Kyklos 50, 29–46. doi:10.1111/1467-6435.00002
Bernard, A.B., Eaton, J., Jensen, J.B., Kortum, S., 2003. Plants and Productivity in International Trade. Am. Econ. Rev. 93, 1268–1290.
Bernard, A.B., Jensen, B., 1999. Exceptional exporter performance: cause, effect, or both? J. Int. Econ. 47, 1–25. doi:10.1016/S0022-1996(98)00027-0
Bernard, A.B., Wagner, J., 2001. Export entry and exit by German firms. Weltwirtsch. Arch. 137, 105– 123. doi:10.1007/BF02707602
Botta, E., Koźluk, T., 2014. Measuring Environmental Policy Stringency in OECD Countries (No. 1177), OECD Economics Department Working Papers. doi:10.1787/18151973
Carraro, C., Fay, M., Galeotti, M., 2014. Greening Economics: It is time.
Chua, S., 2003. Does tighter environmental policy lead to a comparative advantage in less polluting goods? Oxf. Econ. Pap. 55, 25–35. doi:10.1093/oep/55.1.25
Cole, M.A., Elliott, R.J.R., 2003. Determining the trade-environment composition effect: The role of capital, labor and environmental regulations. J. Environ. Econ. Manage. 46, 363–383. doi:10.1016/S0095-0696(03)00021-4
Costinot, A., Donaldson, D., Komunjer, I., 2012. What goods do countries trade? A quantitative exploration of Ricardo’s ideas. Rev. Econ. Stud. 79, 581–608. doi:10.1093/restud/rdr033
Costinot, A., Komunjer, I., 2008. What goods do countries trade ? A structural Ricardian model. Mimeo. Ederington, J., Levinson, A., Minier, J., 2005. Footloose and Pollution-Free. Rev. Econ. Stat. 87, 92–99. doi:10.1162/0034653053327658
Ederington, J., Minier, J., 2003. Is environmental policy a secondary trade barrier? An empirical analysis. Can. J. Econ. 36, 137–154. doi:10.1111/1540-5982.00007
EIA, 2000. Energy Efficiency Measurement Discussion [WWW Document]. EIA/DOE. URL http://www.eia.gov/emeu/efficiency/measure_discussion.htm#Energy Intensity as a Common Surrogate for Energy Efficiency (accessed 1.24.16).
Grossman, G., Krueger, A., 1991. Environmental Impacts of a North American Free Trade Agreement (techreport). doi:10.3386/w3914
Grossman, G.M., Krueger, A.B., 1995. Economic Growth and the Environment. Q. J. Econ. 110, 353– 377. doi:10.2307/2118443
-16- 2050. OECD/IEA, Paris.
International Energy Agency, 2010b. World energy outlook 2010. OECD/IEA, Paris.
Lanoie, P., Laurent-Lucchetti, J., Johnstone, N., Ambec, S., 2011. Environmental policy, innovation and performance: new insights on the Porter hypothesis. J. Econ. {&} Manag. Strateg. 20, 803–842. doi:10.1111/j.1530-9134.2011.00301.x
Levinson, A., Taylor, M.S., 2008. Unmasking the pollution haven effect. Int. Econ. Rev. (Philadelphia). 49, 223–254. doi:10.1111/j.1468-2354.2008.00478.x
Managi, S., Hibiki, A., Tsurumi, T., 2009. Does trade openness improve environmental quality? J. Environ. Econ. Manage. 58, 346–363. doi:10.1016/j.jeem.2009.04.008
May, G., Stahl, B., Taisch, M., 2016. Energy management in manufacturing: Toward eco-factories of the future – A focus group study. Appl. Energy 164, 628–638. doi:10.1016/j.apenergy.2015.11.044
McAusland, C., Millimet, D.L., 2013. Do national borders matter? Intranational trade, international trade, and the environment. J. Environ. Econ. Manage. 65, 411–437. doi:10.1016/j.jeem.2012.10.001
Meng, J., Liu, J., Guo, S., Huang, Y., Tao, S., 2015. The impact of domestic and foreign trade on energy-related PM emissions in Beijing. Appl. Energy. doi:10.1016/j.apenergy.2015.09.082
Olley, G.S., Pakes, A., 1996. The Dynamics of Productivity in the Telecommunications Equipment Industry. Econometrica 64, 1263–1297.
Ozturk, I., Acaravci, A., 2013. The long-run and causal analysis of energy, growth, openness and financial development on carbon emissions in Turkey. Energy Econ. 36, 262–267. doi:10.1016/j.eneco.2012.08.025
Palm, J., Thollander, P., 2010. An interdisciplinary perspective on industrial energy efficiency. Appl. Energy 87, 3255–3261. doi:10.1016/j.apenergy.2010.04.019
Pavcnik, N., 2002. Trade Liberalization, Exit, and Productivity Improvements: Evidence from Chilean Plants. Rev. Econ. Stud. 69, 245–276. doi:10.1111/1467-937x.00205
Rexhäuser, S., Rammer, C., 2014. Environmental Innovations and Firm Profitability: Unmasking the Porter Hypothesis. Environ. Resour. Econ. 57, 145–167. doi:10.1007/s10640-013-9671-x
Robison, H.D., 1988. Industrial Pollution Abatement: The Impact on Balance of Trade. Can. J. Econ. / Rev. Can. d’Economique 21, 187–199.
Sadorsky, P., 2011. Trade and energy consumption in the Middle East. Energy Econ. 33, 739–749. doi:10.1016/j.eneco.2010.12.012
Sadorsky, P., 2012a. Energy consumption, output and trade in South America. Energy Econ. 34, 476–488. doi:10.1016/j.eneco.2011.12.008
Sadorsky, P., 2012b. Energy consumption, output and trade in South America. Energy Econ. 34, 476–488. doi:10.1016/j.eneco.2011.12.008
Sato, M., Dechezleprêtre, A., 2015. Asymmetric industrial energy prices and international trade. Energy Econ. doi:10.1016/j.eneco.2015.08.020
-17-
growth, financial development and trade in China: Fresh evidence from multivariate framework analysis. Energy Econ. 40, 8–21. doi:10.1016/j.eneco.2013.06.006
Shahbaz, M., Khan, S., Tahir, M.I., 2013b. The dynamic links between energy consumption, economic growth, financial development and trade in China: Fresh evidence from multivariate framework analysis. Energy Econ. 40, 8–21. doi:10.1016/j.eneco.2013.06.006
Shemwell, B.E., Ergut, A., Levendis, Y.A., 2002. Economics of an Integrated Approach to Control SO 2 , NO x , HCl, and Particulate Emissions from Power Plants. J. Air Waste Manage. Assoc. 52, 521–534. doi:10.1080/10473289.2002.10470805
Tobey, J.A., 1990. The Effects of Domestic Environmental Policies on Patterns of World Trade: An Empirical Test. Kyklos 43, 191–209. doi:10.1111/j.1467-6435.1990.tb00207.x
Trianni, A., Cagno, E., Farné, S., 2016. Barriers, drivers and decision-making process for industrial energy efficiency: A broad study among manufacturing small and medium-sized enterprises. Appl. Energy 162, 1537–1551. doi:10.1016/j.apenergy.2015.02.078
U.S. Environmental Proteciton Agency, 2007. Energy trends in selected manufacturing sectors: Opportunities and challenges for environmentally preferable energy outcomes.
Xu, X., 1999. Do stringent environmental regulations reduce the international competitiveness of environmentally sensitive goods? A global perspective. World Dev. 27, 1215–1226. doi:10.1016/S0305-750X(99)00055-8
エラー! 参照元が見つかりません。エラー! 参照元が見つかりません。
Appendix
A.
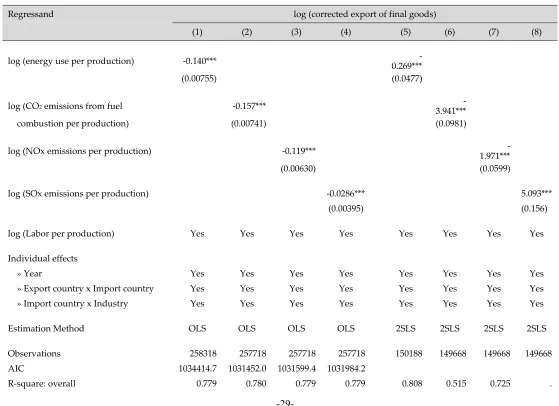
Labor productivity in estimated model
We consider a model with not only the environment-related efficiency variable but also the labor-productivity-related variable, which is considered to be influential in export performance. Our attempt is to
add labor productivity X into model (1), and the resulting estimation model is expressed as
x δ δ τ θ log e ξ log X ϵ (A.1)
i 1, ⋯ , Exporters; j 1, ⋯ , Importers; k 1, ⋯ , Industries; t 1, ⋯ , Time
where the variables except labor productivity are the same as those for model (1).
Table A 1 reports the estimate θ in this model, on which we focus as the impact of environment-related
efficiency on export performance. The estimates of θ and ξ are expected to carry the same negative sign
as in previous two models in this paper.
Compared with the estimated parameters in Table 3, there is little parameter change from the additional regressor. However, there are also different magnitudes of the estimated coefficient between OLS and IV in the table; the magnitudes using IV are greater than those from OLS. This casus of parameters is observed in
-18-
bias that is caused by a measurement error in efficiency. It is likely that efficiency as an exogenous variable leads to a bias that increases the magnitude.
Figures
Figure 1 Export and the energy use per production and pollution emissions per production Note: This plot depicts a relationship between the export and environment-related efficiency, which is measured
-19-
Figure 2 Number of negative impacts of the environment-related efficiency across country
Note: Negative impacts of the environment-related efficiency is equal to θ θ θ in model (5) which is
-20-
Table 1 Data source and description of data set.
Source World Input Output Database
http://www.wiod.org
Data
type World Input-Output Tables released November 2013 National Input-Output Tables released November 2013
Socio Economic Accounts released February 2012 Environmental Accounts released March 2012
Period From 1995 to 2009
Country Exporter Australia, Belgium, Brazil, Canada, China, Germany, Spain, France, United Kingdom, Indonesia, India (22) Italy, Japan, Korea, Mexico, Netherlands, Poland, Russia, Sweden, Turkey, Taiwan, and United States
Importer Exporters and Austria, Bulgaria, Cyprus, Czech Republic, Denmark, Estionia, Finland, Greece, Hungary, Ireland (41) Lithuania, Luxembourg, Latvia, Malta, Portugal, Romania, Slovak Republic, Slovenia, and Rest of the World
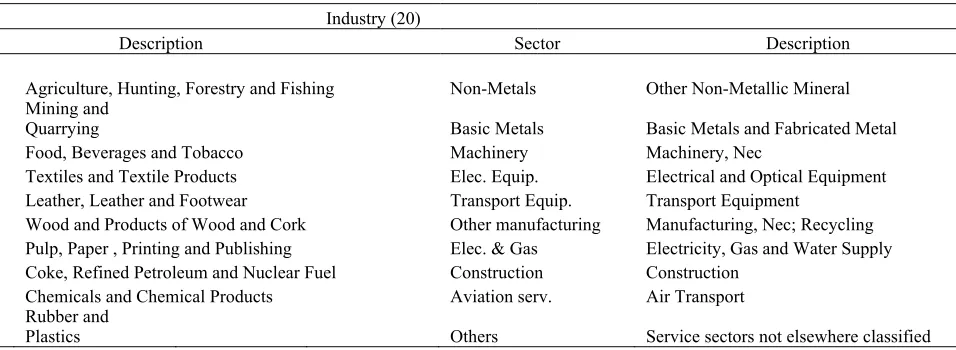
Industry (20)
Sector Description Sector Description
Agriculture Agriculture, Hunting, Forestry and Fishing Non-Metals Other Non-Metallic Mineral Mining Mining and Quarrying Basic Metals Basic Metals and Fabricated Metal Food Food, Beverages and Tobacco Machinery Machinery, Nec
Textile Textiles and Textile Products Elec. Equip. Electrical and Optical Equipment Leather Leather, Leather and Footwear Transport Equip. Transport Equipment
Wood Wood and Products of Wood and Cork Other manufacturing Manufacturing, Nec; Recycling Pulp & Paper Pulp, Paper , Printing and Publishing Elec. & Gas Electricity, Gas and Water Supply Coke & Fuel Coke, Refined Petroleum and Nuclear Fuel Construction Construction
Chemicals Chemicals and Chemical Products Aviation serv. Air Transport
-21-
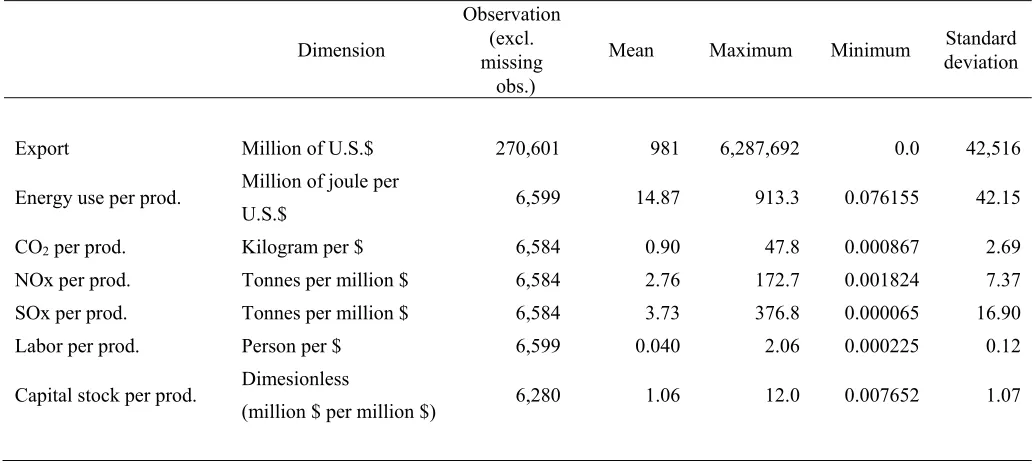
Table 2 Summary statistics.
Dimension
Observation (excl. missing
obs.)
Mean Maximum Minimum deviation Standard
Export Million of U.S.$ 270,601 981 6,287,692 0.0 42,516
Energy use per prod. Million of joule per
U.S.$ 6,599 14.87 913.3 0.076155 42.15
CO2 per prod. Kilogram per $ 6,584 0.90 47.8 0.000867 2.69
NOx per prod. Tonnes per million $ 6,584 2.76 172.7 0.001824 7.37
SOx per prod. Tonnes per million $ 6,584 3.73 376.8 0.000065 16.90
Labor per prod. Person per $ 6,599 0.040 2.06 0.000225 0.12
Capital stock per prod. Dimesionless
(million $ per million $) 6,280 1.06 12.0 0.007652 1.07
-22-
Table 3 Results of model (1).
Regressand log (export of final goods) log (corrected export of final goods)
(1) (2) (3) (4) (5) (6) (7) (8) (9) (10) (11) (12)
log (energy use per production) ‐0.126*** ‐0.125*** ‐1.605***
(0.00746) (0.00748) (0.0491)
log (CO2 emissions from fuel ‐0.138*** ‐0.138*** ‐
3.825***
combustion per production) (0.00722
) (0.00724) (0.0718)
log (NOx emissions per production) ‐0.109*** ‐0.109*** ‐
2.668***
(0.00626) (0.00627) (0.0573)
log (SOx emissions per production) ‐0.0248*** ‐0.0234*** 4.269***
(0.00390) (0.00391) (0.214)
Individual effects
» Year Yes Yes Yes Yes Yes Yes Yes Yes Yes Yes Yes Yes
» Export country x Import country Yes Yes Yes Yes Yes Yes Yes Yes Yes Yes Yes Yes
» Import country x Industry Yes Yes Yes Yes Yes Yes Yes Yes Yes Yes Yes Yes
Estimation Method OLS OLS OLS OLS OLS OLS OLS OLS 2SLS 2SLS 2SLS 2SLS
Observations 258437 257837 257837 257837 258318 257718 257718 257718 150188 149668 149668 149668
AIC 1033510 1028904 1029007 1029340 1034534 1031606 1031709 1032052
R‐square: overall 0.780 0.781 0.780 0.780 0.779 0.779 0.779 0.779 0.769 0.517 0.643 .
-23-
-24-
Table 4 Estimation results of the model (2).
Regressand log (corrected export of final goods)
(1) (2) (3) (4) (5) (6) (7) (8)
log (corrected export of final goods) t ‐1 0.682*** 0.665*** 0.631*** 0.640***
(0.0274) (0.0259) (0.0285) (0.0286)
log (energy use per production) ‐
0.332*** ‐0.358
(‐48.16) (0.263)
log (CO2 emissions from fuel ‐
0.315*** ‐0.342
combustion per production) (‐48.37) (0.334)
log (NOx emissions per production) ‐
0.282*** ‐0.414**
(‐51.88) (0.136)
log (SOx emissions per production) 0.158***‐ ‐0.124
(‐47.15) (0.138)
Individual effects
» Year Yes Yes Yes Yes Yes Yes Yes Yes
» Export x Import x Industry Yes Yes Yes Yes Yes Yes Yes Yes
Estimation Method OLS OLS OLS OLS GMM GMM GMM GMM
Observations 258318 257718 257718 257718 152962 152442 152442 152442
R-square: overall 0.159 0.159 0.160 0.159
-25-
-26-
Table 5 Industry ranking of environment-related efficiency impact on export performance.
Rank Environment related efficiency
Energy CO2 NOx SOx
1 Food Food Food Elec. & Gas
2 Transport Equip. Pulp & Paper Construction Coke & Fuel
3 Chemicals Transport Equip. Transport Equip. Food
4 Elec. Equip. Chemicals Coke & Fuel Chemicals
5 Pulp & Paper Elec. Equip. Chemicals Elec. Equip.
6 manufac-Other
turing Construction Machinery
Transport Equip.
7 Machinery Coke & Fuel Elec. Equip. Aviation serv.
8 Leather Machinery Pulp & Paper Construction
9 Agriculture Leather Elec. & Gas Machinery
10 Textile Aviation serv. manufac-Other
turing
Pulp & Paper
11 Construction Elec. & Gas Mining manufac-Other
turing
12 Non-Metals manufac-Other
turing
Basic
Metals Metals Basic
13 MetalsBasic MetalsBasic Leather Rubber
14 Elec. & Gas Rubber Rubber† Mining
15 Aviation serv. Agriculture Non-Metals Others
16 Wood Mining Aviation serv. Non-Metals
17 Coke & Fuel Textile Wood Wood
18 Rubber Wood Textile Leather
19 Mining Non-Metals Agriculture Textile
20 Others Others Others Agriculture
-27-
Table 6 Industry specific impact of energy efficiency on export performance by country.
Exporting
country Agriculture Mining Food Textile Leather Wood Pulp & Paper & Fuel Coke Chemicals Rubber Metals Non- Metals Basic Machinery Equip. Elec.
Trans-port Equip.
Other manuf acturin g
Elec. &
Gas Construction Aviation serv. Others
Australia 0.94 -0.35 0.79 0.03 1.03 0.21 0.24 0.24 0.21 0.20 -0.25 0.22 -0.63 -0.57 0.20 -0.13 -0.24 0.30 0.94 3.88
(0.54) (-0.39) (1.16) (-0.13) (0.29) (-0.07) (0.26) (-0.21) (-0.12) (0.58) (-0.10) (0.22) (-0.57) (-0.27) (0.12) (-0.05) (-0.40) (-1.63) (0.43) (3.38)
Belgium 1.71 -1.51 -0.12 -0.47 0.90 -0.15 -0.26 1.53 0.35 0.33 -0.11 0.55 0.89 -0.34 -0.88 -1.16 0.04 -0.67 0.13 1.68
(-0.39) (-1.51) (1.22) (-0.48) (0.92) (-0.27) (-0.09) (1.06) (0.03) (-0.18) (0.24) (0.61) (0.81) (-0.09) (-0.86) (-1.24) (-0.18) (-2.21) (-0.28) (1.47) Brazil 1.71 -0.47 0.99 -1.26 -7.12 -0.92 -0.86 0.47 -0.0 -1.24 -0.04 -0.03 -1.26 -1.13 -1.29 1.17 -0.31 13.25 -1.17 -0.06 (0.95) (-0.49) (0.96) (-1.42) (1.14) (-1.05) (-0.81) (0.06) (-0.64) (-2.0) (0.19) (-0.10) (-0.54) (-0.48) (0.47) (-1.59) (-1.65) (-0.64) (-2.04) (-0.92)
Canada 1.71 -1.29 -0.70 0.36 0.43 -0.41 -0.01 0.47 0.98 -1.24 0.16 -0.03 -0.18 -5.37 -1.29 -3.69 -0.31 13.25 -0.78 1.07
(0.69) (0.75) (0.61) (-0.70) (-1.15) (-0.56) (0.11) (0.09) (-0.36) (-0.05) (-0.51) (0.29) (0.04) (-1.58) (-0.81) (-0.06) (-0.02) (-4.30) (-0.10) (1.12)
China 1.71 -1.29 -0.70 0.36 0.43 -0.41 -0.84 0.47 0.98 -1.24 0.16 -0.03 -0.18 -5.37 -1.29 -3.69 -0.31 13.25 -0.78 3.10
(-1.05) (-0.36) (-1.33) (-0.14) (-0.50) (0.14) (-0.97) (-0.57) (-1.0) (-0.67) (0.29) (0.03) (-1.13) (-1.04) (-2.74) (-0.92) (-0.64) (0.43) (-0.80) (-1.79)
Germany -0.81 -0.44 -0.67 -0.18 0.53 -0.83 0.70 0.45 0.23 0.74 0.12 0.34 -0.65 -1.19 -2.35 -0.06 -0.13 -0.02 0.16 1.12
(-0.95) (-0.48) (0.32) (-0.19) (-0.0) (-0.84) (0.84) (0.20) (-0.06) (0.09) (0.49) (0.43) (-0.78) (-0.82) (-2.11) (-0.02) (-0.25) (-2.78) (-0.28) (1.0)
Spain 1.51 -1.90 -0.04 -0.32 2.35 -0.61 -0.30 0.44 -0.06 -0.36 0.0 -0.23 0.80 -0.27 -1.39 0.25 -0.50 0.77 0.02 -2.02
(1.20) (-1.91) (0.59) (-0.45) (0.98) (-0.87) (-0.34) (0.06) (-0.41) (-0.91) (0.23) (-0.28) (0.84) (0.21) (-0.88) (0.51) (-0.69) (-0.36) (-0.39) (-2.28)
France 1.92 -0.88 1.34 0.70 7.62 -0.41 0.24 0.96 0.98 -1.24 0.16 0.21 -0.18 -1.68 -1.70 -2.22 -0.16 3.70 0.65 -0.75
(1.24) (-1.02) (1.40) (0.19) (-0.09) (-1.08) (0.02) (0.44) (0.36) (-0.57) (0.81) (-0.01) (-0.03) (-0.95) (-1.04) (-1.38) (-0.37) (3.44) (0.06) (-1.67) United
Kingdom -0.63 -0.15 -0.26 -0.26 0.43 -0.44 0.81 0.52 0.31 -0.01 0.06 0.09 -0.54 -1.58 -1.33 -0.42 -0.75 2.65 -0.78 0.02
(-0.62) (-0.12) (0.78) (-0.10) (-0.06) (-0.46) (1.18) (0.24) (0.06) (-0.34) (0.48) (0.22) (-0.61) (-1.22) (-1.83) (-0.21) (-0.84) (0.15) (-0.05) (-0.74) Indonesia 1.71 -1.29 -0.70 0.36 0.43 -0.41 -0.84 0.47 0.98 -1.24 0.16 -0.03 -0.18 -5.37 -1.29 -3.69 -0.31 13.25 -0.78 3.10 (0.44) (-1.11) (0.38) (0.85) (2.44) (1.72) (-0.15) (0.23) (-0.60) (0.81) (0.66) (0.07) (-0.03) (1.58) (-1.34) (1.04) (-1.60) (-0.66) (-0.10) (0.48)
India 0.39 -0.58 -0.44 0.46 0.89 0.48 -0.85 0.27 -0.26 -0.26 -0.04 0.16 -1.84 -2.40 -1.49 -1.36 -1.39 -1.37 -0.78 -1.80
(0.66) (-0.47) (-0.15) (0.59) (0.78) (0.54) (-0.66) (0.06) (-0.33) (-0.37) (0.26) (0.33) (-1.54) (-2.73) (-1.26) (-1.45) (-1.44) (0.06) (-1.10) (-1.83)
Italy -0.44 -1.29 -2.23 0.36 -2.42 1.11 -0.84 0.11 -0.53 -0.54 -0.07 0.25 -0.18 -0.15 0.73 -0.32 -0.65 1.68 -0.16 3.10
(-0.58) (-1.27) (-0.96) (0.30) (-1.41) (0.54) (-0.71) (-0.23) (-0.91) (-1.62) (0.25) (0.31) (-0.56) (0.20) (0.59) (-0.42) (-0.84) (0.51) (-0.60) (2.29)
Japan 1.71 -1.29 -0.70 0.36 0.43 -0.41 -0.84 0.47 0.98 -1.24 0.16 -0.03 -0.18 -5.37 -1.29 -3.69 -0.31 13.25 -0.78 3.10
(-1.67) (0.52) (-1.13) (-0.63) (0.42) (1.14) (0.43) (0.67) (0.75) (1.27) (1.07) (1.80) (-4.58) (-4.37) (-5.18) (2.33) (-0.28) (13.79) (0.61) (5.27)
-28-
(-2.93) (-1.77) (-3.69) (-0.14) (-0.09) (-3.45) (-1.14) (-0.46) (-1.11) (-1.51) (-0.52) (0.0) (-0.51) (-1.69) (0.23) (-0.65) (-0.86) (-1.67) (-0.25) (-0.60) Mexico 0.41 -1.06 -0.19 -1.11 -1.32 -0.74 -0.74 0.26 -0.29 -0.15 -0.08 0.17 -1.64 -2.90 -3.28 -1.0 -0.50 -2.73 -0.53 0.98 (0.40) (-0.98) (0.56) (-1.0) (-1.91) (-0.73) (-0.53) (0.01) (-0.48) (-0.39) (0.25) (0.32) (-1.38) (-2.83) (-3.78) (-0.89) (-0.59) (-0.66) (-0.88) (1.22)
Netherlands 0.98 -0.27 1.35 -0.80 0.02 -0.41 0.82 0.66 0.35 0.54 0.16 0.55 0.90 -0.54 -0.10 -1.35 -0.24 -0.80 0.60 1.33
(0.98) (-0.23) (2.36) (-0.73) (0.13) (-0.21) (1.07) (0.47) (0.21) (-0.07) (0.67) (0.73) (0.98) (-0.41) (-0.18) (-2.21) (-0.36) (-2.04) (0.22) (1.49) Poland -0.33 -0.20 -0.79 -0.64 -0.46 0.20 -0.72 0.18 -0.56 -0.81 0.11 -0.08 -1.21 -0.83 -1.38 -1.02 -0.29 -0.83 -0.22 -0.71 (-0.48) (-0.24) (-0.44) (-0.75) (-0.84) (0.08) (-0.69) (-0.10) (-0.76) (-1.52) (0.31) (-0.06) (-1.32) (-0.70) (-1.57) (-1.23) (-0.43) (-2.89) (-0.71) (-0.82)
Russia 0.38 -1.29 0.04 -0.08 -0.07 -0.41 -0.84 0.47 0.09 -1.24 0.16 -0.03 -0.18 -5.37 0.04 -0.32 0.51 13.25 1.16 1.40
(0.03) (0.05) (-0.0) (-0.35) (-0.60) (-0.12) (0.07) (1.15) (-0.19) (-1.50) (0.02) (-0.54) (0.43) (0.17) (-0.57) (-0.75) (0.28) (1.51) (0.53) (1.08)
Sweden -1.55 -0.88 -1.84 -1.62 -0.86 -0.49 0.22 0.64 0.38 0.30 -0.30 0.04 -0.58 -1.18 -1.75 -0.21 -0.30 1.41 0.06 -0.53
(-1.56) (-0.84) (-0.51) (-1.52) (-1.11) (-0.52) (0.33) (0.27) (0.19) (-0.0) (0.16) (0.23) (-0.78) (-1.03) (-1.71) (0.04) (-0.38) (-1.01) (-0.38) (-0.14) Turkey 1.54 -1.23 -0.38 1.49 0.15 -0.16 -1.32 -0.01 -0.66 -0.20 0.51 0.02 -0.42 -0.27 -0.58 -0.88 -0.46 -1.94 -0.81 -7.11 (1.47) (-1.15) (0.49) (1.55) (-0.18) (-0.18) (-1.08) (-0.31) (-0.81) (-0.36) (0.89) (0.16) (-0.19) (-0.16) (-0.51) (-0.79) (-0.58) (-0.51) (-1.12) (-6.85)
Taiwan 1.71 -1.29 -0.70 0.36 0.43 -0.41 0.12 0.47 0.98 -1.24 0.16 -0.03 -0.18 -5.37 -1.29 -3.69 -0.31 13.25 0.30 -1.42
(-2.10) (-1.24) (-3.22) (-0.13) (0.70) (-0.32) (-0.21) (-0.44) (-0.65) (-1.81) (0.20) (0.48) (-0.34) (-3.07) (0.07) (-1.75) (-0.81) (4.75) (-0.09) (-1.98) United States 1.71 -1.29 -0.70 0.36 0.43 -0.41 -0.84 0.47 0.98 -1.24 0.16 -0.03 -0.18 -5.37 -1.29 -3.69 -0.31 13.25 -0.78 3.10 (0.49) (0.19) (0.28) (-0.49) (-1.51) (-0.55) (0.57) (0.47) (-0.07) (-0.63) (-0.08) (0.10) (0.79) (-1.99) (-0.37) (-0.14) (-0.41) (-0.48) (0.34) (1.03)
-29-
Table A 1 Two productivities using OLS and IV.
Regressand log (corrected export of final goods)
(1) (2) (3) (4) (5) (6) (7) (8)
log (energy use per production) ‐0.140*** 0.269***‐
(0.00755) (0.0477)
log (CO2 emissions from fuel ‐0.157*** ‐
3.941***
combustion per production) (0.00741) (0.0981)
log (NOx emissions per production) ‐0.119*** 1.971***‐
(0.00630) (0.0599)
log (SOx emissions per production) ‐0.0286*** 5.093***
(0.00395) (0.156)
log (Labor per production) Yes Yes Yes Yes Yes Yes Yes Yes
Individual effects
» Year Yes Yes Yes Yes Yes Yes Yes Yes
» Export country x Import country Yes Yes Yes Yes Yes Yes Yes Yes » Import country x Industry Yes Yes Yes Yes Yes Yes Yes Yes
Estimation Method OLS OLS OLS OLS 2SLS 2SLS 2SLS 2SLS
Observations 258318 257718 257718 257718 150188 149668 149668 149668 AIC 1034414.7 1031452.0 1031599.4 1031984.2
-30-