Comparison of Microstructure and Oxidation Behavior of CoNiCrAlY
Bond Coatings Prepared by Different Thermal Spray Processes
Mitsuhiro Shibata
1;*, Seiji Kuroda
1, Hideyuki Murakami
1, Machiko Ode
1,
Makoto Watanabe
1and Yukihiro Sakamoto
21National Institute for Material Science, Tsukuba 305-0047, Japan 2Chiba Institute of Technology, Narashino 275-0016, Japan
To protect various gas turbine components against high temperature in the hot sections of power generation plants and aircraft engines, thermal barrier coatings (TBCs) have been developed and widely used. Conventional TBCs consist of a MCrAlY bond coating for oxidation resistance and a ceramic top coating for thermal insulation. High quality coatings of MCrAlYs have been produced mostly by low pressure plasma spraying but other more economical processes are also used depending on the operating conditions of the component to be coated. In this study, CoNiCrAlY powders were deposited on Inconel 718 substrate with 3 types spraying system,i.e., low pressure plasma spraying, high velocity oxy-fuel spraying, and atmosphere plasma spraying. The specimens without top ceramic coating were isothermally tested for up to 100 hrs in air at 1373 K and mass gain of the coatings was measured. Microstructure of the coating cross sections and the surface oxides were observed with SEM. Moreover, phase changes during the oxidation test were investigated with calculated phase diagrams for the CoNiCrAlY alloy. [doi:10.2320/matertrans.47.1638]
(Received December 26, 2005; Accepted March 20, 2006; Published July 15, 2006)
Keywords: thermal barrier coating, bond coating, CoNiCrAlY, high temperature oxidation, high velocity oxy-fuel spray, low pressure plasma spray, phase diagram
1. Introduction
TBC (thermal barrier coating) systems with MCrAlY bond coatings and YSZ top coatings are widely applied to gas-turbine blades of power plants and aircraft engines for higher efficiency and long-term durability. MCrAlY bond coatings are one of the most important protective coatings applied against hot corrosion and high temperature oxidation.1)High quality coatings of MCrAlY alloys have been produced mostly by low pressure plasma spraying (LPPS). However, the chamber process of LPPS requires time-consuming evacuation and is expensive in capital costs.
Recently, high velocity oxy-fuel (HVOF) spraying has shown capability to make coatings of oxidation resistant alloys with a dense microstructure and relatively low oxygen content (typically less than 0.5 mass%). Therefore, it is of great industrial interests how such coatings perform because HVOF is relatively a lower cost process as compared to LPPS. Usually, TGO (thermally growth oxides) grow on the surface of a bond coating because gas turbine blades were exposed to the high temperature and severe oxidation atmospheres. It is desirable that these oxides are mainly constituted of stable-Al2O3. In the reality, however, TGO growth rate and composition on the bond coatings surface depend on the fabrication process of the bond coatings and the resultant microstructure and composition.2–16)
In a previous study, 3 types of spraying systems,i.e., low pressure plasma spraying (LPPS), high velocity oxy-fuel spraying (HVOF), and atmosphere plasma spraying (APS), were used to deposit MCrAlY coatings onto the substrate. Isothermal oxidation test at 1373 K, up to 100 hrs was carried out and the oxidation characteristics of each coating were studied.17)In the present study, changes in the microstructure
and phase composition of these coatings due to oxidation and diffusion were studied by using calculated phase dia-grams.
2. Experimental Procedure
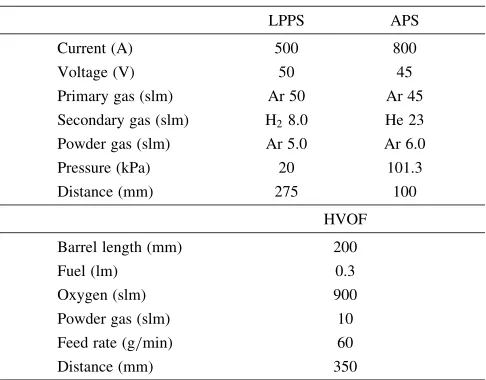
[image:1.595.306.549.593.783.2]Coatings were sprayed onto the substrates of Inconel 718, which were 25 mm in diameter and 3 mm thick. The spraying condition for each process is shown in Table 1. The nominal powder composition is Co32Ni21Cr8Al0.5Y. S-M9954 (Sulzer Metco, NY USA) was used for LPPS and APS, whereas CO-210-24 (Praxair, IN USA) was used for HVOF. The two powders are both gas-atomized and spherical but with slightly different size distributions; the average particle diameter as measured by a laser particle size analyzer (Microtrac HRA, PA, USA) is 22.3 and 24.5mmrespectively.
Table 1 List of spraying conditions.
LPPS APS
Current (A) 500 800
Voltage (V) 50 45
Primary gas (slm) Ar 50 Ar 45
Secondary gas (slm) H28.0 He 23
Powder gas (slm) Ar 5.0 Ar 6.0
Pressure (kPa) 20 101.3
Distance (mm) 275 100
HVOF
Barrel length (mm) 200
Fuel (lm) 0.3
Oxygen (slm) 900
Powder gas (slm) 10
Feed rate (g/min) 60
Distance (mm) 350
*Graduate Student, Chiba Institute of Technology Special Issue on Thermal Spraying
The oxygen contents of the powders were below 0.04 mass%. The spray conditions were selected based on several published reports18–23) and the standard conditions recom-mended by the manufacturers of the powder and the spray equipment. The thickness of the LPPS coating, HVOF coating and APS coating were 120, 90 and 100mm respec-tively. For oxidation test, specimens were isothermally held at 1373 K in static ambient air in the furnace for the duration time of 5, 25, 50, and 100 hrs respectively. Before and after each test, the weights of the specimens were measured to calculate the mass change. The details of specimen prepa-ration and the oxidation test were given elsewhere.17)
Surface and cross section of oxidized coatings were observed and analyzed by SEM. Oxygen content of as-sprayed coatings was analyzed by the inert gas fusion method. Inductively coupled plasma-atomic emission spec-troscopy (ICP-AES) technique was used to analyze other elements after a small amount of coating specimen was dissolved by aqua regia. Calculated pseudo-binary phase diagrams by using a commercial thermodynamics software Pan-Nickel (Multi-Component Phase Diagram Calculation Software Thermodynamic Database for Ni-Super alloys, Materials Design Technology Co. Ltd, Tokyo Japan) were used to investigate the phase changes in the coating during the oxidation test.
3. Results and Discussion
3.1 Structure of as-sprayed coatings
Cross sections of each as-sprayed coatings are shown in Fig. 1. The LPPS coating shows a very dense microstructure consisting of well-flattened particles, which indicates that the most of the powder particles were melted before deposition. Only a few pores are included in the coatings. The HVOF coating shows a relatively dense structure containing some unmelted thick particles and also a few pores included in the coatings. The APS coating shows most clearly the particle-particle boundaries and more pores because formed oxides on particle surface during spraying exist along the particle-particle boundary. The oxygen contents of the LPPS coating, HVOF coating and APS coating were 0.16, 0.94 and 1.8 mass% respectively. XRD of each as-sprayed coating re-vealed that only the HVOF coating contained a detectable amount of-NiAl phase. Therefore, the oxygen content and the microstructure of each as-sprayed coating were clearly different.
3.2 Results of oxidation tests
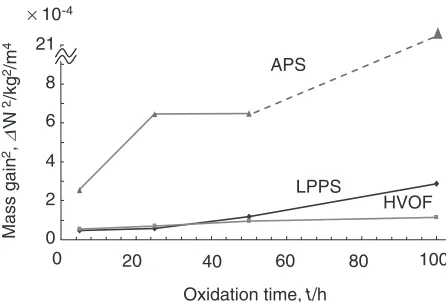
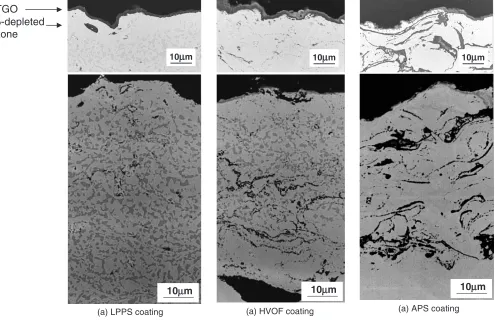
Figure 2 shows the mass gain history by the oxidation test. These points on the figure are squared specific mass change obtained by comparing the weight of a sample before and after the oxidation test divided by the specimen’s surface area. The LPPS and the HVOF coatings showed similar and low oxidation kinetics, but the APS coating showed a much more significant mass gain. As compared to published data of LPPS NiCrAlY coatings tested at 1323 K24) and HVOF NiCoCrAlY coatings tested at 1373 K,12) our weight gain results are essentially the same. LPPS and HVOF coatings of CoNiCrAlYRe tested at 1323 K were reported to result in about 50% smaller weight gains as compared to the present results after 100 hours.2)It must be noted that spallation of oxide scale from the surface of the specimens was not taken into account of the mass gain plotted. Surface observation with SEM revealed that significant spallation did not occur till 50 hrs of oxidation. After 100 hrs, however, it was ob-served that spallation occurred from a large area on both the LPPS and HVOF coatings. Figure 3 shows back scattered electron (BEI) images of the cross sections of each oxidized coating after 5 hrs. The 3 photos on the top were taken with a different contrast setting from these below in order to show the thermally grown oxide on the surface more clearly, whereas the lower photos were taken to show the internal phase structure more clearly. APS coatings contained many pores, which allowed oxygen to penetrate and form oxides within the coatings. But for the LPPS and HVOF coatings the images show that a continuous TGO grew on the surface,
coating
substrate
(a) LPPS coating (b) HVOF coating (c) APS coating
100µm 100µm 100µm
Fig. 1 Microstructures of each as-sprayed coating.
Mass gain
2,
∆
W
2/kg
2/m
4
Oxidation time, t/h 21
100 80
60 40
20
APS
LPPS
HVOF
0 8
6
4
2
0 × 10-4
[image:2.595.70.528.75.191.2] [image:2.595.314.537.240.391.2]which should be attributed to their dense microstructure and sufficient Al activity. Even though HVOF coating also included a small amount of pores in the as-sprayed condition, it appears that these pores were not connected to the surface of the coatings possibly because these fine pores closed due to the heat treatment at the high temperature.10)
To identify the oxides formed on the surface of each coating before and after oxidation tests, the sample surfaces were analyzed with XRD. For both the LPPS and HVOF coatings after oxidation of 100 hrs, XRD spectra showed strong peaks of-Al2O3and NiCo2O4spinel, weak peaks of NiO and very weak peaks of Cr2O3 whereas APS coating showed weak peaks of-Al2O3and strong peaks of the spinel oxide. It was observed that the spinel oxide covered uniformly on the -Al2O3 for the HVOF coating while the spinel formed islands on the-Al2O3for the LPPS coating.17)
3.3 Microstructural evolution during oxidation tests Two phases, namely-NiAl (dark grey) and Ni matrix -phase (light grey), were observed on the cross sections of the LPPS and HVOF coatings as shown in Fig. 3 after oxidation of 5 hrs. The -NiAl phase decreased with the increase in oxidation time. The APS coating did not exhibit the two-phase structure observed in the other two coatings. During the high temperature exposure, Al diffuses both to the TGO (thermally grown oxide) and to the substrate. The latter is due to the much lower Al content (less than 1%) of the substrate. As the Al concentration in the coatings decreases, thephase tends to dissolve. For this reason,-NiAl is often described
as an aluminum reservoir, and coating life is often discussed in terms of the depletion of phase. Table 2 shows the thickness of-NiAl depleted zone measured from the coating surface and the substrate surface in the LPPS and HVOF coatings. Thephase disappeared from the HVOF coating in a significantly shorter period, which is mostly due to the thinner thickness of the HVOF coatings (90mm) as compared to the LPPS coating (120mm).
Oxygen concentration in the as sprayed coatings was 0.16, 0.94 and 1.8 mass% for the LPPS, HVOF and APS coatings respectively. In HVOF and APS spraying, oxide films were formed during spraying on the surface of each sprayed powder particle and are embedded in the deposited coating. Such oxide films normally consist of various oxides of Al, Ni, Co, and Cr, because of the very short exposure to high temperatures in the spraying process. When heated to a high
10
10µm 1010µm 1010µm
(a) LPPS coating (a) HVOF coating (a) APS coating TGO
β-depleted zone
10µm 10µm 10µm
[image:3.595.53.548.74.396.2]Fig. 3 Microstructures of cross section of each oxidized coating (BEI image). The 3 photos on the top were taken with a different contrast setting from these below to elucidate the surface oxide layer and the internal phase structure respectively.
Table 2 Phase composition of as sprayed coating and thickness ofphase depletion zone as measured from the coating surface (upper row) and from the substrate (lower row) for each spraying process during oxidation.
(mm)
As-spray 5 h 25 h 50 h 100 h
LPPS 9.7 10 30
-16.5 34.3 46.5 disappeared
HVOF þ 9.5 -disappeared
23.5
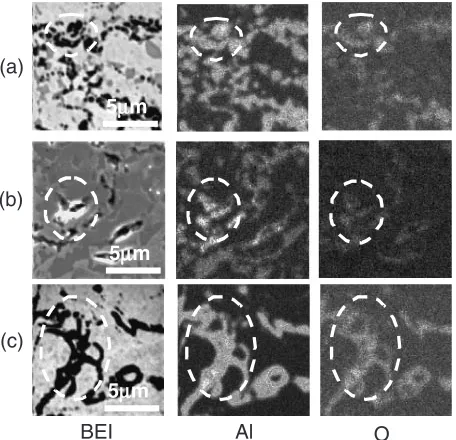
temperature, it is assumed that these oxides readily transform to the more stable oxide, i.e., alumina because of the difference in the formation free energy and the limited oxygen supply in the coatings. Results of mapping analysis by using EDX on the cross sections of each oxidized coating after 5 h are shown in Fig. 4. In each case, Al-rich oxides are identified where oxygen concentration is high, which confirms the conversion of the formed oxides during spraying to the Al-rich oxides within the coating at an early stage during the oxidation test. This should consume Al in the metallic matrix and the Al concentration in solid solution consequently decreases, the degree of which should be higher for coatings with higher oxygen concentration in the coating after spraying.
In order to understand the effects of Al depletion on the phase evolution of the CoNiCrAlY alloy, a pseudo-binary phase diagram for a system of 38.5Co-21Cr-Ni-Al as shown in Fig. 5 was calculated for the Al concentration range of from 0 to 20 mass%. Because of the lack of thermodynamics data for yttrium, 0.5 mass% Y was replaced by Ni for the calculation. The diagram shows that the original powder composition lies in theþtwo-phase region and the alloy will become a single-phase structure if Al concentration becomes less than 6.8 mass%. In the actual situation of Al depletion by oxidation as discussed so far, decrease in Al is not made up simply by increase in Ni but by increase in Co, Ni, and Cr while keeping their ratio unchanged. Therefore, the software was used to calculate the phase compositions for a range of Al concentration while as shown in Fig. 6. By assuming that oxygen in the coatings combines with aluminum to form alumina, available metallic Al concen-tration for diffusion at high temprature in each as-sprayed coating was calculated as given in Table 3 and shown as the vertical lines denoted as LPPS, HVOF and APS in Fig. 6. The numbers in parenthesis in Table 3 indicate the total amount of Al in the as-sprayed coatings determined by ICP-AES, from which the amounts of non-diffusible Al were
subtracted. It can be seen that the heavy oxidation of the APS coating during spraying depleted Al to an extent thatphase does not occur, which coincides with the experiment. For the LPPS and the HVOF coatings, measured amount ofphase from cross sectional BEI images are plotted in the figure. They are appreciably higher than the prediction for some reasons not clarified yet. The low Al concentration in the APS coating might be responsible for the loss of capability to form a protective-Al2O3scale at the high temperature exposure, which was exemplified by the formation of spinel oxides as identified by strong peaks in the XRD spectra in the previous study.17)
(a)
(b)
(c)
BEI Al O
5µm
5µm
5µm
Fig. 4 Oxides in the coatings detected by BEI and EDX mapping. (a) LPPS, (b) HVOF, and (C) APS.
Ni concentration, CNi /mass% Al concentration, CAl/mass%
5 0 500 600 700 800 900 1000 1100 1300 1400 1500 1600
15
10 20 25 30 35 40
0 5 10 15 20 25 30 35 40
liquid
β+γ γ
T
/
OC 1200
Fig. 5 Calculated pseudo-binary phase diagram for the CoNiCrAlY alloy.
Al concentration, CAl/mass%
Fraction (%)
(Co, Ni, Cr) concentration, C/mass%
Decrease Increase
8.8 6
10 12 14
18 7.5 4 2 0
20 100
16 80
10 20 30 40 50 90
0 70 60
Experimental β
LPPS γ
σ β
HVOF
APS
[image:4.595.56.284.72.292.2]Fig. 6 Calculated phase compositions for a range of Al concentration.
Table 3 Metallic Al concentration available for diffusion in each as-sprayed coating. The numbers in the parenthesis indicate the total amount of Al in the as-sprayed coatings.
Spraying system Al concentration (mass%)
LPPS 8.8 (9.0)
HVOF 7.5 (8.5)
[image:4.595.312.540.76.280.2] [image:4.595.314.541.334.484.2] [image:4.595.305.549.568.619.2]4. Conclusions
CoNiCrAlY bond coatings were sprayed by the APS, LPPS and HVOF thermal spray processes. Oxygen contents in the as-sprayed coatings were different (LPPS<
HVOFAPS), resulting in different aluminum concentra-tion that can diffuse in the alloy. Oxidaconcentra-tion mass gain of the HVOF CoNiCrAlY coatings in air at 1373 K was comparable to the LPPS coatings up to 100 hrs whereas the mass gain of the APS coatings was much greater because the APS coatings were porous and Al concentration was decreased due to the significant oxidation during spraying. Predicted change of phase fraction in these coatings generally agreed with the experimental observation, indicat-ing that Al concentration in the coatindicat-ing is the predominant parameter in determining the microstructure development during oxidation.
REFERENCES
1) J. A. Daleo, K. A. Ellison and D. H. Boone: J. Eng. Gas Turbines and Power124(2002) 571–579.
2) D. Toma, W. Brandl and U. Koster: Surf. Coat. Technol.120–121 (1999) 8–15.
3) E. Lugscheider, C. Herbst and L. Zhao: Surf. Coat. Technol.108–109 (1998) 16–23.
4) A. Scrivani, U. Bardi, L. Carrafiello, A. Lavacchi, F. Niccolai and G. Rizzi: J. Therm. Spray Technol.12(2003) 504.
5) G. Irons and V. Zanchuk:Thermal Spray Coatings: Research, Design and Applications, C. C. Berndt and T. F. Bernecki, Ed., June 7–11, 1993 (Anaheim, CA), (ASM International, 1993) pp. 7–11.
6) W. Brandl, D. Toma, J. Kruger, H. J. Grabke and G. Matthaus: Surf. Coat. Technol.94–95(1997) 21–26.
7) W. Brandl, D. Toma, J. Kruger, H. J. Grabke and G. Matthaus: Surf. Coat. Technol.188–189(2004) 20–26.
8) Kh. G. Schmitt-Thomas, H. Haindl and D. Fu: Surf. Coat. Technol.94–
95(1997) 149–154.
9) F. Tang, L. Ajdelsztajn, G. E. Kim, V. Provenzano and J. M. Schoenung: Surf. Coat. Technol.185(2004) 228–233.
10) Y. Itoh, M. Saitoh and M. Tamura: J. Eng. Gas Turbines and Power. 122(2000) 43–49.
11) L. Zhao, M. Parco and E. Lugscheider: Surf. Coat. Technol.184(2004) 298–306.
12) L. Zhao, M. Parco and E. Lugscheider: Surf. Coat. Technol.179(2004) 272–278.
13) Y. M. Yang, H. Liao and C. Coddet: J. Therm. Spray Technol.11 (2002) 36–43.
14) D. Toma, W. Brandl and U. Koster: Oxid. Met.53(2000) 125–137. 15) F. Tang, L. Ajdelsztajn and J. M. Schoenung: Oxid. Met.61(2004)
219–238.
16) J. A. Haynes, M. K. Ferber, W. D. Porter and E. D. Rigney: Oxid. Met. 52(1999) 31–76.
17) M. Shibata, S. Kuroda, M. Watanabe and Y. Sakamoto: Mater. Sc. Forum, in print.
18) K. Honda, I. Chiba, T. Fuse, T. Murakami and K. F. Kobayashi:
Thermal Spray: Practical Solutions for Engineering Problems, C. C. Berndt, Ed., Oct. 7–11, 1996 (Cincinnati, OH), (ASM International, 1996) pp. 405–411.
19) Z. Zhou, N. Eguch and A. Ohmori:Thermal Spray: A United Forum for Scientific and Technological Advances, C. C. Berndt, Ed., Sept. 15–18, 1997 (Indianapolis, IN), (ASM International, 1997) pp. 315–321. 20) K. Sonoya and S. Tobe: Thermal Spray: Surface Engineering via
Applied Research, C. C. Berndt, Ed., May 8–11, 2000 (Montre´al, Que´bec, Canada), (ASM International, 2000) pp. 1249–1253. 21) M. Tului, G. C. Gualco and R. Scarpellini:Thermal Spray: Surface
Engineering via Applied Research, C. C. Berndt, Ed., May 8–11, 2000 (Montre´al, Que´bec, Canada), (ASM International, 2000) pp. 1319– 1323.
22) S. Nuutinen, P. Vuoristo, S. Ahmaniemi, T. Mantyla and J. Takeuchi:
Thermal Spray 2001: New Surfaces for a New Millennium, C. C. Berndt, K. A. Khor and E. F. Lugscheider, Ed., May 28–30, 2001 (Singapore), (ASM International, 2001) pp. 661–670.
23) S. A. Tsipas, I. O. Golosnoy, R. Damani and T. W. Clyne: J. Therm. Spray Technol.13(2004) 370–376.