Computer Simulation of Phase Decomposition in Fe–Cu–Mn–Ni Quaternary Alloy
Based on the Phase-Field Method
Toshiyuki Koyama
*and Hidehiro Onodera
Computational Materials Science Center, National Institute for Materials Science, Tsukuba 305-0047, Japan
Recently, the phase-field method is becoming a powerful tool to simulate and predict complex microstructure evolutions in interdisciplinary fields of materials science. In this study, the phase-field simulations are demonstrated on the phase decomposition in the(bcc) phase during isothermal aging in Fe–Cu–Mn–Ni quaternary system, which is a base alloy system of the light-water reactor pressure vessel. Since the CALPHAD method based on a thermodynamic database of equilibrium phase diagrams is used for the evaluation of a chemical free energy in this simulation, the calculated microstructure changes are directly linked to the phase diagram of the Fe–Cu–Mn–Ni system. At the early stage of phase decomposition, the Cu-rich zone with bcc structure begins to nucleate, and the component X (¼Mn, Ni) is partitioned to the Cu-rich phase. When the Cu composition in the precipitate reaches almost the equilibrium value, the component X inside the precipitates moves to the interface region between the precipitate and the matrix. Finally, there appears the shell structure that the Cu precipitates are surrounded by the thin layer with high concentration of component X. This microstructure change is reasonably explained by considering the local equilibrium at the compositionally diffused interface region of Cu-rich nano-particles surface.
(Received December 20, 2004; Accepted February 7, 2005; Published June 15, 2005)
Keywords: phase-field method, phase transformation, phase decomposition, spinodal decomposition, reactor pressure vessel, diffusion equation
1. Introduction
During last decade, the phase-field method is becoming a powerful tool to simulate and predict complex microstructure evolutions in interdisciplinary fields of materials science.1–5) The objective of this study is to model the spinodal
decomposition of the (bcc) phase in Fe–Cu–Ni–Mn
quaternary alloy, which is a base alloy system of the light-water reactor pressure vessel, using the phase-field model-ing.6,7) The reason for the neutron irradiation induced
embrittlement8–11)of the light-water reactor pressure vessel
has been considered that the presence of the nano-scale copper precipitates and/or the point defect clusters formed during the neutron irradiation. They act as obstacles of the dislocation movement, resulting in the hardening of the materials. Therefore, the Cu-rich cluster formation and the role of solute elements such as Mn and Ni, which will effect on the formation and stability of the Cu-rich cluster, have been investigated in this alloy system. According to the experimental results of the three-dimensional atom probe analysis by Miller et al.,11) the Mn atoms segregate at the interface region between Cu-rich cluster and matrix. Re-cently, Seko et al.12) figured out the Ni atoms prefer to
segregate at the Cu-rich cluster surface on the basis of the atomistic theoretical calculation.
In this study, the behavior of the composition fields of the components Ni and Mn during spinodal decomposition in Fe–Cu–Ni–Mn quaternary alloy is investigated using the phase-field simulation, and the reason for the segregation of Ni and Mn atoms at the surface of the Cu-rich phase is discussed using the simulation results.
2. Calculation Method
Since we focus on the microstructure changes during the
diffusion-controlled phase decomposition in Fe–Cu–Ni–Mn quaternary alloy system in this simulation, the invariant variables describing the microstructure developments are the composition fields only, and therefore, the phase-field method used in this work is equivalent to the computer simulation based on the non-linear diffusion equation.13–15) The details of the non-linear diffusion equation and the evaluation of the total free energy of microstructure are described in the following sections.
2.1 Non-linear diffusion equation
The non-linear diffusion equations governing the phase decomposition in the Fe–Cu–Ni–Mn quaternary alloy system are written as
@c2ðr;tÞ
@t ¼M22r 2
2ðr;tÞ þM23r23ðr;tÞ
þM24r24ðr;tÞ;
@c3ðr;tÞ
@t ¼M32r 2
2ðr;tÞ þM33r23ðr;tÞ
þM34r24ðr;tÞ; ð1Þ
@c4ðr;tÞ
@t ¼M42r 2
2ðr;tÞ þM43r23ðr;tÞ
þM44r24ðr;tÞ;
where the local composition field of componenti,ciðr;tÞ, is a
function of the spatial position r and time t. The integer valuesi¼1, 2, 3, and 4 are corresponding to Fe, Cu, Mn, and Ni, respectively. Mi j is a dimensionless mobility of atom diffusion defined by
M22 ¼c02ð1c02Þ; M33¼c03ð1c03Þ;
M44 ¼c04ð1c04Þ; M23¼M32 ¼ c02c03;
M24 ¼M42¼ c02c04; M34 ¼M43¼ c03c04:
ð2Þ
From a physical point of view, the quantity Mi j should be functions of local composition and temperature, but we
*Corresponding auther, E-mail: [email protected]
Special Issue on Computer Modeling of Materials and Processes
assume Mi j are functions of average compositions c0i of componentiin eq. (2), for simplicity. Furthermore, since we simulate the isothermal phase decomposition only in the following,i.e.the aging temperature is constant, the depend-ence ofMi jon temperature is not considered explicitly. The
diffusion potential of componenti,iðr;tÞ, is calculated by
2ðr;tÞ
Gsys
c2 ¼
@Gc
@c2 cð2r 2c
2þ r2c3þ r2c4Þ;
3ðr;tÞ
Gsys
c3 ¼
@G
c
@c3 cðr
2c2þ2r2c3þ r2c4Þ; ð3Þ
4ðr;tÞ
Gsys
c4 ¼
@G
c
@c4 cðr
2c2þ r2c3þ2r2c4Þ;
Gsys¼
Z
r
ðGcþEsurfÞdr: ð4Þ
whereGsys is a total free energy of microstructure, which is
defined by a sum of the chemical free energy Gc and the composition gradient energyEsurf. The elastic strain energy is
ignored in this study for simplicity. Because we focus on the early stage of phase decomposition in this simulation, the elastic strain energy will crucially not influence on the behavior of microstructure changes. G
c is a Gibbs free
energy density of the (bcc) phase in Fe–Cu–Mn–Ni
quaternary system, and c is a composition gradient energy
coefficient that is assumed to be a constant in this work. Since
the CALPHAD method16)based on a thermodynamic
data-base of equilibrium phase diagrams is used for the evaluation of a chemical free energyGc, the calculated microstructure changes are directly linked to the phase diagram of the Fe– Cu–Mn–Ni system. The detail expression of the chemical free energy function and the composition gradient energy equation are explained in the next section.
2.2 Total free energy of microstructure
The chemical free energy (Gibbs free energy) of the
(bcc) phase in Fe-Cu-Mn-Ni quaternary system with mag-netic contribution is described by the sub-regular solution approximation,16)
Gcðci;TÞ ¼X
i
G
iciþ
EGþmgG
þRTX i
cilnci; ð5Þ
whereGi is the Gibbs energy of pure elementiin the case of the crystal structure is bcc, which is expressed as a function of temperature.17) EGis the excess free energy
correspond-ing to the heat of mixcorrespond-ing, and mgG is the magnetic
contribution to the Gibbs energy. R and T are the gas
constant and the absolute temperature, respectively. The functions ofEG andmgGare defined as
EGX
i X
j>i
Li;jcicjþX
i X
j>i X
k>j
Li;j;kcicjck; ð6Þ
mgGRTlnðþ1ÞfðÞ; T=T
C; ð7Þ
where the interaction parameters Li;j and Li;j;k, the Curie temperature TC, and the atomic magnetic moment are available from the thermodynamic database of equilibrium phase diagrams. These parameters for the Fe–Cu–Mn system have been determined by Miettinen,18)and ones for the Fe– Cu–Ni system are available from the SSOL database in
ThermoCalc,19)then we used the following data:
L1;2¼41033:06:022T;
ðL1;2¼39257:9764:1498304T: used only for the simulation of Fe{Cu{NiÞ
L1;3¼ 2759:0þ1:237T;
L1;4¼ 956:631:28726T
þ ð1789:031:92912TÞðc1c4Þ; ð8Þ
L2;3¼11190:06:0T9865:0ðc2c3Þ;
L2;4¼8366:0þ2:802T;
L3;4¼ 51638:31þ3:64Tþ6276:0ðc3c4Þ;
L1;2;3¼30000:0; L1;2;4¼L1;3;4¼L2;3;4¼0; ðJ/molÞ
TC¼1043c1580c3þ575c4þ123c1c3; ðKÞ
¼2:22c10:27c3þ0:85c4:
The functionfðÞin eq. (7) is given by Hillert and Jarl20)as a
function of:
fðÞ 11
D
791
140p þ
474 497
1
p1
3 6 þ 9 135þ 15 600
; ð1Þ;
fðÞ 1
D 5 10 þ 15 315 þ 25 1500
; ð1Þ; ð9Þ
D 518
1125þ 11692
15975 1
p1
;
ðp¼0:4 for bcc phase, andp¼0:28for othersÞ:
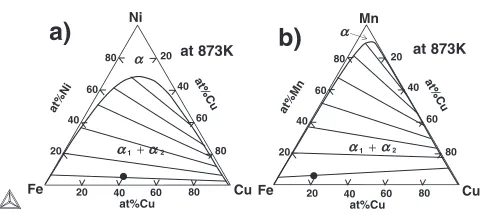
Figures 1(a) and (b) show the metastable phase diagrams calculated at 873 K under considering the(bcc) phase only in the Fe–Cu–Ni and Fe–Cu–Mn ternary alloy systems, respectively. It is noted that the (1þ2) two-phase region
of Fe–Cu binary phase diagram is extended with increasing Ni or Mn content. The average composition of the alloy used in the simulation is denoted by the solid circle. The thin straight lines inside the two-phase region are calculated tie lines.
The density of composition gradient energy,Esurf, of the
Fe–Cu–Mn–Ni quaternary system is expressed based on the spinodal theory developed by Cahn and Hilliard13,14)as
at%Ni at%Cu at%Cu 20 20 80 60 40 20 40 40 60 60 80 80 Fe Cu Ni at 873K 2 1 at%Mn at%Cu at%Cu 20 20 80 60 40 20 40 40 60 60 80 80 Fe Cu Mn at 873K
a)
b)
α+ 1+ 2
α
α α
α α
[image:2.595.307.548.651.758.2]Esurf¼ X
i
1 2cðrciÞ
2¼1
2c
X
i2 X
j2
ði jþ1ÞðrciÞðrcjÞ
¼cðrc2Þ2þcðrc3Þ2þcðrc4Þ2
þcðrc2Þðrc3Þ þcðrc2Þðrc4Þ þcðrc3Þðrc4Þ:
ð10Þ
The numerical value of the composition gradient energy coefficientcis taken asc¼1:01014 (Jm2/mol). This
value is roughly estimated using the relation,13) c¼
ð1=2Þd2, where is an interaction parameter between
atoms and we used ¼L
1;2ðT¼0KÞ ¼41033:0 (J/mol)
(see eq. (8)).d is an effective interaction distance11)and the value of which is assumed asd¼0:7(nm) that is about a half length of the interface region between the Cu-precipitate and the matrix.
3. Simulation Results
3.1 Two-dimensional simulation of isothermal phase decomposition
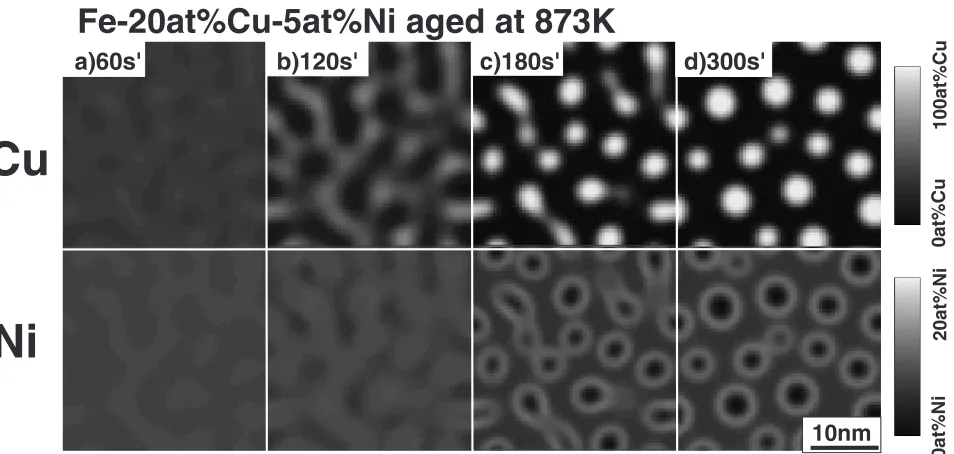
Figure 2 shows the two-dimensional simulation of the isothermal phase decomposition of the -bcc phase in Fe– 20 at%Cu–5 at%Ni ternary alloy at 873 K. The upper layer and the lower one in Fig. 2 indicate the Cu and Ni composition fields, respectively. The local composition is represented by gray scale, where the pure Cu and the 20 at%Ni are represented by white (see the gray scale at the right hand side of Fig. 2). The numerical values in Fig. 2 indicate the dimensionless normalized aging time (The unit ‘‘s0’’ means the dimensionless time). Figure 2(a) is the initial stage of the supersaturated solid solution where the small composition fluctuation is imposed followed by the Gaussian noise using the random number. At the early stage of aging (Fig. (b)), the Cu-rich zone is nucleated from the super-saturated solid solution, and the component Ni is mainly
partitioned to the Cu-rich phase. When the Cu composition in the precipitate reaches the equilibrium value (Fig. (c)), the component Ni inside the precipitates moves to the interface regions between the Cu-precipitate and the matrix. Finally, there appears the shell structure that the Cu precipitates are surrounded by the thin layer with high concentration of component Ni (Fig. (d)).
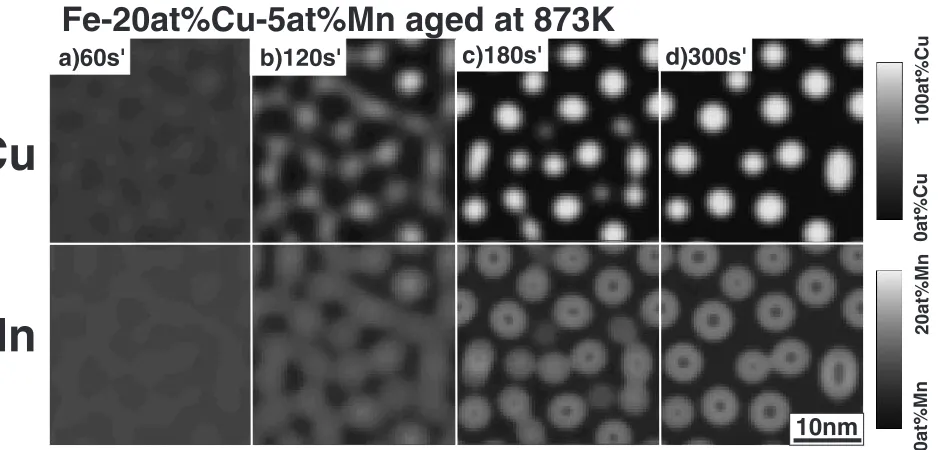
Figure 3 demonstrates the simulation of the isothermal phase decomposition of the -bcc phase in Fe–20 at%Cu– 5 at%Mn ternary alloy at 873 K. The drawing style of figure is the same as Fig. 2, and the upper layer and the lower one in Fig. 3 represent the Cu and Mn composition fields, respec-tively. At the initial stage of aging, the Cu-rich zone is nucleated, and Mn is mainly partitioned to the Cu-rich phase. When the Cu composition inside the precipitate increases, the component Mn starts moving toward the interface region. Finally, the shell structure also appears in this alloy. Comparing Fig. 2 and Fig. 3, we note the global micro-structure changes are almost the same, but the tendency of the segregation of Ni atoms at the surface of the Cu-rich phase is larger than that of Mn atoms.
Figure 4 shows the simulation for the isothermal phase
decomposition of the -bcc phase in Fe–20 at%Cu–
5 at%Mn–5 at%Ni quaternary alloy at 873 K. The upper, middle, and the lower layers indicate the Cu, Ni and Mn composition fields, respectively. The simulated microstruc-ture changes look like almost the combination between Fig. 2 and Fig. 3. At the early stage, the Cu-rich zone is nucleated from the super-saturated solid solution, and the components Ni and Mn are partitioned to the Cu-rich phase. With progress of aging, the components Ni and Mn inside the precipitates move to the interface region between the precipitate and matrix, then the shell structure appears. The tendency of the segregation of Ni atoms at the surface of Cu-rich phase is larger than that of Mn atoms, and the high Mn region is located inside the Ni-shell.
a)60s'
b)120s'
10nm
c)180s'
Cu
Ni
d)300s'
0at%Cu
100at%Cu
0at%Ni
20at%Ni
Fe-20at%Cu-5at%Ni aged at 873K
[image:3.595.63.540.526.753.2]3.2 Temporal changes of the composition profiles in Fe– Cu–Mn–Ni system
Figure 5 shows the one-dimensional simulation of the composition profile development in Fe–20 at%Cu–5 at%Mn– 5 at%Ni ally at 873 K. The vertical axis is a composition and the abscissa is a distance, and numerical value in each figure
is the dimensionless aging time. The thick, dotted, and thin curves correspond to the Cu, Mn, and Ni composition profiles, respectively. The Mn and Ni compositions are magnified by twice so as to see the segregation behavior easily. At the early stage of aging, the Cu-rich zone is nucleated and the components Mn and Ni are mainly
a)60s'
b)120s'
10nm
c)180s'
Cu
Mn
d)300s'
0at%Cu
100at%Cu
0at%Mn
20at%Mn
Fe-20at%Cu-5at%Mn aged at 873K
Fig. 3 Two-dimensional simulation of phase decomposition in Fe–20 at%Cu–5 at%Mn alloy at 873 K.
a)60s'
b)120s'
10nm
c)180s'
Cu
Mn
Ni
d)300s'
0at%Cu
100at%Cu
0at%Ni
20at%Ni
0at%Mn
20at%Mn
Fe-20at%Cu-5at%Mn-5at%Ni aged at 873K
[image:4.595.72.541.74.299.2] [image:4.595.58.542.343.676.2]partitioned to the Cu-rich phase (see the profile at 100 s0). When the Cu composition in the precipitate reaches almost the equilibrium value, the components Mn and Ni inside the precipitates move to the interface between the precipitate and matrix (see the profiles at 400 s0 and 2 ks0). In particular, Ni component starts moving faster than Mn. When we see the composition peak denoted by (A), which disappears by Ostwald ripening, the Ni and Mn compositions at the center of the precipitate gradually rise up during the Cu-particle resolving.
4. Discussion
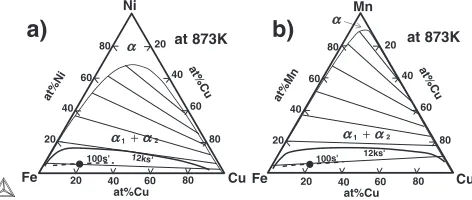
In this section, the reason for the segregation of Ni and Mn atoms at the surface of the Cu-rich phase is discussed. Using the simulation results of the composition profiles of Fig. 5, we can obtain the local composition value at each spatial point in the microstructure. Plotting the local composition given from Fig. 5 at t¼100s0 andt¼12ks0 on the phase diagrams, we are able to draw the dotted and solid curves inside the two-phase region of the phase diagrams (Fig. 6). The solid circle indicates the alloy composition. At the early stage of phase decomposition of t¼100s0 (see the dotted curves), the phase separation proceeds almost along the tie line direction. However, at the late stage of t¼12ks0, the trajectory of the composition profile on the phase diagram is deviated largely from the tie line (see the thick solid curves),
which corresponds to the segregation of both Ni and Mn atoms at the interface region,i.e.the composition of Ni and Mn takes high value when Cu composition is about 50 at%Cu that is almost the center of the interface region.
The reason why this segregation phenomenon is taken place is reasonably explained by considering the local equilibrium at the compositionally diffused interface region of Cu-rich nano-particles surface. Figure 7 shows the Gibbs energy surface plane of Fe–Cu–Ni ternary system at 873 K. When we look at the global shape of the free energy surface, there is a convex part at the Fe–Cu side and the convex produces a large driving force for the phase separation between Cu-rich phase and Fe-rich one. This driving force for phase separation decreases rapidly with increasing Ni content. The thick dotted curve denoted by (a) on the bottom plane is the thick solid curve in the two-phase region of the Fe–Cu–Ni phase diagram of Fig. 6(a). The thin dotted line denoted by (b) on the bottom plane is a tie line, and the solid circle is a position of the alloy composition. The thick solid curve (A) plots the trajectory along the curve (a) on the free energy surface, and the thin solid curve (B) on the free energy surface corresponds to the trajectory along the tie line (b).
If there is no segregation of Mn and Ni atoms at the interface region between the Cu-precipitate and the matrix, the trajectory of composition profile on the free energy surface should be along the tie line indicated as (B). But if the trajectory expands toward the Ni-rich side represented as (A), it is clearly understood that the case of (A) is energetically more stable than that of (B). Therefore, the reason why the solute elements Ni and Mn segregate at the interface region is that the composition profile is self-regulated so as to reduce the chemical free energy at the interface region of Cu-precipitate. Therefore, this is an origin for the shell micro-structure appearing. On the other hand, the atomistic qualitative explanation of this behavior is as follows: Since the interchange energy between Fe and Cu atoms is fairly large, the phase separation between Cu-rich phase and Fe-rich one is take place so as to reduce the number of the Fe–Cu bonding pare. However, the Fe–Cu pare exists inherently at the interface between matrix and precipitate. If Ni or Mn
Composition
Distance
Fe-20at%Cu-5at%Mn-5at%Ni aged at 873K
0 1 0 1 0 1 0 1 0 1 0 1 0 1 0 1 cCu Mn 2 10nm 20s' 100s' 400s' 2ks' 8ks' 10.6ks' 11ks' 12ks' Distance c cNi 2 (A)
Fig. 5 One-dimensional simulation of the temporal development of composition profiles in Fe–20 at%Cu–5 at%Mn–5 at%Ni alloy at 873 K.
at%Ni at%Cu at%Cu 20 20 80 60 40 20 40 40 60 60 80 80 Fe Cu Ni at 873K at%Mn at%Cu at%Cu 20 20 80 60 40 20 40 40 60 60 80 80 Fe Cu Mn at 873K
100s' 12ks' 100s' 12ks'
a)
b)
2 1+
α α α1+α2
α α
Fig. 6 The dotted curve and thick solid one inside the two-phase region are the trajectory of the composition profile at t¼100s0and t¼12ks0 in Fig. (5), respectively.
Cu
Fe
Ni
Chemical free ener
gy , -1 0 G /RT c
Fe-Cu-Ni at 873K
(a) (b) (B)
(A)
[image:5.595.311.542.73.241.2] [image:5.595.50.289.425.589.2] [image:5.595.52.288.647.747.2]atoms segregate at the interface region, the number of Fe–Cu pare will decrease, and the interchange energy of Fe–Ni or Fe–Mn pare takes negative value. Therefore, the segregation of Ni and Mn atoms at interface region lower the internal energy in the chemical free energy.
The above-mentioned segregation behavior seems to be a common phenomenon, when the third elements that has an ordering tendency with bulk component is added to binary alloy system that shows a large phase separation. For instance in the Al–Cu–Mg–Ag system, it is known that Mg and Ag atoms move to the surface region of Cu-zone at the later stage of phase decomposition.21) The similar mechanism may be applicable to this case.
5. Conclusions
The isothermal phase decomposition of the(bcc) phase in the Fe–Cu–Mn–Ni quaternary system was simulated on the basis of the phase-field method, and the segregation behavior of the Mn and Ni atoms is analyzed using the simulation result. The results obtained are as follows:
(1) At the initial stage of phase decomposition, Ni and Mn atoms are partitioned to the Cu-rich phase. When the Cu composition in the precipitate reaches the equilibrium value, the components Mn and Ni inside the precipitates moves to the interface region between the Cu-precip-itate and matrix. Finally, there appears the shell structure that the Cu precipitates are surrounded by the thin layer with high concentration of components Mn and Ni.
(2) The segregation tendency of Ni atoms at the surface of Cu-particles is larger than that of Mn.
(3) The shell structure of the Cu-particle appears because the composition profile is self-regulated so as to reduce the chemical free energy at the local interface region between precipitate and matrix.
Acknowledgements
This work was partly supported by a NEDO International
Joint Research Grant on ‘‘Structuring Knowledge, Science and Technology for Nano Material Processing’’ and ‘‘Nano-metal Technology Project’’, and by the Special Coordination Funds for Promoting Science and Technology on ‘‘Nano-hetero Metallic Materials’’ from the Ministry of Education, Culture, Sport, Science and Technology. This work was supported also by NAREGI Nanoscience Project; Ministry of Education, Culture, Sports, Science and Technology, and the CREST; Japan Science and Technology Agency.
REFERENCES
1) T. Koyama: Materia Japan (Bull. of the Japan Inst. Metals)42(2003) 397.
2) T. Koyama: Ferrum (Bulletin of The Iron and Steel Institute of Japan)
9(2004) 240, 301, 376, 497.
3) L.-Q. Chen: Annu. Rev. Mater. Res.32(2002) 113.
4) W. J. Boettinger, J. A. Warren, C. Beckermann and A. Karma: Annu. Rev. Mater. Res.32(2002) 163.
5) M. Ode, S. G. Kim and T. Suzuki: ISIJ Int.41(2001) 1076. 6) T. Koyama and H. Onodera: Mater. Trans.44(2003) 1523–1528. 7) T. Koyama and H. Onodera: Mater. Trans.44(2003) 2503–2508. 8) KINZOKU(Materials Science & Technology), AGNE GIJUTSU
CENTER,73(2003) 721–778.
9) M. K. Miller, P. Pareige and M. G. Burke: Mater. Charact.44(2000) 235.
10) Y. Nagai, T. Toyama, Z. Tang, M. Hasegawa, S. Yanagita, T. Ohkubo and K. Hono: Mater. Sci. Forum445–446(2004) 11.
11) M. K. Miller, B. D. Wirth and G. R. Odette: Mater. Sci. Eng. A353
(2003) 133.
12) A. Seko, N. Odagaki, S. R. Nishitani, I. Tanaka and H. Adachi: Mater. Trans.45(2004) 1978.
13) J. W. Cahn:The Selected Works of J. W. Cahn, ed. by W. C. Carter and W. C. Johnaon, (TMS, 1998) 29.
14) J. E. Hilliard: ‘‘Phase Transformation’’, ed. by H. I. Aaronson, (ASM, Metals Park, Ohio, 1970) 497–560.
15) T. Koyama and H. Onodera: Met. Mater. Int.10(2004) 321. 16) N. Saunders and A. P. Miodownik: ‘‘CALPHAD’’, (Pergamon, 1998). 17) A. T. Dinsdale: CALPHAD15(1991) 317.
18) J. Miettinen: Computer Coupling of Phase Diagrams and Thermo-chemistry27(2003) 141.
19) SSOL database in ‘‘ThermoCalc (ver.M)’’, Thermo-Calc Software AB. 20) M. Hillert and M. Jarl: CALPHAD2(1978) 227.