Munich Personal RePEc Archive
Evolution and Implementation of the
Rastra Program in Indonesia
Timmer, Peter C. and Hastuti, Hastuti and Sumarto,
Sudarno
Independent consultant, The SMERU Research Institute, The
SMERU Research Institute
11 August 2016
Online at
https://mpra.ub.uni-muenchen.de/81018/
Evolution and Implementation of the Rastra Program in Indonesia
C.Peter Timmer, Hastuti, and Sudarno Sumarto
Introduction
Among the countries reviewed in this volume, only Indonesia has not engaged in major reforms
of its food subsidy program, at least until recently. Its flagship food subsidy program Rastra,
formerly Raskin (Rice for the Poor),1 has made some improvements in delivery, but its overall
performance continues to be limited. As such, some rethinking of the business model as well as
the form of transfers provided is overdue.
Meanwhile, Indonesia has achieved significant progress in building and scaling up its
cash transfer programs. Reflecting the progress achieved, the government recently took
important steps toward reforming and modernizing Rastra. As this chapter shows, these steps are
in line with global trends in the evolution of food-based social assistance. However, the
international experience also suggests that such transitions will take time, will need to be
sustained politically, will need to go beyond Rastra itself, and will require revisiting both the role
of actors in different sectors and the objectives.
This chapter explores the history, design, implementation, and impact of Indonesia’s
experience with food-based social safety nets. That experience started well before the
implementation of Rastra—a program introduced after the Asian financial crisis in 1997–98 that
distributes rice directly to poor households at heavily subsidized prices. The chapter examines
basic food security to its citizens and the specific role of rice in it and (b) for clues that reveal the
underlying political economy of the programs’ design and implementation.
As illustrated in chapter 1 of this volume, until recently the nature and design of Rastra
had changed relatively little over time, but the program was, and largely still is, woven into a
broader set of agricultural and price management objectives. Indonesia’s approach to food
security is remarkably well studied and documented, from Dutch colonial days to the present.
However, the rich historical record, full of repeated food crises linked to institutional learning,
provides only limited insights into the future of food-based safety nets in the country. Indonesia
is attempting a radical reform of Rastra, including cashing out its benefits everywhere that food
(rice) markets are working reasonably effectively and leaving only isolated areas, mostly in
Eastern Indonesia, where the direct delivery of rice remains a cost-effective means of providing
food security to poor households.
Even in those circumstances, Rastra needs to be seen as part of a much broader array of
social safety nets. It has been understood for several decades that effective food policy—one that
is successful in reducing poverty and hunger to low levels within a generation—needs to employ
all the levers of economic development, not just those available to ministries of health or
agriculture.
The chapter reviews the history of Indonesia’s approach to food security for its citizens.
It focuses particularly on three basic ways to achieve that goal: (a) stabilizing rice prices,
especially in urban markets; (b) generating a widespread process of pro-poor growth that pulls
the rural poor into a rapidly expanding economy; and (c) providing direct food subsidies to poor
households, which it has pursued since 1998 through Rastra. The first half of the chapter lays out
implementation, and impact of Rastra as of early 2017 and discusses briefly the most recent
pilots to reform it. A final section discusses the lessons learned.
The Historical Origins of Rastra
Guaranteeing that food is available on a reliable and regular basis to all citizens is part of the
“mandate of heaven” under which all Asian rulers are empowered, whether democratic or
authoritarian.2 Indonesia is no exception. Its rulers have tried to maintain ready access to
affordable rice since at least the seventeenth century. For most of the nation’s history, the main
social safety net in Indonesia has been a public guarantee that rice would be available in urban
markets at affordable (and stable) prices. If some citizens were too poor to buy this
market-priced rice, they suffered, or they were helped by local community organizations. When the state
failed in this obligation, it often lost power.
That pattern is centuries old throughout Asia, but it would have resulted in food security
for only a minority of urban households unless further steps were taken. Several possible
approaches could extend the paradigm of food security in Asia. One approach is to achieve
widespread, inclusive economic growth that brings the great mass of the population above a
meaningful poverty line, so that stable rice prices in key urban markets really do guarantee food
security for an increasing share of the population (as many rural workers move to urban jobs).
Two reinforcing factors would eliminate rural poverty: people would migrate to urban
opportunities, and the state would stimulate farm incomes for the remaining rural population by
maintaining higher commodity prices. That approach is widespread in all high-income countries
and is a popular political strategy that has uniformly been rewarded by electoral success for
middle class that willingly pays higher food prices and (b) a progressively smaller and more
productive agricultural workforce.
A second approach is to protect agriculture much earlier in the historical process of
structural transformation, when farmers (especially, in Asia, rice farmers) become a very potent
voting bloc in newly formed democratic societies. Many poor households remain—in both rural
and urban areas—but they are not numerous enough to outvote a coalition of urban middle-class
households, which want to guarantee supplies of rice in their local markets, and of farmers, who
want higher rice prices to compensate for the loss of economic competitiveness in the production
of labor-intensive crops (especially rice). This is the Indonesian story, but it also resonates in
Malaysia, Thailand, and even China.
How can politicians reconcile rice prices that are high enough to ensure food security
through increased rice production with the existence of a substantial proportion of households
that are unable to afford that rice? The answer is obvious, both politically and logistically.
Distributing rice directly to poor households (despite how ineffective the actual delivery system
might be) is a political winner. And for the food logistics agency, previously charged with
stabilizing rice prices around long-run trends in world prices, the reality of high domestic rice
prices sharply reduces the need for those services. A new mandate—to procure rice at high prices
from farmers and deliver it at subsidized prices to poor households—gives that agency a new
lease on life.
This approach, established for the last decades as the political norm in Indonesia, was an
innovation when viewed through the lens of Indonesia’s long history of repeated food crises and
government responses. A slightly arbitrary list of 10 food crises over several centuries is
been the dominant policy goal, sometimes sacrificing the short-run welfare of farmers in favor of
the welfare of consumers and sometimes the opposite. In all the crises, however, institutional
learning occurred, as coping mechanisms developed to keep governments in power. The
following 10 crises shaped Indonesia’s approach to food security.
First, the Indonesian sultanates rule with a “mandate from heaven,” known as “rice for
the people.” Sultan Amangkurat I prohibited the exportation of rice from Java in 1655 in
response to a drought that sent rice prices up by 300 percent.
Second, the Dutch took over the rice economy of the Netherlands East Indies in March
1933, in response to collapsing rice prices in the region. Rice milling, inter-island and
international trade in rice, and price formation were all tightly controlled by government
agencies, most of them newly formed for the task (Boeke 1946). The Dutch effort at government
control of the rice economy resonates to this day.
Third, the collapse of the Sukarno government in 1966, after a decade of spiraling
inflation, increased poverty, and repeated shortages of rice in urban markets, gave the new
Suharto government a mandate for stability—a mandate it eagerly sought in the wake of
widespread violence and turmoil during the transition. Badan Urusan Logistik (BULOG, the
State Logistics Board) is a food logistics agency established to control rice prices, with an
agency head who reported directly to the president and with a line of credit at subsidized interest
rates from the central bank.
Fourth, the world food crisis in 1972–73 caught the Indonesian government—and
BULOG—unprepared. After several years of price stability, rice prices spiraled out of control,
and the government quickly tried to arrange emergency imports from a world rice market that
formulate plans for paying greater attention to agricultural development, increasing productivity
of the rice sector, and keeping rice prices stable (Timmer 1975).
The fifth food crisis followed the collapse of commodity prices in world markets in the
mid-1980s, including for rice, and again caught BULOG unprepared. As the Dutch learned
during the Great Depression in the 1930s, surpluses are just as hard to manage as shortages. A
major reevaluation of how to define and maintain food security in Indonesia was commissioned.3
A new focus on poverty came to the fore with the realization that surplus rice could be
distributed as part of a social safety net. By 1991, BULOG had implemented a trial of Operasi
Pasar Khusus (OPK, Special Market Operations) to deliver rice directly to drought-stricken
villages as a poverty-relief effort (Timmer and others 1992).
In the sixth crisis, BULOG’s focus on disposing of rice surpluses caused it to lose track
of its actual stock in mid-1994. A drought caused rice production to fall, but BULOG did not
respond when stocks were depleted early in 1995, before the new rice harvest started in March.
A rice crisis was in the making. President Suharto replaced the head of BULOG, and the new
head ordered emergency imports that arrived just in time to keep rice prices from getting out of
control. Knowing what to do makes all the difference, but business as usual was a failure. Still,
by August 1996, it was possible for the Jakarta Post to report a story (based on an interview with
Timmer) that headlined “BULOG to limit itself to poverty alleviation,” a recognition of the
changing dynamics in the rice economy.
Seventh, the Asian financial crisis in 1997–98 caused Indonesia to lose control of its
macroeconomy. Again, an important lesson was learned: it is impossible to stabilize rice prices
macroeconomic and political chaos. This program almost immediately became the largest
element in the country’s shift to targeted social safety nets (Tabor and Sawit 2001).
Eighth, with the emergence of democracy in 1998, the political economy of food security
took an entirely new direction. The dominant approach was to impose high rice prices as a
political policy choice in 2004–06, which had a significant impact on the poor. Rastra, which
was the OPK program relabeled, became the political answer to the problems of food insecurity
caused by high rice prices. Although rice self-sufficiency had long been a key objective of
Indonesia’s drive for food security, stable rice prices had always trumped the desire to restrict
imports (Timmer 2003). That political calculus changed in the first half of the 2000s.
Ninth, Indonesia was quite successful in getting through the 2007–08 world food crisis,
partly because its domestic prices were already high. When the minister of trade announced a
ban on rice exports early in 2008, the world rice market took little notice because Indonesia had
never been a significant rice exporter. But domestic consumers and traders were reassured that
ample supplies were available, so there was no panicked hoarding of the sort seen in the
Philippines and even in urban markets in Vietnam. Stable domestic prices, even if very high,
were a political winner for Susilo Bambang Yudhoyono’s second presidential campaign in 2009.
Tenth, BULOG faced rice shortages in 2015–16, the worst El Niño year on record. Some
officials in the new Jokowi government tried to order imports in a timely fashion, even recalling
publicly the fall of the Suharto government over spiraling rice prices during the previously worst
El Niño on record in 1997–98, when imports also were delayed. Many contracts were delayed or
canceled (although nearly 1 million tons of imported rice did arrive before the end of February
2016). Rice prices spiraled, BULOG had to cut back deliveries to Rastra recipients, and once
Rastra, even to convert it to cash or vouchers in urban settings and rural areas with good market
infrastructure, were generally delayed, although they are now being tested in several cities.
Crises focus the mind and political action. Perhaps more important, they shape the
expectations—among the citizenry and policy makers alike—about appropriate public actions
and private responses in a highly volatile food system. Interpreting the long-run impact of these
repeated food crises over nearly four centuries of Indonesian history is a matter of judgment, of
course, but at least three phases are visible in the evolution of policy approaches to food security.
First, stabilizing rice prices in urban markets has long been the political touchstone of
legitimacy: a reasonably stable food economy seems to be an essential ingredient of sustainable
economic growth. Second, a strategy of pro-poor growth, building on the potential to improve
rural labor productivity through broad-based agricultural development, brought the rural poor
into the political calculus of food security (and their participation made food more available and
accessible). And third, perhaps prematurely, the country moved explicitly to a targeted,
food-based social safety net—implemented through Rastra—as the offset to a political strategy of
wooing the political loyalty of rice farmers by keeping rice prices high. Each of these phases is
discussed in turn.
Phase 1: Rice Price Stabilization in Indonesia
Why did Indonesia attempt to stabilize rice prices for extended periods of time? No one in
Indonesia—policy makers, academics, journalists, or the “man in the street”—has ever doubted
that stable rice prices are essential to political stability and economic growth. During the chaotic
influential student newspaper Harian KAMI put it on September 14, 1967, “the barometer of the
economy.”
The Motivation for Rice Price Stabilization in Indonesia: A Brief Overview
Food security as a political concept requires an operational definition.4 In most Asian countries
the definition has taken the form of stable domestic prices relative to world prices, thus requiring
state control over trade flows in rice. To minimize the need to resort to trade at all and to avoid
the uncertainties in the international price of rice, self-sufficiency has also become a popular
objective. It has become more important as countries have become rich enough to implement
policies that achieve greater degrees of self-sufficiency.
A further impetus toward greater domestic rice production has been the fear of food
shortages in urban areas, which evoke a universal and visceral reaction. Governments are held
accountable for provisioning cities at reasonable costs, and citizens have repeatedly
demonstrated their capacity to bring down governments that fail in this obligation.5 Acute food
shortages—not the average level of food prices—are what induce antigovernment panic,
however. Sharp price rises are simply the mirror image of food shortages.
Indonesia provides a particularly vivid case study of policy initiatives that are designed
specifically to stabilize the domestic price of rice—using imports or domestic production to
avoid food shortages—with a careful analytical debate paralleling the policy actions. The role of
trade versus domestic production as the basis for food security has been analyzed and discussed
in a surprisingly open and articulate manner since the beginning of the Suharto government in
1966.
The proximate definition of food security in Indonesia has always revolved around price
underpinned this approach never focused only on the static and partial equilibrium consequences
of changes in rice prices. Instead, an effort was made, even well before computable general
equilibrium models became a standard tool of policy analysis, to consider the dynamic and
economywide ramifications of price policy, the distributional consequences for farmers and
consumers, and the role of other commodities in the rice stabilization program.
The Role of Self-Sufficiency in Rice in Ensuring Food Security
Self-sufficiency in rice and other foodstuffs such as sugar and soybeans has been a consistent (if
often rhetorical) objective of Indonesian agricultural policy since the beginning of the New
Order regime of President Suharto in 1967 (Timmer 1975). Historical and production cost data
based on farm surveys suggest that self-sufficiency in rice has often been less costly (on average
and over the long run) than large-scale rice imports from the world market, at least when the
green revolution in rice production technology was spreading rapidly. Because of fluctuations
due to weather (especially El Niño events), diseases, and pests, however, rice production in
Indonesia is unstable, and productivity growth has slowed. In most years, Indonesia’s rice
production is below the normal level of rice consumption.
To stabilize the rice economy, BULOG was charged with operating a floor and ceiling
price policy using domestic buffer stocks to smooth out year-to-year fluctuations in production
and consumption. The goal was to keep rice consumption on a smooth trend despite unstable
production. The primary policy instrument for stabilizing rice consumption is the stabilization of
rice prices,which has been BULOG’s most important task.6
Successful stabilization of rice prices between policy-determined floor and ceiling prices
requires an active and ongoing analytical capacity—to determine annually the appropriate
developed this capacity gradually through the early 1970s and 1980s. Much of that analytical
effort is now in the public record.7
From the late 1960s until the early 1980s, BULOG routinely used imports and
open-market sales of rice to balance supply and demand in its defense of a floor and ceiling price for
rice. The world food crisis in 1972–73 stimulated serious efforts to increase rice production, and
the long-sought goal of rice self-sufficiency was achieved in the mid-1980s. The balancing role
of international trade was superseded by the problems of managing domestic buffer stocks as the
sole mechanism for smoothing seasonal and annual differences between production and
consumption (Timmer 1996).8
For the 10 years of the fourth and fifth five-year development plans (Repelita IV and V),
fiscal years 1983/84 to 1993/94, Indonesia was almost exactly self-sufficient in rice, on average,
and per capita availability (consumption) increased smoothly in all years but two. In none of the
individual years, however, was domestic production exactly equal to consumption. In some
years—for example, 1984, 1989, and 1992—production was higher than consumption, and
BULOG stocks increased. In other years—for example, 1985 and 1993—production also
exceeded consumption, but, with BULOG warehouses full, the surplus was exported. In 1986,
1987, 1990, and 1991, consumption was slightly higher than production, and BULOG stocks
were drawn down. In 1988, 1992, and 1994, production was again less than the desired
consumption level. With BULOG stocks low, external supplies were called on to provide
stability to Indonesia’s rice markets.
The overall picture is one of stable growth in per capita rice consumption, relative
stability in Indonesia’s rice market, and, perhaps most important from a political perspective, the
Figure 7.1 shows clearly that BULOG was quite successful in stabilizing rice prices from late
1973, when it regained control of domestic prices after a good harvest, until the Asian financial
crisis in late 1997. Table 7.1 presents the comparative evidence by time period using the
coefficient of variation (CV), which is the standard deviation of monthly prices divided by the
mean of prices. The reference for stability of domestic prices is what is happening to world
[image:13.612.75.542.240.450.2]prices.
Figure 7.1 Real Prices of Domestic and Imported Rice in Indonesia, 1969–2012
Source: Data and graphics provided by David Dawe, Food and Agriculture Organization of the United Nations, Bangkok.
As table 7.1 shows, domestic rice prices have been somewhat more stable than world
prices, but the relative stability is especially striking for the Suharto era from January 1969 to
right before the Asian financial crisis in July 1997. During that period, when BULOG was most
successful in its logistical operations, the domestic CV is less than a third of the world CV. The
comparison would be even more striking if it ran from late 1973, after BULOG regained control
of the Indonesian rice economy (and learned its lesson), until mid-1997. Since 1998 (and the
establishment of democracy), BULOG has not been very successful at stabilizing rice prices, but
keeping rice prices high seems to be the political objective rather than achieving stable or 0 500 1,000 1,500 2,000 2,500 3,000 0 2,000 4,000 6,000 8,000 10,000 12,000 14,000 16,000 Jan -69 Au g -71 M ar-7 4 Oc t-7 6 M ay-7 9 D ec-8 1 Ju l-8 4 F eb -8 7 Sep -8 9 Ap r-92 N o v-9 4 Ju n -9 7 Jan -00 Au g -02 M ar-0 5 Oc t-0 7 M ay-1 0 D ec-1 2 20 13 US D p e r ton 20 13 r u p ia h p e r kg
efficient prices. Also worth pointing out is a sharp spike in 1998 in world rice prices as measured
in real rupiah, a spike that does not appear when world rice prices are measured in U.S. dollars.
The difference, of course, is that the Asian financial crisis caused the Indonesian rupiah to
collapse. It is impossible to stabilize domestic rice prices in the middle of a meltdown of the
economy and political system.
Table 7.1 Real Prices of Rice in Indonesia, by Regime, 1969–2014 Rp per kilogram
Indicator
Whole period, January 1969–July
2014
Suharto pre-1998 Asian financial crisis, January 1969–July 1997
Post-Suharto, January 1999–July
2014
Post-2007/98 food price crisis, November 2008 –
July 2014 Mean
Domestic 5,132.91 4,303.20 6,562.17 7,490.28
World 4,760.10 4,452.22 4,988.76 4,928.22
Standard Deviation
Domestic 1,263.43 410.94 943.61 563.05
World 1,591.70 1,448.70 1,042.13 684.18
Coefficient of variation
Domestic 0.25 0.10 0.14 0.08
World 0.33 0.33 0.21 0.14
Source: Data provided by Peter Warr, Australian National University.
Lessons from Indonesian Experience
Increasing rice production was only part of the story of self-sufficiency and rising consumption
of rice. The role of prices and price stability was also important in allowing consumers to
maintain a smooth trend in rice consumption, even though production varied considerably from
year to year.
A key element of the government’s involvement in reaching self-sufficiency is the level
of rice prices maintained in the domestic economy. Other things being equal, a higher level of
rice prices will increase rice production, decrease rice consumption, and make self-sufficiency
easier to achieve. It has often been said that Indonesia can always be self-sufficient in rice at
[image:14.612.70.576.244.420.2]as well. But domestic rice prices do not exist in a vacuum. In particular, their level relative to the
trend of prices in the world market and relative to the costs of farmers’ inputs (especially
fertilizer prices) strongly influences the efficiency with which consumers and producers allocate
the scarce economic resources of the society.
Stabilization itself is also an element in domestic production and its contribution to food
security. The short-run policy issue is the level of BULOG stocks considered appropriate for
maintaining stable rice prices. With infinite stocks, prices can be kept completely stable, but both
economic theory and experience dictate that a finite level of stock cannot defend price stability
under all circumstances.9 Accordingly, an important trade-off exists. Larger buffer stocks permit
a longer period of stable prices, but at costs that rise exponentially with the size of the buffer
stock. Smaller stocks cause prices to fluctuate more, but with substantial cost savings. The only
escape from this apparent dilemma is to add a degree of freedom to the system by permitting
supplies to move into or out of the country, once stocks are drawn down or warehouses are filled
up. As noted, a rigid definition of self-sufficiency removed the operational role for imports for
several years. Still, this experience of trying to understand the value of additional stocks in the
Indonesian context was valuable, because, after the world food crisis in 2007–08, it helped with
understanding the value of additional stocks at a global level (which must be self-sufficient by
definition).10
Three elements of government policy interact to create the economic environment for
self-sufficiency in rice and its subsequent role in food security: (a) public investments in rice
production to maintain it on the trend of rice consumption—mostly in rice research and
extension, irrigation facilities, and rural roads; (b) the establishment of a domestic level of rice
substantial, marketwide fertilizer subsidy in the mid-1980s was a major factor in boosting rice
production to self-sufficiency, and the debate over fertilizer subsidies continues even today); and
(c) the stabilization of domestic rice prices through market interventions using buffer stocks and
imports, when politically feasible, as a balance wheel.
Each of those policy elements has powerful effects on efficiency individually, as well as
direct effects on the state budget, and these effects make each component a separate, important
policy issue. But the interconnections among the three elements make it impossible to set policy
for one without having a substantial impact on the others. Consistency among all three elements
is essential in the long run if substantial resources are not to be wasted. Achieving this
consistency is clearly the most difficult aspect of designing a policy to ensure food security at the
macroeconomic level.
The New Policy Debate: Price Stability at What Price?
Price stabilization has remained an important policy objective during surpluses and deficits, but
the financial costs,11 feasible level of prices, and general policy thrust with respect to the
agriculture sector differ sharply—that is, (a) when the rice economy is in surplus and the main
political problem is maintaining the floor price for rice farmers and (b) when the rice economy is
in deficit and urban prices are rising. Because of the high costs of storing rice in the tropics, the
finite size of stocks, and the sharply limited role for imports for political reasons, wider margins
between the floor price and ceiling price have become a de facto balance wheel as well, but these
wider margins call into question the implicit assumption that food security and price stability are
synonymous.
In 2004, Indonesia made a policy decision to raise domestic rice prices significantly
parity with the price of equivalent rice imports (figure 7.1). By February 2006, however, the
price of domestic rice had risen 25 percent in real terms, whereas the price of equivalent rice on
the world market had fallen 11 percent, an increase of more than a third in the relative price. In
March 2007, the Statistics Indonesia National Socioeconomic Survey (Susenas) on poverty in
Indonesia reported a significant increase in the poverty headcount ratio, despite fairly rapid
economic growth nationwide (BPS 2015b).
In 2006, a vigorous debate developed in Indonesia over the causes of the increase in
poverty, which included the reduction in the fuel subsidy in 2005 and the use of cash transfers to
compensate poor households. The role of high rice prices and the import ban were hotly
contested.12 Calls to allow rice imports went unheeded, and by March 2007, domestic rice prices
were 57 percent higher than world prices. Poverty rates stayed high, and the number of near poor
rose significantly.
The vigorous and open debate late in 2006 over the impact of the rice import ban led to
discussions of how to arrange imports in a timely fashion to prevent further price increases and
harm to the poor. By December 5, 2006, The Jakarta Post ran a headline story by Urip Hudiono
in which Timmer was quoted as saying, “Banning rice imports [is] ‘not the right option.’”
Options for managing the impending rice crisis by arranging emergency rice imports were
prepared for the minister of trade, who immediately requested presidential permission to start the
import process. A presidential decreewas issued on December 9, 2006, authorizing imports.
Unfortunately, there was enough political and bureaucratic opposition to prevent rice imports
from arriving until late February, which was far too late to prevent a sharp spike in rice prices in
December 2006–February 2007. The high poverty rates were directly caused by the decision to
Similar opposition to rice imports materialized late in 2015 and early in 2016, as the El
Niño drought put pressure on domestic supplies and BULOG’s ability to procure rice
domestically. Making the stabilization of rice prices the foundation of Indonesia’s food-based
social safety net is clearly a thing of the past.
Pro-Poor Growth and Food Security: The Inclusion of Rural Households in a
Food-Based Social Safety Net
Only 60 years ago, Indonesia was one of the poorest countries in Asia.13 The story of its poverty
and poverty reduction is a story of the political and economic eras that determined the nation’s
development trajectory: colonial rule and exploitation; authoritarian rule, coupled with sustained
growth and then dramatic collapse; and, most recently, democracy accompanied by economic
flux and tentative stabilization. At Indonesia’s independence, in 1945, the vast majority of its
population was impoverished. By 1993, however, with poverty reduced to 14 percent of the
population and annual economic growth at more than 7 percent, Indonesia was ranked, along
with a handful of other East Asian countries, as a high-performing Asian economy (World Bank
1993) and lauded for its astonishing transformation. To understand this remarkable turnaround, it
is necessary to understand the key factors that drove the change in livelihoods of some 100
million Indonesians.14
History has much to teach Indonesia as it struggles to reestablish economic growth and
reconnect that growth to its remaining poor.Because Indonesia has experienced such sharp
swings in its development path, a multitude of successes and also many failures are available to
examine. Drawing on the vast historical literature in this area (Hofman, Rodrick-Jones, and Thee
2004; MacIntyre 2003; Temple 2001; Timmer 2003), this section briefly sets out that history. It
brought about the structural transformation in the livelihoods of the poor, and then reflects on the
causes and effects of the greatest economic crisis in Indonesian history. The story of three
decades of sustained pro-poor growth, juxtaposed with the story of rapid collapse and recovery,
provides useful insights for future policy making.
Troubled History and Chronic Poverty
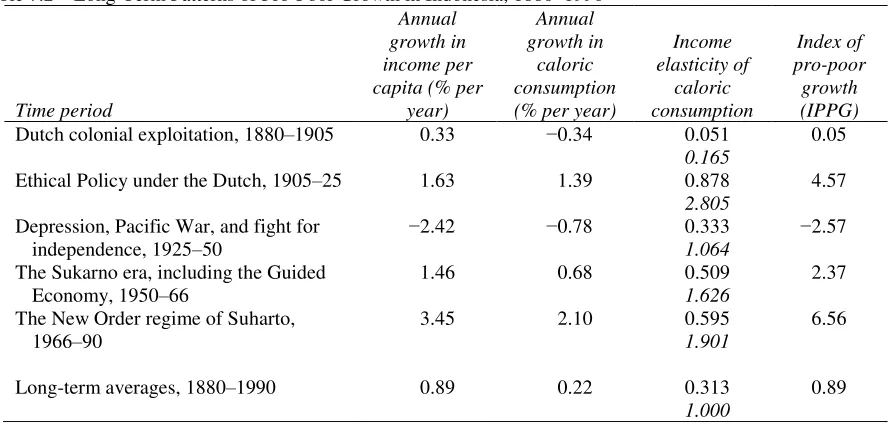
For the duration of the 350-year period of Dutch colonial rule, the trade and tax regime favored
Dutch extraction of income, with dire consequences for the Indonesian population. Analysis
provided by Van der Eng and interpreted by Timmer enables an examination of growth, the
severity of poverty through a comparison of annual food energy intake measured in kilocalories,
and income elasticity of consumption over the past century (table 7.2). During the nineteenth
century, growth in consumption was negative, estimated at −0.34 kilocalories per year, while the
index of pro-poor growth (IPPG) was only a fraction of the long-term average,15 illustrating the
severe disconnect between the situation of the poor and the modest economic growth that
occurred during this period.
At the beginning of the twentieth century, when Dutch public opinion influenced the
management of the colonies, a more developmental approach, known as “ethical policy,” was
implemented briefly. The policy brought significant benefits both to the economy (growth
reached 1.63 percent per year) and to the poor (food intake increased an annual average of 1.39
kilocalories). But this investment in the country lasted for only a brief period. The collapse of
world prices for export commodities in the 1920s and the abysmal economic management of
Indonesia during the Great Depression16 resulted in the lowest rate of growth and pro-poor
Table 7.2 Long-Term Patterns of Pro-Poor Growth in Indonesia, 1880–1990
Time period
Annual growth in income per capita (% per
year)
Annual growth in
caloric consumption (% per year)
Income elasticity of caloric consumption Index of pro-poor growth (IPPG) Dutch colonial exploitation, 1880–1905 0.33 −0.34 0.051
0.165
0.05
Ethical Policy under the Dutch, 1905–25 1.63 1.39 0.878 2.805
4.57
Depression, Pacific War, and fight for independence, 1925–50
−2.42 −0.78 0.333
1.064
−2.57
The Sukarno era, including the Guided Economy,1950–66
1.46 0.68 0.509
1.626
2.37
The New Order regime of Suharto, 1966–90
3.45 2.10 0.595
1.901
6.56
Long-term averages, 1880–1990 0.89 0.22 0.313
1.000
0.89
Source: Timmer 2005.
Note: See text and endnote 15 for the definition of IPPG and an explanation of how it is calculated and interpreted. Details of the regressions are provided in Timmer (2005), along with a full explanation of the analytical relationship between the overall incidence of poverty and the average income elasticity of demand for food energy. Income elasticity of food energy for the entire period from 1880 to 1990, estimated to be 0.313, is used as the long-run base, scaled to 1 (italicized in the table).
By the 1930s, the colonial authorities had built a significant network of irrigation and
transport facilities, but there was very little investment in educating the nation’s population.
Poverty increased significantly during World War II and the subsequent struggle for
independence, which reached closure only with final acceptance by the Dutch in 1949. The
tumultuous global period spanning the Great Depression, the Pacific War, and the fight for
independence (1925–50) saw a marked deterioration in rates of per capita income growth (−2.42
percent) and a negative rate of pro-poor growth (−2.57 percent).
By the early 1960s, as in other postindependence states, poverty had fallen in the postwar
recovery, and Indonesia was muddling along with modest growth and weak but quasi-democratic
governance. After Sukarno imposed “guided democracy” in 1959, however, the situation
deteriorated sharply. By adopting an inward-looking development policy and severely neglecting
[image:20.612.83.531.81.293.2]weak governance and a sickly economy” (MacIntyre 2003, 1). Incomes fell dramatically, and the
hyperinflation of 1965–66 had an adverse effect on the entire population, as the poverty rate
increased rapidly and the economy collapsed.17 An estimated 70 percent of the population was
absolutely poor by 1966. Hunger was widespread (Timmer 2003). In 1968, with no hint of the
future, Gunnar Myrdal observed, “No economist holds out any hope for Indonesia” (Myrdal
1968).
A Period of Growth and Rapid Poverty Reduction
The trajectory of growth and poverty transformed dramatically under the New Order government
of President Suharto. Starting in 1968, for three remarkable decades, Indonesia’s gross domestic
product (GDP) grew an average of 7.4 percent annually. As a result, in 1997 Indonesia’s per
capita income reached US$906, more than quadruple the 1968 level.18 When compared with
previous periods in Indonesian history, the quarter century from 1965 to 1990 saw an annual
growth in caloric intake of 2.1 percent a year, 50 percent higher than the next best period in
1905–25 and almost 10 times the long-term average. The IPPG reached 6.56 for the period
1965–90—the highest in Indonesian history—seven times the long-term average and nearly half
again as large as the next best period in 1905–25 (table 7.2).
As the export economy boomed in the late 1980s and early 1990s and overall GDP grew
nearly 7 percent annually, roughly half of that growth was made up of nontradable goods and
services, where most of the poor make a living (Timmer 1997, 2002, 2004). The structure of
economic growth during this period led to a remarkably high growth elasticity of poverty (table
7.3).
Table 7.3 Growth Elasticity of Poverty in Indonesia, 1967–2002
Annual % change Growth elasticity of Time period Per capita income Poverty index poverty
[image:21.612.76.526.675.713.2]1976–80 6.37 −8.1 −1.27
1980–84 4.23 −6.8 −1.61
1984–87 2.69 0.7 −2.60
1987–90 6.66 −4.6 −0.81
1990–93 5.41 −4.6 −0.85
1993–96 5.23 −6.2 −1.19
1996–99 3.25 9.9 −3.05 (+)
1999–2002 2.49 −8.2 −3.29
Source: Timmer 2005.
Note: The growth elasticity of poverty is calculated as the ratio of the percentage reduction in the poverty headcount index relative to the percentage change in per capita income (in US$ purchasing power parity) from the World Bank database on pro-poor growth.
Sound macroeconomic management was strongly supported by investment in sectors that
benefited the poor—education, health, family planning, and infrastructure—enabling the poor to
benefit from the country’s oil windfall at the household level. The windfall also supported the
development of widespread and large-scale investment in infrastructure assets, significantly
lowering transaction costs.
The government’s success in reinstating macroeconomic stability and, through the
exchange rate, bringing down the relative price of rice, was critical to Indonesia’s rapid reduction
of the poverty rate from its crisis spike of 23.4 percent in 1999 to 18.2 percent in 2002. The fall
in the relative price of rice (index of rice prices over all food prices) from 1.43 to 1.08 over the
period from September 1998 to September 2000 was a key factor driving the decline in poverty
over that period. Although the poverty headcount rates declined to precrisis levels, studies also
suggest that the crisis had lasting impacts. Ravallion and Lokshin (2005) estimate that the
poverty headcount index would have been about half what it was in 2002 had the crisis not taken
place.
The crisis and recovery showed that the price of rice is the most important determinant of
poverty at the household level in Indonesia. Macroeconomic price stability matters to the poor
lower prices have direct, short-term benefits on the poorest quintiles but also because they play a
key role in the structural transformation of the agriculture sector and economy as a whole. In
agriculture, low rice prices encourage farmers to diversify crops and to plant less rice by making
rice less valuable to farmers at the market. The result is a move toward crops that give the poor
higher profit margins. In Indonesia, artificially high rice prices have slowed the crop
diversification process as well as investments in nonfarm rural activities (Timmer 2004).
During the severe economic contraction in 1998–99, the government developed and
extended several formal safety net programs.The Jaring Pengaman Sosial (JPS) social safety net
programs, known until then for their patchy record, were extended to protect the chronically and
transitory poor from the impacts of the crisis. Initially, these crash programs were directed to
urban areas throughout the country, but they were also intended to reach rural areas where
harvest failures were causing significant hardship. The JPS programs had four goals: (a) to
ensure that the poor could obtain food at affordable prices, (b) to create employment, (c) to
preserve access to social services such as health and education, and (d) to sustain local economic
activity through regional block grants and small-scale credit programs (Sumarto, Suryahadi, and
Pritchett 2001). Evidence highlights the mixed effectiveness of the various programs (SMERU
2004). Although the scholarship program helped to keep children in school and the health card
program improved access of the poor to public health facilities, the Rastra program saw higher
levels of capture by upper quintiles. The next section analyzes the performance of Rastra.
From Price Stability to Food Access: The Rastra Program
The previous sections have highlighted the role played by price stability at the aggregate level.
stable at exceptionally high levels. This disconnect, as pointed out, led the government to
provide subsidized rice for poor households. In the following sections, the chapter moves from a
historical macro-level perspective to a more micro-level perspective on design and
implementation matters related to Rastra.
Rice accounts for nearly a quarter of the total average monthly expenditures among poor
households, consuming 34 and 26 percent of the rural and urban poverty budgets, respectively.
This finding suggests that the issue of food security—particularly in regard to rice as a staple
food—still requires serious attention.
The adequacy of food in terms of quality and quantity is important for Indonesian
development because several nutritional indicators still need attention. In terms of quantity, the
proportion of people who consume less than the required daily intake of 1,400 or 2,000 calories
remains quite high, at 8.5 and 35.3 percent, respectively, in 2013. In terms of nutritional quality,
between 2007 and 2013, the nutritional status of children under five stagnated or even worsened,
the prevalence of underweight children increased from 18.4 to 19.6 percent, stunting increased
from 36.8 to 37.2 percent, and the prevalence of central obesity (accumulation of belly fat) rose
from 18.8 to 26.6 percent. Only the prevalence of wasting improved slightly, falling from 13.6
percent in 2007 to 12.1 percent in 2013 (Isdijoso and others 2014).
The government has made efforts to increase food security and adequacy, together with
reducing poverty, through social protection and poverty alleviation programs. To ensure
sufficient food, especially for low-income groups, the government has introduced food subsidies,
primarily in the form of rice. Essentially, Rastra is a continuation of the OPK program, which
was undertaken by the government during the 1997–98 economic crisis. It commenced in July
on households by fulfilling basic needs with rice. Since January 2002, Rastra was broadened in
scope, shifting from a project focused on responding to crisis situations through food subsidies to
become a program aimed at social protection for the poor.
Rastra is the most well-funded social assistance program in Indonesia. In 2007, the total
allocation for the program was Rp 6.6 trillion or around 43.1 percent of the total budget for
social protection programs, and it covered as many as 15.7 million target households. In 2016,
the total budget allocation for Rastra increased threefold, to Rp 21 trillion, with coverage of 15.5
million households. The allocation for each household is 15 kilograms of rice per month at a
price of Rp 1,600 per kilogram at the distribution point. Rastra now accounts for more than half
of total social assistance expenditure.
Throughout its implementation, Rastra has undergone changes in relation to its
institutionalization, coverage, frequency of distribution, quantity of rice allocations, cost of rice,
and implementation mechanisms. Several of those changes were made to align the program with
changes in budget allocations, poverty conditions, and rising costs. Others changes were made to
improve the program’s effectiveness or to accommodate recommendations from various sources.
Institutionalization
Rastra cuts across sectors vertically and horizontally, and it engages many institutions at all
levels of government. Nationally, the responsibility for implementation rests with the
Coordinating Ministry for Human Development and Culture (Menko PMK). Furthermore, each
government leader at the provincial, district, subdistrict, and village levels is responsible for
Rastra coordination team in their region. At the village level,19 the coordination team is called
the distribution team.
The membership of Rastra coordination teams cuts across sectors. At the central level,
membership comprises representatives from Menko PMK, the Coordinating Ministry for the
Economy, the Ministry of National Development Planning, the Ministry of Finance, the Ministry
of Home Affairs, the Ministry of Social Affairs, Statistics Indonesia (BPS), and BULOG. At the
provincial and lower levels, membership is also taken from agencies at the relevant level of
government with responsibilities similar to those at the national level. In general, Rastra
coordination teams are tasked with coordinating and managing policy formulation, planning,
quota determination, public socialization, complaint handling, monitoring and evaluation, and
reporting (see annex 7A)
The organizational structure of Rastra has been subject to several adjustments, and the
role of BULOG has tended to decline. When OPK was first implemented, program coordination
was the responsibility of the Ministry for Food and Horticulture. That ministry was dissolved at
the end of 1999, and BULOG took responsibility for coordinating OPK. In 2007, Menko PMK,
which before October 2014 had been called the Coordinating Ministry for Social Welfare,
became the program coordinator. The agency with authority over budget expenditure also has
changed. The power to authorize the budget was held by BULOG in 2005–07 and again in 2010–
11, by the Coordinating Ministry for Community Welfare in 2008–09, and since 2012 by the
Ministry of Social Affairs. Since the beginning of the program, BULOG has been responsible for
the provision and distribution of rice from acquisition (from BULOG warehouses) through to the
In theory, the institutionalization of Rastra is geographically sufficient and
comprehensive, because it involves many cross-sectoral agencies at all levels of government.
Each agency at the central level tends to carry out its own specific function, such as the Ministry
of Social Affairs for budget expenditure, BPS for the provision of data, and BULOG for the
distribution of rice. Meanwhile, interagency cooperation, which determines the program’s
effectiveness, remains weak. Coordination between levels of government, from the central to the
district level, is also weak. Weak coordination is largely due to the implementation of
decentralization in Indonesia since 2001.
Regional governments are responsible for implementation in their region, for their
coordination teams, and for the delivery of rice from the distribution point to beneficiaries. Local
governments are expected to allocate funds to the regional budget for Rastra, at least for the
transport of rice from distribution points to recipient households. Regions with larger budgets
can allocate funds for further development; for example, they can provide funding to expand the
provision of rice to additional households beyond the initial quota, add a subsidy that lowers the
buying price for beneficiaries, empower the community through the Padat Karya Rastra (Rastra
for Work) program, and distribute Rastra through more accessible locations such as local stalls
and through community groups.
The role of regional governments in implementation, especially for budget provision,
varies. Districts vary in the level of funding from their own budget for Rastra implementation,
but most districts do not provide any funding at all (Hastuti and others 2008, 28). Some regional
governments have a negative attitude toward the program, seeing Rastra as a central government
program that does little good for regions; some governments refuse to implement it altogether
to local governments outweigh the benefits of the small amount of rice received (Hastuti and
Maxwell 2003, 15). Furthermore, regional governments may be concerned that targeted social
assistance programs will exacerbate preexisting social conflicts. However, the number of
regional governments that pay attention to Rastra has grown over the past few years. Some
districts have even decided to make Rastra free. These districts have not only available funds, but
also a political desire to lower poverty rates. They also may be responding to awareness-raising
efforts and encouragement from provincial governments.
Rastra program management is regulated by implementation guidelines that are created
and published each year by the coordination teams at several levels. The Central Rastra
Coordination Team creates the general Rastra handbook as a policy directive for nationwide
implementation. Each provincial implementation team creates implementation instructions, and
each district coordination team creates a technical guide. The implementation instructions and
technical guides are based on the general guidelines but can be adapted for the local conditions
and situations of each area. According to Hastuti and others (2008, 6), only a few local
governments have prepared instructions for the program’s implementation. Even when such
instructions have been prepared, the contents are merely a copy of the general guidelines,
without any further detailed stipulations. Rastra institutionalization is also subject to a control
system that is conducted through oversight, reporting, monitoring and evaluation, and complaint
handling. Those activities are carried out in stages at all levels of government at assigned periods
(see annex 7B)
Rastra is part of the broader poverty alleviation agenda of the central government and is
implemented in coordination with other poverty alleviation programs. The institutions for
Kemiskinan (TNP2K, National Team for the Acceleration of Poverty Reduction), which is
headed by the vice president. Before TNP2K was established in 2010, the Tim Koordinasi
Penanggulangan Kemiskinan (TKPK, National Team for Poverty Reduction) operated at the
national level. Similar bodies operate at the provincial and district levels and are under the
authority of the head of the district or province. Those teams, made up of a cross-section of
sectoral and stakeholder representatives, are tasked with coordinating and managing poverty
alleviation programs, including Rastra.
TKPKs at the provincial and district levels are designed to bridge poverty alleviation
programs, but in actual implementation they are often not functional. In several districts,
stakeholders told researchers that they were unaware of the existence of the team. According to
Sumarto, Vothknecht, and Wijaya (2014), TKPK plays a significant role in reducing poverty. In
districtsthat have had a TKPK office for at least one year, poverty was found to be more than 1
percentage point lower than in districtswhere a TKPK office had not yet been established. In
addition, in districts that have had a TKPK office for at least three years, poverty incidence was
found to be nearly 4 percentage points lower than in a districtwith no TKPK office.
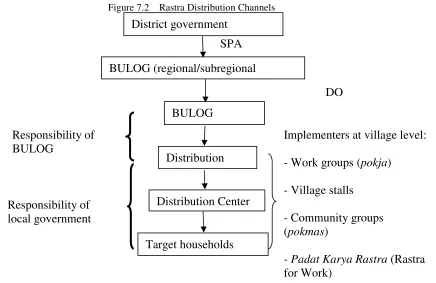
Distribution Mechanisms
Rastra distribution involves two bodies: BULOG and the regional governments. BULOG is
responsible for transport from the storage warehouse to the distribution point, and regional
governments are responsible for transport from the distribution point to each target household
(figure 7.2). The distribution of Rastra commences when the district government issues a request
storehouse to release the rice to the appointed work unit (satker). The work unit then sends the
[image:30.612.72.508.126.409.2]rice to the agreed-upon distribution point, in accordance with the target households.
Figure 7.2 Rastra Distribution Channels
Note: DO = delivery order; SPA= Surat Permintaan Alokasi (allocation request document); BULOG = State Logistics Board.
Since 2012, local governments have four options for distributing goods from the
distribution point to households. In practice, almost all use the same method, which involves
work teams consisting of village officials or heads of neighborhood subdivisions—RTs (groups
of neighborhood households), RWs (groups of RTs), and hamlets.20The work team takes the rice
that has been delivered by BULOG to the distribution point and transports it to local distribution
centers, except when distribution points also serve as local centers.Distribution centers are
usually located in a village office. In some regions, primarily outside of Java, local distribution
centers are located at a subdistrict office or are merged with other village distribution centers SPA
District government
BULOG (regional/subregional
BULOG
Distribution Center
Target households
DO
Distribution
Implementers at village level:
- Work groups (pokja)
- Village stalls
- Community groups (pokmas)
- Padat Karya Rastra (Rastra for Work)
Responsibility of BULOG
because of transportation limitations. Moreover, distribution centers in some villages may spread
across several locations, such as in homes of neighborhood leaders (of the RT or RW) or hamlet
leaders. Once the rice arrives, the work team advises households to pick up their allocation of
rice at the distribution center, using both loudspeakers located at places of worship and word of
mouth.
The total amount of time needed for one distribution usually does not exceed one week.
On the day the allocation request document is received from the regional government, the
regional BULOG submits a distribution order to the warehouse, which then delivers rice to the
distribution point. From the distribution point, the rice is distributed to local distribution centers
or directly to households. The length of time from when the rice is received at the distribution
center to the completion of distribution to households is usually one to three days.
Cost of Subsidies
Through Rastra, the government has provided increasingly large subsidies for rice (figure 7.3). In
2005, the subsidy amounted to Rp 2,494 per kilogram, which rose each subsequent year and in
2015 was worth Rp 6,725 per kilogram. This increase occurred because the government’s
purchase price increased, although the cost to target households remained relatively steady. The
government’s purchase price increased in line with shifts in the market price of rice, from Rp
3,494 per kilogram in 2005 to Rp 8,825 per kilogram in 2015, a 2.5-fold increase over 10 years.
At the same time, the subsidized price for target households at distribution points remained Rp
1,000 per kilogram from the start of the program to 2007 and only increased once, in 2008, to Rp
Figure 7.3 The Price of Rastra Rice and Cost of Government Subsidies in Indonesia, 2002–16
<Fig source>Source: Republik Indonesia 2004–16.
<Fig note>Note: Subsidy figures for 2015 and 2016 are budget figures.
Name the panels as “a” and “b”; set panel titles and key labels in sentence case, e.g. “Total
subsidy (Rp, trillions)”, “Subsidized price”; Govt = Government in first panel; change hyphen to zero; in panel b, create y-axis; remove “.0” from y-axis labels.>
The national budget funds Rastra through to the delivery of rice at each distribution point.
The cost of Rastra subsidies has risen significantly along with increases in the government’s
purchase price, the number of target households, the frequency of distribution, and the costs of
distribution and storage. Those increases were significant over the 2007–13 period. Despite a
decrease in the number of target households since 2010, the frequency of distribution has
increased, with 15 distributions in 2013. In 2014, the total cost of the subsidy declined because
there was no increase in the frequency of distribution (which had increased from 13 deliveries
per year in 2010–12 to 15 per year in 2013), but in 2016 the distribution cost rose again to Rp 21
trillion.
The Rastra subsidy is used to fund three main activities: procurement, storage, and
distribution of rice to the distribution points. During 2002–07, most of the subsidy was spent on
procurement (41–80 percent). Other cost components included repayment of interest (7–13
percent), operational costs (5–11 percent), management fees (3–6 percent), bank fees (1–2 1,000 2,000 3,000 4,000 5,000 6,000 7,000 8,000 9,000
2005 2006 2007 2008 2009 2010 2011 2012 2013 2014 2015
Raskin Prices and Subsidies (Rp/kg)
Govt Purchase Price Subsidy Subsidised Price
2.4
4.5 4.7 4.8 6.4 5.3 6.6 12.113.0 15.216.5 19.1 21.5 18.218.9 21.0 0.0 5.0 10.0 15.0 20.0 25.0
2002 2004 2006 2008 2010 2012 2014 2016
percent), and packaging costs (1–3 percent). Until 2004, costs for historic stock carryover
accounted for 22–43 percent.
Target Households
Rastra targets are poor and vulnerable households; however, depending on the data sources used,
target criteria have changed several times. Until 2005, Rastra used Badan Koordinasi Keluarga
Berencana Nasional (BKKBN, National Family Planning Coordination Board)data, which at
that time were the only national-level data that provided family-level information. Target
households were classified as keluarga pre-sejahtera (pre-prosperous family) and keluarga
sejahtera 1 (prosperous family 1), the two lowest classifications on a five-point scale of family
economic welfare. However, for the first two years of implementation, families experiencing
food insecurity were also included, on the advice of regional governments. After BPS conducted
a survey of very poor, poor, and near-poor households through the socioeconomic survey of
2005, Rastra used these data over the period 2006–09.21 From 2010 to 2012, data from the 2008
Social Protection Program Census (PPLS) were used, and since July 2012, the Basis Data
Terpadu (BDT, Unified Database), a national database for social protection programs (managed
by the TNP2K), which is sourced from the 2011 PPLS, has been used. The target groups of the
final two surveys conducted by BPS are poor and vulnerable households.
The number of target recipients of Rastra has changed in line with the levels of poverty
and budget allocations. The total rose yearly and peaked in 2008, before falling slightly. These
figures do not necessarily reflect the total number of poor and vulnerable people, because, except
for 2008–12, Rastra targets did not include all poor and vulnerable groups or households
million households (figure 7.4). That number includes 62 percent of households in the BDT and
[image:34.612.73.517.131.292.2]around 24 percent of all households in Indonesia.
Figure 7.4 Total Number of Poor Households and Rastra Target Households in Indonesia, 1998–2015
Source: Kemenko Kesra 2015. In particular, data for target and total poor households in 1998 and 2000–10 are from BULOG 2011 (BULOG provided the authors with a table containing Rastra characteristics); data for target households in 1999 are from Tabor and Sawit 2001; data for target households in 2011–15 are from Kemenko Kesra 2015; data for total poor in 2011–12 are the same as for total poor in 2010 (2008 Social Protection Program Census data).
Note: Data on target households in 1998 and 1999 are the highest number of targets. Target households are those that the government intended to support. Actual recipients are higher in number due to de facto redistribution at the village level.
Data on the total number of target recipients are used to establish quota allocations from
the national down to the village level. Allocations are made at different levels. First, the
government, together with the parliament, determines the national allocation. Second, Menko
PMK determines the allocations for each province. Third, provincial governors determine the
allocations for districts and cities. And fourth, the regent or mayor determines the allocations for
subdistricts and villages. In determining the quota for regional allowances, governors and regents
or mayors must refer to the quota determined by Menko PMK. However, they can increase the
total number of target households with funding from their own regional budget. The quota for
villages cannot be reallocated to other villages unless doing so is discussed at the district level, at
the request of two villages. Targeting accuracy, an important aspect of achieving program goals,
has been a primary weakness of the program. The eventual number of recipient households far
9.6 10.5
7.5 8.7 9.8 8.6 8.6 8.3
10.8 15.8
19.1 18.5 17.5 17.5 17.5
15.5 15.5 15.5
5.0 10.0 15.0 20.0 25.0 30.0
outweighs the number of target households. Recipient households are not all from poor or
vulnerable backgrounds; they also include households with adequate levels of welfare.
Nationally, data from the Susenas, the BPS socioeconomic survey, shows that the number of
recipient households is around twice as large as the number of target households. When the
number of target households increased significantly in 2007 and 2008, the gap between the
number of recipients and targets decreased somewhat before rising again to a twofold difference
in 2013. In 2014, target households amounted to only 15.5 million, but recipient households
[image:35.612.74.444.293.467.2]totaled 33.4 million (figure 7.5).
Figure 7.5 Total Number of Rastra Target and Recipient Households in Indonesia, 2002–14
<Fig source>Source: BPS 2015b (raw data from 2002 to 2014).
Half of the households in Indonesia purchase Rastra rice. Figure 7.5 shows a relatively
steady increase in the number of recipients or households that purchase subsidized rice. In 2002,
when the total number of households was around 55 million, the number of Rastra-recipient
households was around 21 million or 38 percent of the total. Since 2007, that proportion has
reached more than 50 percent, and in 2014—when the total number of households was 65
million—households receiving Rastra rice constituted 52 percent of the total.
Results of data analysis based on expenditure deciles show both inclusion and exclusion
errors (figure 7.6). In the first error, Rastra recipients are not exclusively from the lower deciles;
20.9 22.5 19.5 22.9 24.5
29.4 30.5 30.2 31.0
32.6 33.2 32.8 33.4
9.8 8.6 8.6 8.3 10.8
15.8
19.1 18.5 17.5
17.5 17.5 15.5 15.5 0.0 5.0 10.0 15.0 20.0 25.0 30.0 35.0 40.0
2002 2003 2004 2005 2006 2007 2008 2009 2010 2011 2012 2013 2014
those in high-expenditure deciles are also included, although the higher the decile, the lower the
proportion of households receiving Rastra. The rate of leakage is quite high. In 2002–14, target
households—the first three deciles of expenditure—amounted to between 15 and 33 percent of
the total number of households. However, in the same period, between 51 and 57 percent of
[image:36.612.77.541.244.571.2]recipients were outside these target deciles.
Figure 7.6 Benefit Incidence in Indonesia, by Expenditure Decile, 2002 and 2014
Source: BPS 2015b.
Note: Deciles are divided on the basis of expenditure categories. The higher the decile, the higher the level of household expenditure or welfare.
The exclusion error is seen in the proportion of recipients in the lowest three deciles,
which demonstrates that some poor and vulnerable households do not receive Rastra. However,
the proportion of recipients is higher in the lower deciles than in the upper, showing that the
0.00 5.00 10.00 15.00 20.00
1 2 3 4 5 6 7 8 9 10
Target Households
a. Benefit incidence among all household recipients (%)
2002
2014
0.00 20.00 40.00 60.00 80.00 100.00
1 2 3 4 5 6 7 8 9 10
b. Benefit incidence at each expenditure decile (%)
Inclusion error
Target Households
Exclusion error
2014
poorest groups have the greatest access to Rastra. There was some improvement in 2002–14,
with those in the bottom 30 percent receiving a greater share of total Rastra benefits. In 2014, the
proportion of households in the lowest three deciles receiving Rastra was 72, 66, and 63 percent,
respectively.
Field research has produced the same findings: inaccurate targeting is the key weakness
of the program because not all poor households receive Rastra rice, while many nonpoor
households do (Hastuti and others 2008, 14). Moreover, Rastra rice tends to be distributed evenly
across all households in the village—that is, it is distributed to more than the targeted
households. A field report at the end of 2015 found that all 10 villages studied (across five
provinces) practiced even distribution. Although the central implementation team makes
available the list of target households (the beneficiary list), the lists generally are not used at the
village level to identify recipient households. Instead, they are used only to determine overall
allocations of rice for each area. Implementers in villages, smaller neighborhood units (RT or
RW), or hamlets generally determine the recipients.
The even distribution of Rastra rice is usually related to the social and political context
and the limitations of information available to program implementers. Implementers at the local
level consider rice to be a basic need for all levels of society. Aside from this expectation, local
implementers also believe that because cooperative community projects (gotong royong) or
events to collect donations expect everyone to contribute, when assistance is available, the whole
community is entitled to benefit. Otherwise, they are concerned that community harmony would
be disrupted and that community members would no longer be willing to assist with community